
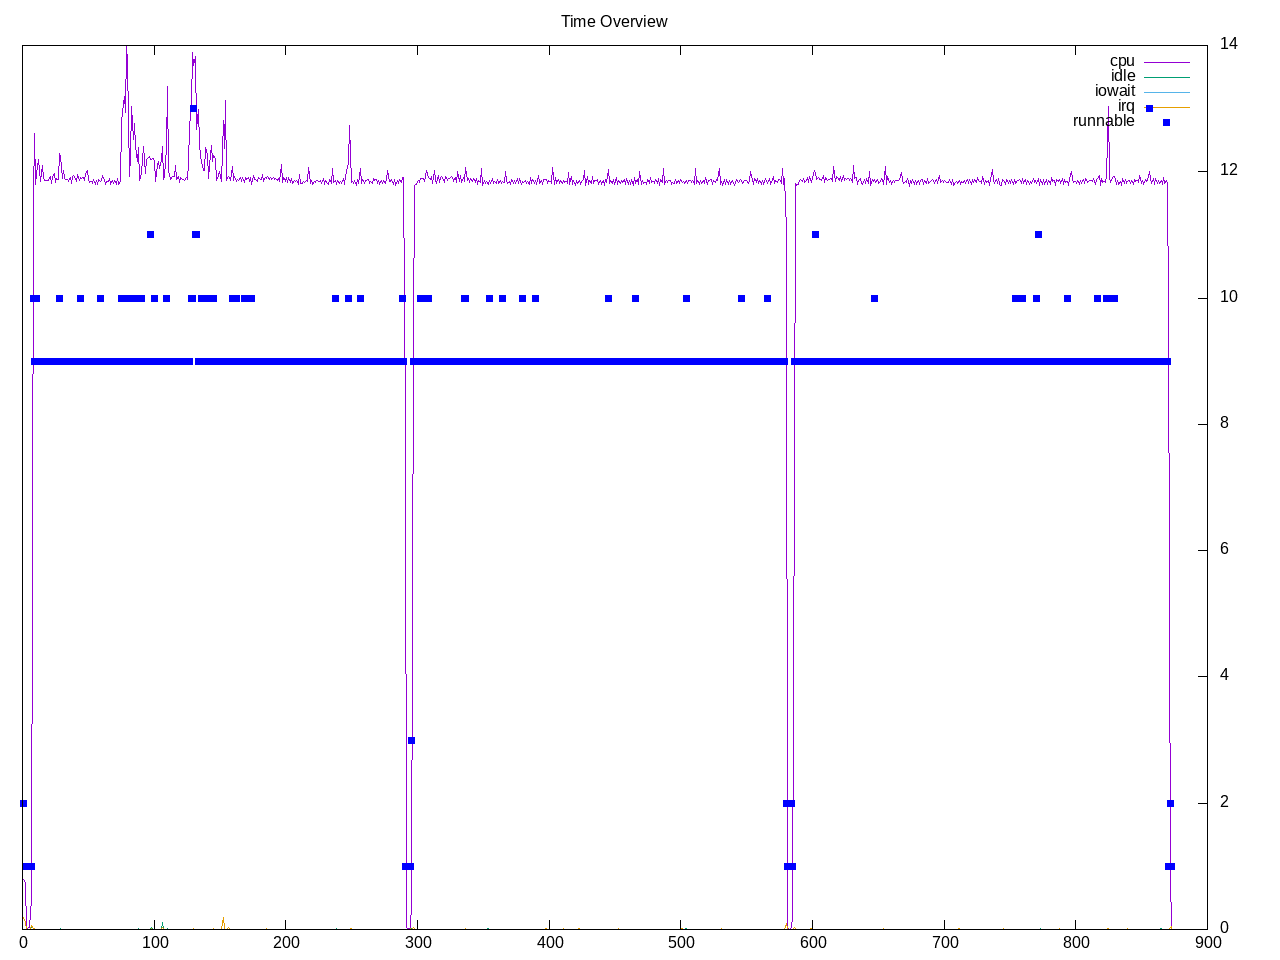
High performance conjugate gradient benchmark. – link – used to measure super computers. There are multiple sizes from 104x104x104 to 192x192x192 and two runtimes from 60 to 1800 where 1800 is what is used to officially submit scores. I picked the 144x144x144 size. It reports a metric in GFLOP/s. Overall profile runs consistently on eight threads, suggesting a MPI run.
Topdown profile shows mostly backend bound with a low retirement rate.
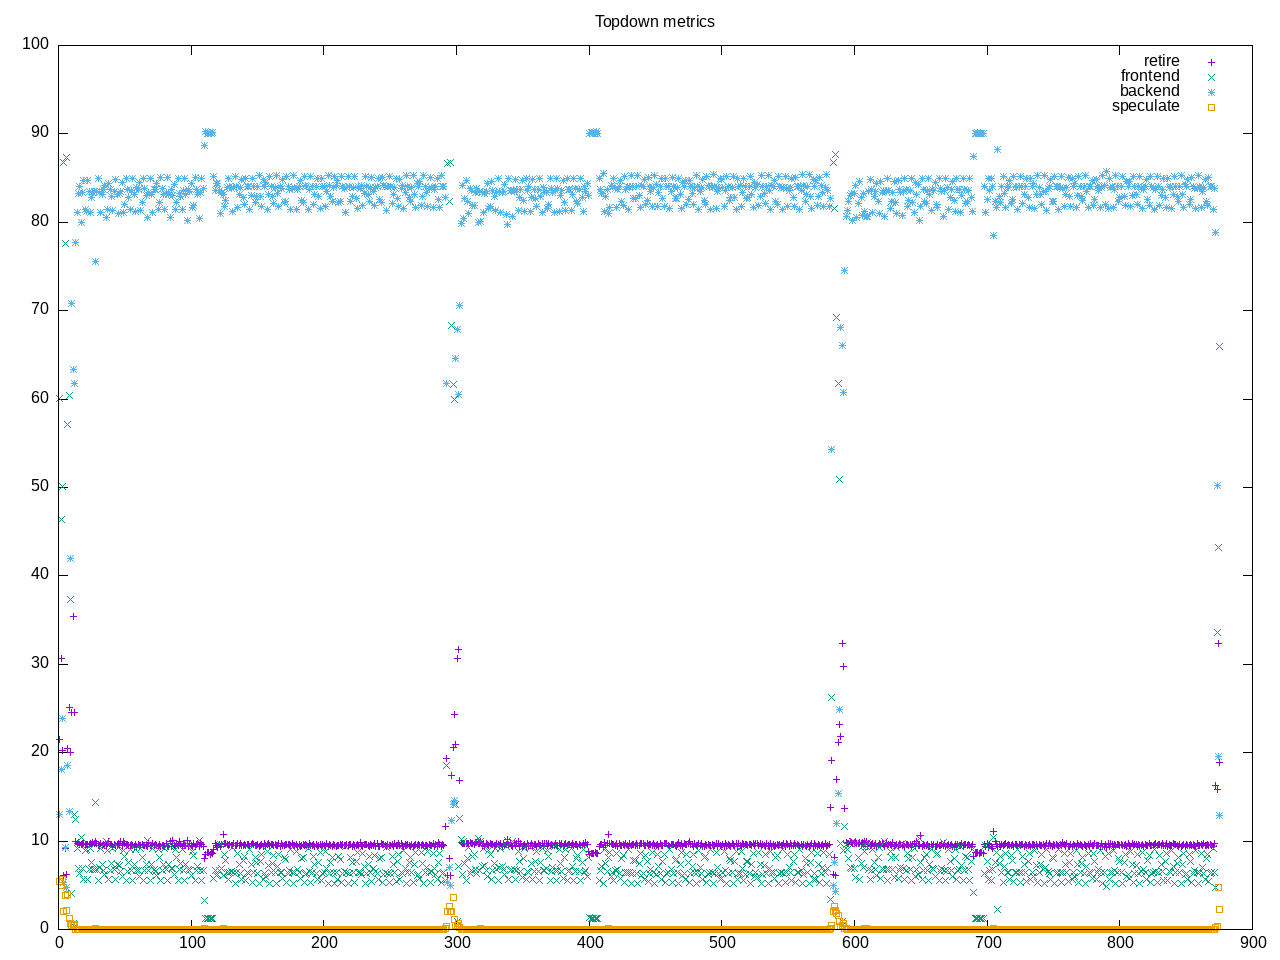
AMD metrics show ~150 floating point instructions per 1000, and confirm the low retirement, high backend memory stalls and low speculation.
elapsed              875.134
on_cpu               0.488          # 7.81 / 16 cores
utime                6797.617
stime                41.324
nvcsw                35941          # 66.67%
nivcsw               17964          # 33.33%
inblock              6880           # 7.86/sec
onblock              62312          # 71.20/sec
cpu-clock            6840078255450  # 6840.078 seconds
task-clock           6840172325218  # 6840.172 seconds
page faults          16133100       # 2358.581/sec
context switches     58112          # 8.496/sec
cpu migrations       9711           # 1.420/sec
major page faults    331            # 0.048/sec
minor page faults    16132769       # 2358.533/sec
alignment faults     0              # 0.000/sec
emulation faults     0              # 0.000/sec
branches             2634432109888  # 143.289 branches per 1000 inst
branch misses        3672582283     # 0.14% branch miss
conditional          2568043704731  # 139.678 conditional branches per 1000 inst
indirect             6032629780     # 0.328 indirect branches per 1000 inst
cpu-cycles           30968079590724 # 2.21 GHz
instructions         18395333044799 # 0.59 IPC low
slots                61921102171122 #
retiring             6078821159224  #  9.8% ( 9.8%) low
-- ucode             839491495      #     0.0%
-- fastpath          6077981667729  #     9.8%
frontend             4307346648297  #  7.0% ( 7.0%)
-- latency           1798699792212  #     2.9%
-- bandwidth         2508646856085  #     4.1%
backend              51459872447555 # 83.1% (83.2%) high
-- cpu               8352863384115  #    13.5%
-- memory            43107009063440 #    69.6%
speculation          26131829493    #  0.0% ( 0.0%) low
-- branch mispredict 24835216381    #     0.0%
-- pipeline restart  1296613112     #     0.0%
smt-contention       48912860156    #  0.1% ( 0.0%)
cpu-cycles           30958977523557 # 2.21 GHz
instructions         18352926259460 # 0.59 IPC low
instructions         6114645283233  # 65.650 l2 access per 1000 inst
l2 hit from l1       224097131601   # 42.88% l2 miss
l2 miss from l1      5729334541     #
l2 hit from l2 pf    10927118257    #
l3 hit from l2 pf    778865718      #
l3 miss from l2 pf   165624449263   #
instructions         6111909121253  # 145.740 float per 1000 inst
float 512            49             # 0.000 AVX-512 per 1000 inst
float 256            772            # 0.000 AVX-256 per 1000 inst
float 128            890750308112   # 145.740 AVX-128 per 1000 inst
float MMX            0              # 0.000 MMX per 1000 inst
float scalar         45             # 0.000 scalar per 1000 inst
instructions         2664431        #
opcache              983447         # 369.102 opcache per 1000 inst
opcache miss         528168         # 53.7% opcache miss rate
l1 dTLB miss         5740           # 2.154 L1 dTLB per 1000 inst
l2 dTLB miss         1194           # 0.448 L2 dTLB per 1000 inst
instructions         2681848        #
icache               1285641        # 479.386 icache per 1000 inst
icache miss          107266         #  8.3% icache miss rate
l1 iTLB miss         15             # 0.006 L1 iTLB per 1000 inst
l2 iTLB miss         0              # 0.000 L2 iTLB per 1000 inst
tlb flush            20             # 0.007 TLB flush per 1000 inst
Process overview shows xhpcg taking almost all the time.
447 processes
	 72 xhpcg                20371.80   101.43
	 68 clinfo                  17.54     5.97
	 18 mpirun                   0.93     2.65
	 38 vulkaninfo               0.91     1.34
	  6 php                      0.11     1.11
	  4 vulkani:disk$0           0.09     0.15
	  6 glxinfo:gdrv0            0.08     0.10
	  6 glxinfo:gl0              0.08     0.09
	  6 clang                    0.06     0.06
	  2 llvmpipe-0               0.05     0.07
	  2 llvmpipe-1               0.05     0.07
	  2 llvmpipe-10              0.05     0.07
	  2 llvmpipe-11              0.05     0.07
	  2 llvmpipe-12              0.05     0.07
	  2 llvmpipe-13              0.05     0.07
	  2 llvmpipe-14              0.05     0.07
	  2 llvmpipe-15              0.05     0.07
	  2 llvmpipe-2               0.05     0.07
	  2 llvmpipe-3               0.05     0.07
	  2 llvmpipe-4               0.05     0.07
	  2 llvmpipe-5               0.05     0.07
	  2 llvmpipe-6               0.05     0.07
	  2 llvmpipe-7               0.05     0.07
	  2 llvmpipe-8               0.05     0.07
	  2 llvmpipe-9               0.05     0.07
	  2 glxinfo                  0.04     0.04
	  2 glxinfo:cs0              0.04     0.04
	  2 glxinfo:disk$0           0.04     0.04
	  2 glxinfo:sh0              0.04     0.04
	  2 glxinfo:shlo0            0.04     0.04
	  3 rocminfo                 0.03     0.00
	  1 lspci                    0.00     0.01
	  1 ps                       0.00     0.01
	 82 sh                       0.00     0.00
	 13 gcc                      0.00     0.00
	  8 stat                     0.00     0.00
	  8 systemd-detect-          0.00     0.00
	  7 gsettings                0.00     0.00
	  6 llvm-link                0.00     0.00
	  5 gmain                    0.00     0.00
	  5 phoronix-test-s          0.00     0.00
	  4 dconf worker             0.00     0.00
	  3 cat                      0.00     0.00
	  3 hpcg                     0.00     0.00
	  3 rm                       0.00     0.00
	  2 cc                       0.00     0.00
	  2 lscpu                    0.00     0.00
	  2 uname                    0.00     0.00
	  2 which                    0.00     0.00
	  2 xset                     0.00     0.00
	  1 date                     0.00     0.00
	  1 dirname                  0.00     0.00
	  1 dmesg                    0.00     0.00
	  1 dmidecode                0.00     0.00
	  1 grep                     0.00     0.00
	  1 ifconfig                 0.00     0.00
	  1 ip                       0.00     0.00
	  1 lsmod                    0.00     0.00
	  1 mktemp                   0.00     0.00
	  1 qdbus                    0.00     0.00
	  1 readlink                 0.00     0.00
	  1 realpath                 0.00     0.00
	  1 sed                      0.00     0.00
	  1 sort                     0.00     0.00
	  1 stty                     0.00     0.00
	  1 systemctl                0.00     0.00
	  1 template.sh              0.00     0.00
	  1 wc                       0.00     0.00
	  1 xrandr                   0.00     0.00
0 processes running
47 maximum processes
Computation blocks confirm this is run with MPI
      402268) hpcg             cpu=4 start=6.71  finish=292.31
        402269) rm               cpu=6 start=6.71  finish=6.72
        402270) mpirun           cpu=9 start=6.72  finish=292.28
          402274) mpirun           cpu=5 start=7.30  finish=292.28
          402275) mpirun           cpu=14 start=7.30  finish=7.30
          402276) mpirun           cpu=15 start=7.32  finish=292.27
          402278) mpirun           cpu=10 start=7.80  finish=292.27
          402279) mpirun           cpu=3 start=7.80  finish=292.27
          402280) xhpcg            cpu=6 start=7.83  finish=292.06
            402282) xhpcg            cpu=6 start=7.84  finish=292.00
            402285) xhpcg            cpu=11 start=7.85  finish=291.99
          402281) xhpcg            cpu=12 start=7.84  finish=292.05
            402284) xhpcg            cpu=6 start=7.85  finish=291.99
            402288) xhpcg            cpu=7 start=7.85  finish=291.99
          402283) xhpcg            cpu=2 start=7.84  finish=292.06
            402287) xhpcg            cpu=4 start=7.85  finish=291.99
            402290) xhpcg            cpu=14 start=7.86  finish=291.99
          402286) xhpcg            cpu=15 start=7.85  finish=292.04
            402291) xhpcg            cpu=4 start=7.86  finish=291.99
            402294) xhpcg            cpu=13 start=7.86  finish=291.99
          402289) xhpcg            cpu=1 start=7.85  finish=292.04
            402293) xhpcg            cpu=6 start=7.86  finish=291.99
            402298) xhpcg            cpu=8 start=7.87  finish=291.99
          402292) xhpcg            cpu=3 start=7.86  finish=292.05
            402296) xhpcg            cpu=6 start=7.87  finish=291.99
            402300) xhpcg            cpu=4 start=7.87  finish=291.99
          402295) xhpcg            cpu=5 start=7.86  finish=292.05
            402299) xhpcg            cpu=11 start=7.87  finish=291.99
            402302) xhpcg            cpu=9 start=7.88  finish=291.99
          402297) xhpcg            cpu=8 start=7.87  finish=292.05
            402301) xhpcg            cpu=11 start=7.87  finish=291.99
            402303) xhpcg            cpu=2 start=7.88  finish=291.99
        402308) cat              cpu=7 start=292.30 finish=292.31