
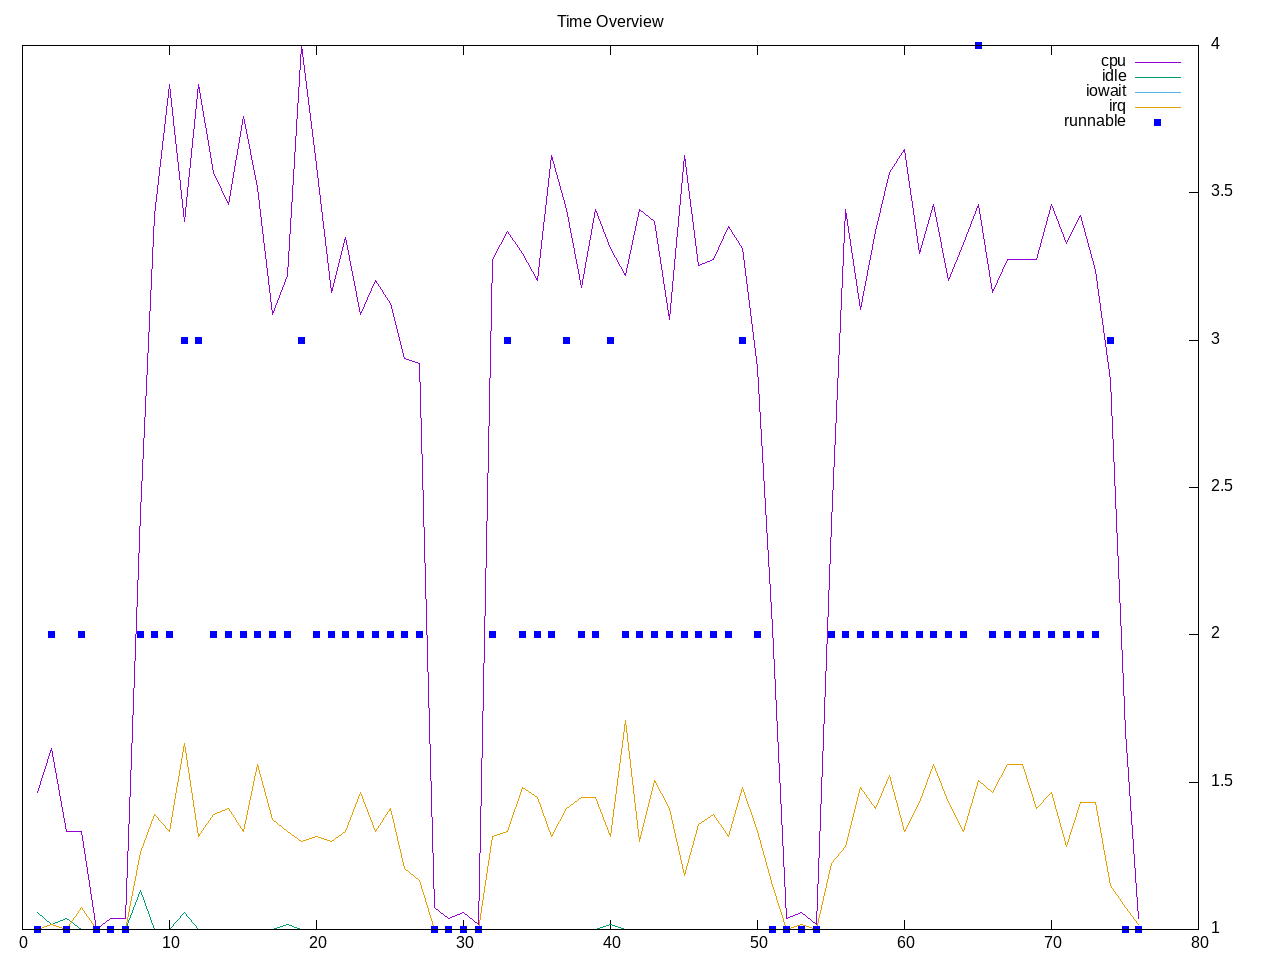
This test measures how quickly operations are performed in an open source graphics editor. There is one quick running test to change SVG files to PNG. Looks like the test is single-threaded.
Topdown profile shows few backend stalls, some frontend stalls and a moderate retirement rate.
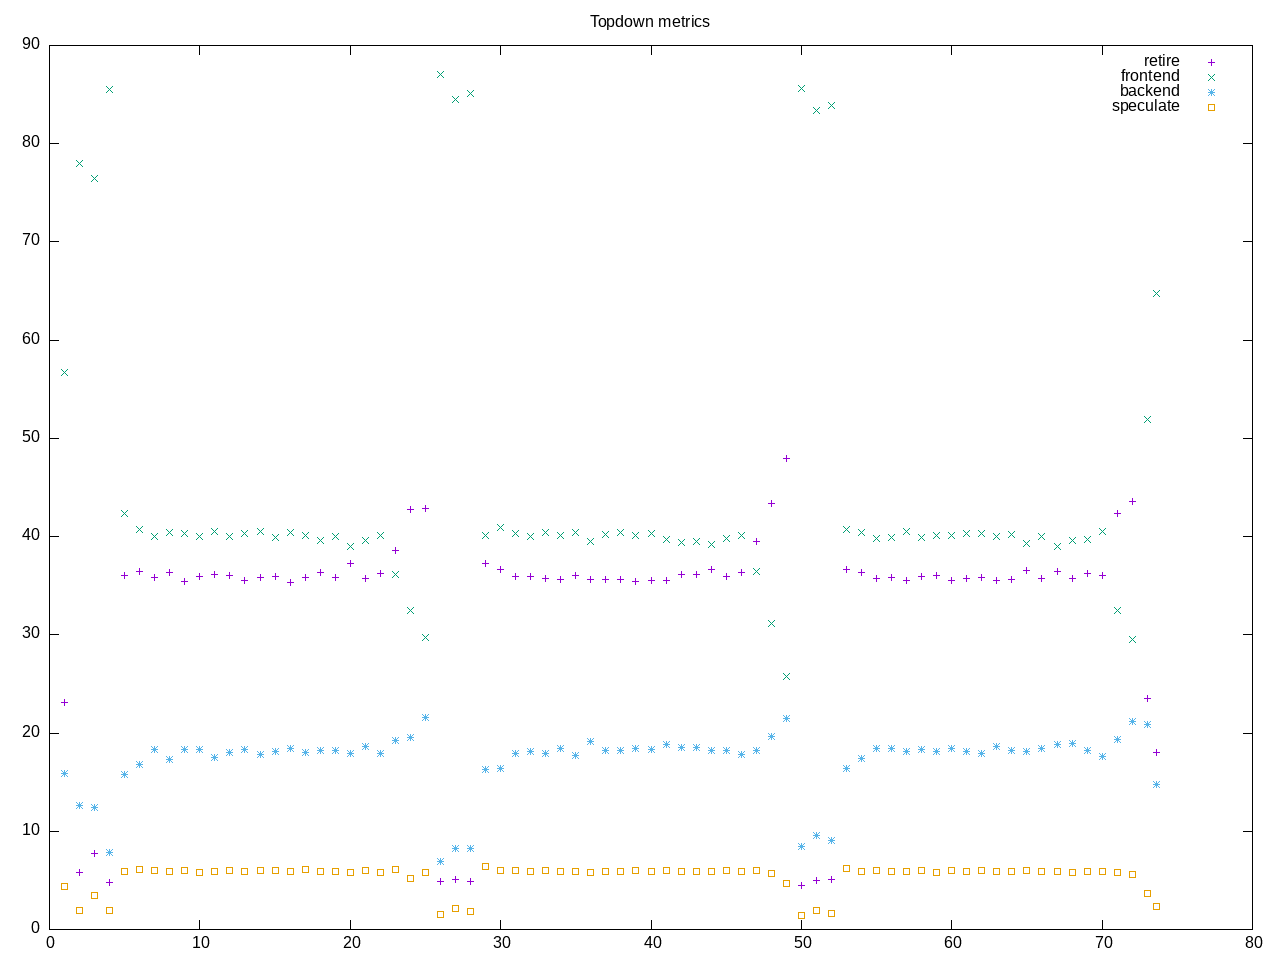
AMD metrics show low levels of floating point and not many L2 accesses. Overall 1/5 of the instructions are branches.
elapsed              75.140
on_cpu               0.056          # 0.90 / 16 cores
utime                48.363
stime                19.046
nvcsw                281463         # 99.32%
nivcsw               1939           # 0.68%
inblock              0              # 0.00/sec
onblock              39168          # 521.27/sec
cpu-clock            71217239933    # 71.217 seconds
task-clock           71415670354    # 71.416 seconds
page faults          4313925        # 60405.860/sec
context switches     283261         # 3966.370/sec
cpu migrations       8622           # 120.730/sec
major page faults    1              # 0.014/sec
minor page faults    4313924        # 60405.846/sec
alignment faults     0              # 0.000/sec
emulation faults     0              # 0.000/sec
branches             128994424037   # 203.213 branches per 1000 inst
branch misses        2855000706     # 2.21% branch miss
conditional          92040780567    # 144.998 conditional branches per 1000 inst
indirect             6111938814     # 9.629 indirect branches per 1000 inst
cpu-cycles           243500760439   # 0.21 GHz
instructions         577507690987   # 2.37 IPC
slots                582705619578   #
retiring             210908914196   # 36.2% (36.6%)
-- ucode             970288830      #     0.2%
-- fastpath          209938625366   #    36.0%
frontend             227617083412   # 39.1% (39.5%)
-- latency           162381527298   #    27.9%
-- bandwidth         65235556114    #    11.2%
backend              103959933786   # 17.8% (18.0%)
-- cpu               18214442621    #     3.1%
-- memory            85745491165    #    14.7%
speculation          34117647898    #  5.9% ( 5.9%)
-- branch mispredict 33487539142    #     5.7%
-- pipeline restart  630108756      #     0.1%
smt-contention       6092831936     #  1.0% ( 0.0%)
cpu-cycles           244600110638   # 0.21 GHz
instructions         577150652996   # 2.36 IPC
instructions         209285482206   # 23.848 l2 access per 1000 inst
l2 hit from l1       4354427372     # 14.40% l2 miss
l2 miss from l1      450869656      #
l2 hit from l2 pf    368553461      #
l3 hit from l2 pf    176427380      #
l3 miss from l2 pf   91531088       #
instructions         211792926285   # 19.526 float per 1000 inst
float 512            188            # 0.000 AVX-512 per 1000 inst
float 256            107370         # 0.001 AVX-256 per 1000 inst
float 128            4135310979     # 19.525 AVX-128 per 1000 inst
float MMX            0              # 0.000 MMX per 1000 inst
float scalar         0              # 0.000 scalar per 1000 inst
instructions         2368326        #
opcache              888726         # 375.255 opcache per 1000 inst
opcache miss         472984         # 53.2% opcache miss rate
l1 dTLB miss         5408           # 2.283 L1 dTLB per 1000 inst
l2 dTLB miss         942            # 0.398 L2 dTLB per 1000 inst
instructions         2476839        #
icache               1204427        # 486.276 icache per 1000 inst
icache miss          115782         #  9.6% icache miss rate
l1 iTLB miss         10             # 0.004 L1 iTLB per 1000 inst
l2 iTLB miss         0              # 0.000 L2 iTLB per 1000 inst
tlb flush            19             # 0.008 TLB flush per 1000 inst
Intel metrics
elapsed              84.499
on_cpu               0.055          # 0.88 / 16 cores
utime                60.622
stime                13.690
nvcsw                281470         # 98.67%
nivcsw               3784           # 1.33%
inblock              29536          # 349.54/sec
onblock              39328          # 465.43/sec
cpu-clock            76677954607    # 76.678 seconds
task-clock           76886548233    # 76.887 seconds
page faults          4401586        # 57247.803/sec
context switches     285008         # 3706.864/sec
cpu migrations       12805          # 166.544/sec
major page faults    194            # 2.523/sec
minor page faults    4401392        # 57245.280/sec
alignment faults     0              # 0.000/sec
emulation faults     0              # 0.000/sec
branches             128104451230   # 198.995 branches per 1000 inst
branch misses        1405306166     # 1.10% branch miss
conditional          128104846878   # 198.996 conditional branches per 1000 inst
indirect             7224675400     # 11.223 indirect branches per 1000 inst
slots                1501564029356  #
retiring             607696013527   # 40.5% (40.5%)
-- ucode             59391596028    #     4.0%
-- fastpath          548304417499   #    36.5%
frontend             430736572640   # 28.7% (28.7%)
-- latency           194393784953   #    12.9%
-- bandwidth         236342787687   #    15.7%
backend              276977102664   # 18.4% (18.4%)
-- cpu               158763414912   #    10.6%
-- memory            118213687752   #     7.9%
speculation          190458002482   # 12.7% (12.7%) high
-- branch mispredict 182003070361   #    12.1%
-- pipeline restart  8454932121     #     0.6%
smt-contention       0              #  0.0% ( 0.0%)
cpu-cycles           269915203919   # 0.20 GHz
instructions         653169437609   # 2.42 IPC
l2 access            13318731594    # 21.137 l2 access per 1000 inst
l2 miss              2937801854     # 22.06% l2 miss
cpu-cycles           260272717836   # 18.7% memory latency
load stalls          46416975810    #  3.1% l1 bound
l1 miss              38470872573    #  8.1% l2 bound
l2 miss              17367761103    #  3.6% l3 bound
l3 miss              8049136887     #  3.1% dram bound
store_stalls         2203256808     #  0.8% store bound
Process profile shows many inkscape processes in a short time period
56263 processes
	47473 inkscape              6094.47  1935.78
	1711 gmain                  233.68    70.88
	1708 pool-inkscape          233.66    70.89
	1708 gdbus                  233.55    70.87
	 38 vulkaninfo               1.52     0.96
	  4 vulkani:disk$0           0.16     0.11
	  6 glxinfo:gdrv0            0.13     0.09
	  6 glxinfo:gl0              0.13     0.09
	  2 llvmpipe-0               0.08     0.06
	  2 llvmpipe-1               0.08     0.06
	  2 llvmpipe-10              0.08     0.06
	  2 llvmpipe-11              0.08     0.06
	  2 llvmpipe-12              0.08     0.06
	  2 llvmpipe-13              0.08     0.06
	  2 llvmpipe-14              0.08     0.06
	  2 llvmpipe-15              0.08     0.06
	  2 llvmpipe-2               0.08     0.06
	  2 llvmpipe-3               0.08     0.06
	  2 llvmpipe-4               0.08     0.06
	  2 llvmpipe-5               0.08     0.06
	  2 llvmpipe-6               0.08     0.06
	  2 llvmpipe-7               0.08     0.06
	  2 llvmpipe-8               0.08     0.06
	  2 llvmpipe-9               0.08     0.06
	  2 glxinfo                  0.07     0.03
	  2 glxinfo:cs0              0.07     0.03
	  2 glxinfo:disk$0           0.07     0.03
	  2 glxinfo:sh0              0.07     0.03
	  2 glxinfo:shlo0            0.07     0.03
	  6 php                      0.06     0.16
	1711 dconf worker             0.00   233.62
	1694 [pango] FcInit           0.00   180.56
	  1 lspci                    0.00     0.02
	  1 ps                       0.00     0.01
	 67 sh                       0.00     0.00
	 15 grep                     0.00     0.00
	 12 gcc                      0.00     0.00
	 10 gsettings                0.00     0.00
	  8 stat                     0.00     0.00
	  8 systemd-detect-          0.00     0.00
	  5 phoronix-test-s          0.00     0.00
	  2 clinfo                   0.00     0.00
	  2 lscpu                    0.00     0.00
	  2 uname                    0.00     0.00
	  2 which                    0.00     0.00
	  2 xset                     0.00     0.00
	  1 cc                       0.00     0.00
	  1 date                     0.00     0.00
	  1 dirname                  0.00     0.00
	  1 dmesg                    0.00     0.00
	  1 dmidecode                0.00     0.00
	  1 ifconfig                 0.00     0.00
	  1 ip                       0.00     0.00
	  1 lsmod                    0.00     0.00
	  1 mktemp                   0.00     0.00
	  1 readlink                 0.00     0.00
	  1 realpath                 0.00     0.00
	  1 sed                      0.00     0.00
	  1 sort                     0.00     0.00
	  1 stty                     0.00     0.00
	  1 systemctl                0.00     0.00
	  1 template.sh              0.00     0.00
	  1 wc                       0.00     0.00
	  1 xrandr                   0.00     0.00
1 processes running
48 maximum processes