
Testing an interprocess communication primitives. There are 24 different subtests including
- TCP socket with different sized messages
- Pipes with different sized messages
- FIFO pipes with different sized messages
- UNIX domain sockets with different sized messages
Topdown summary shows mostly two processes running but not spending much time and also a moderate level of interrupts. For example the initial section is TCP sockets with increasing message sizes.
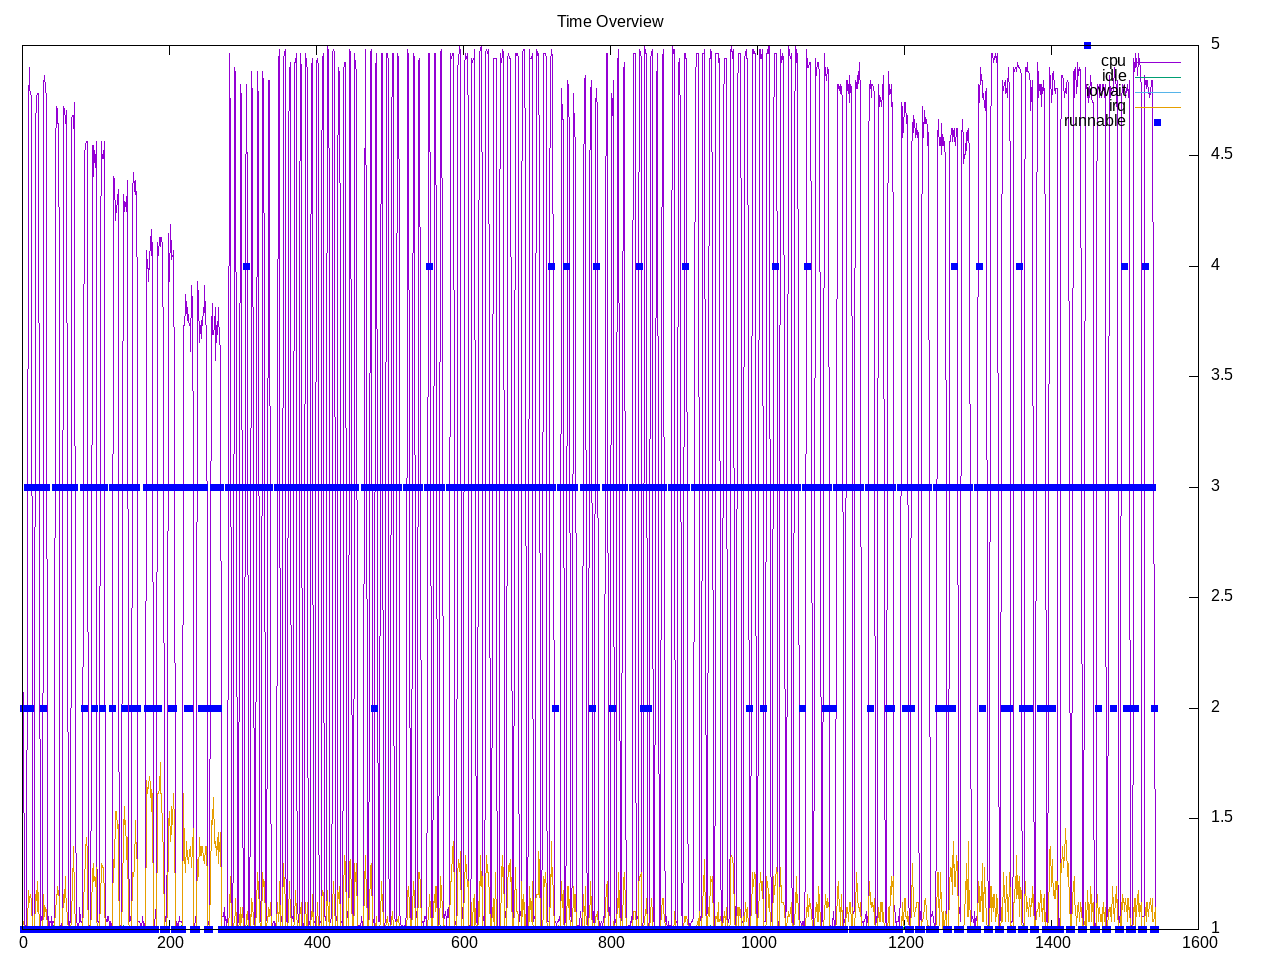
Topdown profile shows frontend time as the largest portion.
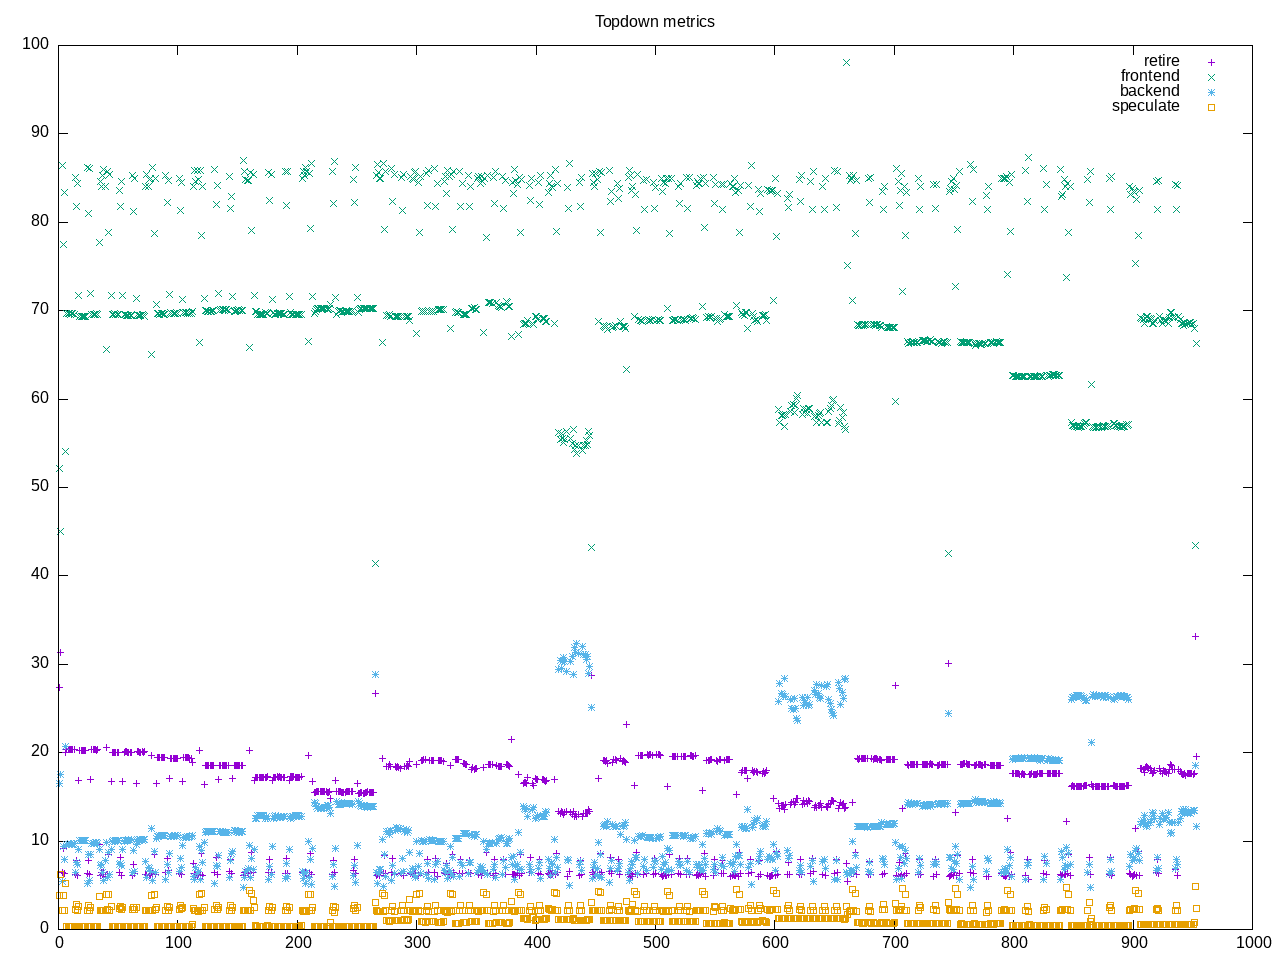
AMD metrics show little time is spent on the CPU, approximately 1/2 of one core. This is not floating point code. There is a high opcache miss rate.
elapsed              1020.621
on_cpu               0.032          # 0.51 / 16 cores
utime                44.062
stime                474.548
nvcsw                289753         # 99.13%
nivcsw               2532           # 0.87%
inblock              48             # 0.05/sec
onblock              16584          # 16.25/sec
cpu-clock            1001082661388  # 1001.083 seconds
task-clock           1002538150096  # 1002.538 seconds
page faults          196593         # 196.095/sec
context switches     7091548        # 7073.594/sec
cpu migrations       518            # 0.517/sec
major page faults    2              # 0.002/sec
minor page faults    196591         # 196.093/sec
alignment faults     0              # 0.000/sec
emulation faults     0              # 0.000/sec
branches             741624850927   # 203.483 branches per 1000 inst
branch misses        96937340773    # 13.07% branch miss
conditional          335512707016   # 92.056 conditional branches per 1000 inst
indirect             8794435030     # 2.413 indirect branches per 1000 inst
cpu-cycles           3938011140824  # 0.27 GHz
instructions         3335477922804  # 0.85 IPC
slots                7849808157270  #
retiring             1395394811656  # 17.8% (17.8%)
-- ucode             10805555686    #     0.1%
-- fastpath          1384589255970  #    17.6%
frontend             5233357070230  # 66.7% (66.7%) high
-- latency           4401810815286  #    56.1%
-- bandwidth         831546254944   #    10.6%
backend              1170512139286  # 14.9% (14.9%) low
-- cpu               308721940644   #     3.9%
-- memory            861790198642   #    11.0%
speculation          49986128184    #  0.6% ( 0.6%) low
-- branch mispredict 49821138730    #     0.6%
-- pipeline restart  164989454      #     0.0%
smt-contention       556982258      #  0.0% ( 0.0%)
cpu-cycles           5573850138090  # 0.29 GHz
instructions         4746679838611  # 0.85 IPC
instructions         1578587483573  # 45.278 l2 access per 1000 inst
l2 hit from l1       49877915552    # 26.93% l2 miss
l2 miss from l1      11601954748    #
l2 hit from l2 pf    13953015145    #
l3 hit from l2 pf    6995462328     #
l3 miss from l2 pf   649138092      #
instructions         1578938514540  # 11.084 float per 1000 inst
float 512            180            # 0.000 AVX-512 per 1000 inst
float 256            604            # 0.000 AVX-256 per 1000 inst
float 128            17500402570    # 11.084 AVX-128 per 1000 inst
float MMX            0              # 0.000 MMX per 1000 inst
float scalar         0              # 0.000 scalar per 1000 inst
instructions         3387121496957  #
opcache              1290539350027  # 381.014 opcache per 1000 inst
opcache miss         694249272052   # 53.8% opcache miss rate
l1 dTLB miss         571148055      # 0.169 L1 dTLB per 1000 inst
l2 dTLB miss         24800609       # 0.007 L2 dTLB per 1000 inst
instructions         3652008286708  #
icache               1811405175336  # 496.002 icache per 1000 inst
icache miss          33218736875    #  1.8% icache miss rate
l1 iTLB miss         8661876        # 0.002 L1 iTLB per 1000 inst
l2 iTLB miss         0              # 0.000 L2 iTLB per 1000 inst
tlb flush            27911          # 0.000 TLB flush per 1000 inst
Intel metrics show L3 as taking the largest amount of memory and surprisingly a lot more backend bound than AMD.
elapsed              1411.002
on_cpu               0.030          # 0.48 / 16 cores
utime                46.769
stime                630.786
nvcsw                521847         # 99.48%
nivcsw               2734           # 0.52%
inblock              536            # 0.38/sec
onblock              6192           # 4.39/sec
cpu-clock            1351750378635  # 1351.750 seconds
task-clock           1351993088667  # 1351.993 seconds
page faults          211379         # 156.346/sec
context switches     2150650        # 1590.726/sec
cpu migrations       1780           # 1.317/sec
major page faults    5              # 0.004/sec
minor page faults    211374         # 156.343/sec
alignment faults     0              # 0.000/sec
emulation faults     0              # 0.000/sec
branches             854112014822   # 164.960 branches per 1000 inst
branch misses        2537777092     # 0.30% branch miss
conditional          854112041478   # 164.960 conditional branches per 1000 inst
indirect             13809268745    # 2.667 indirect branches per 1000 inst
slots                31318484719550 #
retiring             7356339156164  # 23.5% (23.5%)
-- ucode             1450912164180  #     4.6%
-- fastpath          5905426991984  #    18.9%
frontend             5359358888516  # 17.1% (17.1%)
-- latency           2698193464442  #     8.6%
-- bandwidth         2661165424074  #     8.5%
backend              18030808250048 # 57.6% (57.6%)
-- cpu               6672071938072  #    21.3%
-- memory            11358736311976 #    36.3%
speculation          587508667689   #  1.9% ( 1.9%)
-- branch mispredict 445657118471   #     1.4%
-- pipeline restart  141851549218   #     0.5%
smt-contention       0              #  0.0% ( 0.0%)
cpu-cycles           6457245889546  # 0.23 GHz
instructions         7275449365505  # 1.13 IPC
l2 access            143093585864   # 19.677 l2 access per 1000 inst
l2 miss              85516676526    # 59.76% l2 miss
cpu-cycles           6129827611475  # 40.2% memory latency
load stalls          2378116952695  #  7.6% l1 bound
l1 miss              1910108431750  #  7.2% l2 bound
l2 miss              1468707911024  # 23.9% l3 bound
l3 miss              1043305120     #  0.0% dram bound
store_stalls         84585107510    #  1.4% store bound
Process summary shows different programs for processes
688 processes
	 64 pipe                    27.56   274.22
	 60 fifo                    26.79   263.40
	 36 tcp                     20.19   245.40
	 36 socketpair              19.53   326.57
	 68 clinfo                  17.53     5.31
	 38 vulkaninfo               0.96     1.53
	  6 php                      0.18     0.56
	  4 vulkani:disk$0           0.10     0.17
	  6 clang                    0.07     0.05
	  6 glxinfo:gdrv0            0.05     0.13
	  6 glxinfo:gl0              0.05     0.13
	  2 llvmpipe-0               0.05     0.09
	  2 llvmpipe-1               0.05     0.09
	  2 llvmpipe-10              0.05     0.09
	  2 llvmpipe-11              0.05     0.09
	  2 llvmpipe-12              0.05     0.09
	  2 llvmpipe-13              0.05     0.09
	  2 llvmpipe-14              0.05     0.09
	  2 llvmpipe-2               0.05     0.09
	  2 llvmpipe-3               0.05     0.09
	  2 llvmpipe-4               0.05     0.09
	  2 llvmpipe-5               0.05     0.09
	  2 llvmpipe-6               0.05     0.09
	  2 llvmpipe-7               0.05     0.09
	  2 llvmpipe-9               0.05     0.09
	  2 llvmpipe-15              0.05     0.08
	  2 llvmpipe-8               0.05     0.08
	  2 glxinfo                  0.03     0.05
	  2 glxinfo:cs0              0.03     0.05
	  2 glxinfo:disk$0           0.03     0.05
	  2 glxinfo:sh0              0.03     0.05
	  2 glxinfo:shlo0            0.03     0.05
	  3 rocminfo                 0.03     0.00
	  1 lspci                    0.00     0.02
	128 sh                       0.00     0.00
	 98 ipc-benchmark            0.00     0.00
	 13 gcc                      0.00     0.00
	 10 gsettings                0.00     0.00
	  8 stat                     0.00     0.00
	  8 systemd-detect-          0.00     0.00
	  6 llvm-link                0.00     0.00
	  5 phoronix-test-s          0.00     0.00
	  3 dconf worker             0.00     0.00
	  3 gmain                    0.00     0.00
	  2 cc                       0.00     0.00
	  2 lscpu                    0.00     0.00
	  2 uname                    0.00     0.00
	  2 which                    0.00     0.00
	  2 xset                     0.00     0.00
	  1 date                     0.00     0.00
	  1 dirname                  0.00     0.00
	  1 dmesg                    0.00     0.00
	  1 dmidecode                0.00     0.00
	  1 grep                     0.00     0.00
	  1 ifconfig                 0.00     0.00
	  1 ip                       0.00     0.00
	  1 lsmod                    0.00     0.00
	  1 mktemp                   0.00     0.00
	  1 ps                       0.00     0.00
	  1 qdbus                    0.00     0.00
	  1 readlink                 0.00     0.00
	  1 realpath                 0.00     0.00
	  1 sed                      0.00     0.00
	  1 sort                     0.00     0.00
	  1 stty                     0.00     0.00
	  1 systemctl                0.00     0.00
	  1 template.sh              0.00     0.00
	  1 wc                       0.00     0.00
	  1 xrandr                   0.00     0.00
0 processes running
47 maximum processes
An example computation block
      829619) ipc-benchmark    cpu=4 start=26.57 finish=32.98
        829620) tcp              cpu=5 start=26.57 finish=32.98
          829621) tcp              cpu=14 start=26.57 finish=32.98