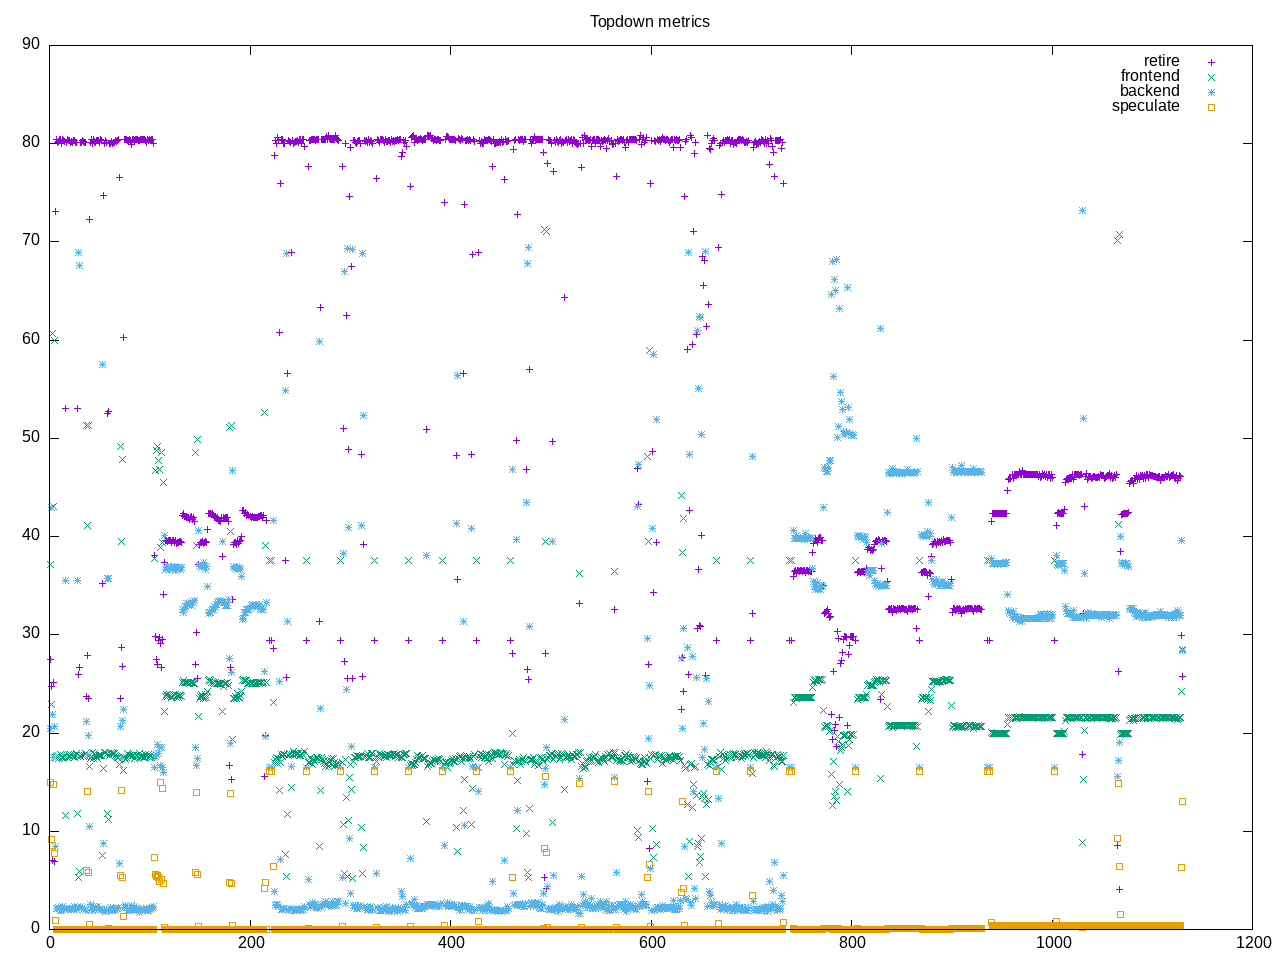
Performance characterization of the john-the-ripper password crackers. There are five workloads with slightly different profiles combined togther. The first (bcrypt) and third (blowfish) workloads have a very hire retire rate while the fourth (HMAC-SHA512) has a lower one and the second (WPA PSK) and fifth (MD5) are in between. So we have an aggregate of all these together. It also looks like playing with compiler options can make a larger difference (https://www.phoronix.com/review/intel-meteorlake-gcc-clang). Those tests seem to have picked just the right compiler options…
Here is the AMD composite profile.
elapsed 719.563
on_cpu 0.876 # 14.02 / 16 cores
utime 10088.098
stime 2.788
nvcsw 5633 # 6.88%
nivcsw 76278 # 93.12%
inblock 17008 # 23.64/sec
onblock 6064 # 8.43/sec
cpu-clock 10091008298375 # 10091.008 seconds
task-clock 10091046378603 # 10091.046 seconds
page faults 707665 # 70.128/sec
context switches 85296 # 8.453/sec
cpu migrations 230 # 0.023/sec
major page faults 89 # 0.009/sec
minor page faults 707576 # 70.119/sec
alignment faults 0 # 0.000/sec
emulation faults 0 # 0.000/sec
branches 1181761586204 # 18.861 branches per 1000 inst
branch misses 1953540532 # 0.17% branch miss
conditional 875223584314 # 13.969 conditional branches per 1000 inst
indirect 31768861224 # 0.507 indirect branches per 1000 inst
cpu-cycles 42249053159235 # 3.67 GHz
instructions 62449360688413 # 1.48 IPC
slots 84520599603168 #
retiring 22972486141479 # 27.2% (42.9%)
-- ucode 19908311589 # 0.0%
-- fastpath 22952577829890 # 27.2%
frontend 649425361657 # 0.8% ( 1.2%)
-- latency 131863651656 # 0.2%
-- bandwidth 517561710001 # 0.6%
backend 29849704427132 # 35.3% (55.8%)
-- cpu 22970067699975 # 27.2%
-- memory 6879636727157 # 8.1%
speculation 44758977493 # 0.1% ( 0.1%)
-- branch mispredict 27856028572 # 0.0%
-- pipeline restart 16902948921 # 0.0%
smt-contention 31004181580785 # 36.7% ( 0.0%)
cpu-cycles 42471271376087 # 3.69 GHz
instructions 62688427445805 # 1.48 IPC
instructions 20906863465846 # 5.588 l2 access per 1000 inst
l2 hit from l1 98937781951 # 7.01% l2 miss
l2 miss from l1 3949232822 #
l2 hit from l2 pf 13648867835 #
l3 hit from l2 pf 4231154370 #
l3 miss from l2 pf 11181084 #
instructions 20900865024390 # 7.953 float per 1000 inst
float 512 99 # 0.000 AVX-512 per 1000 inst
float 256 1244 # 0.000 AVX-256 per 1000 inst
float 128 166214135569 # 7.953 AVX-128 per 1000 inst
float MMX 0 # 0.000 MMX per 1000 inst
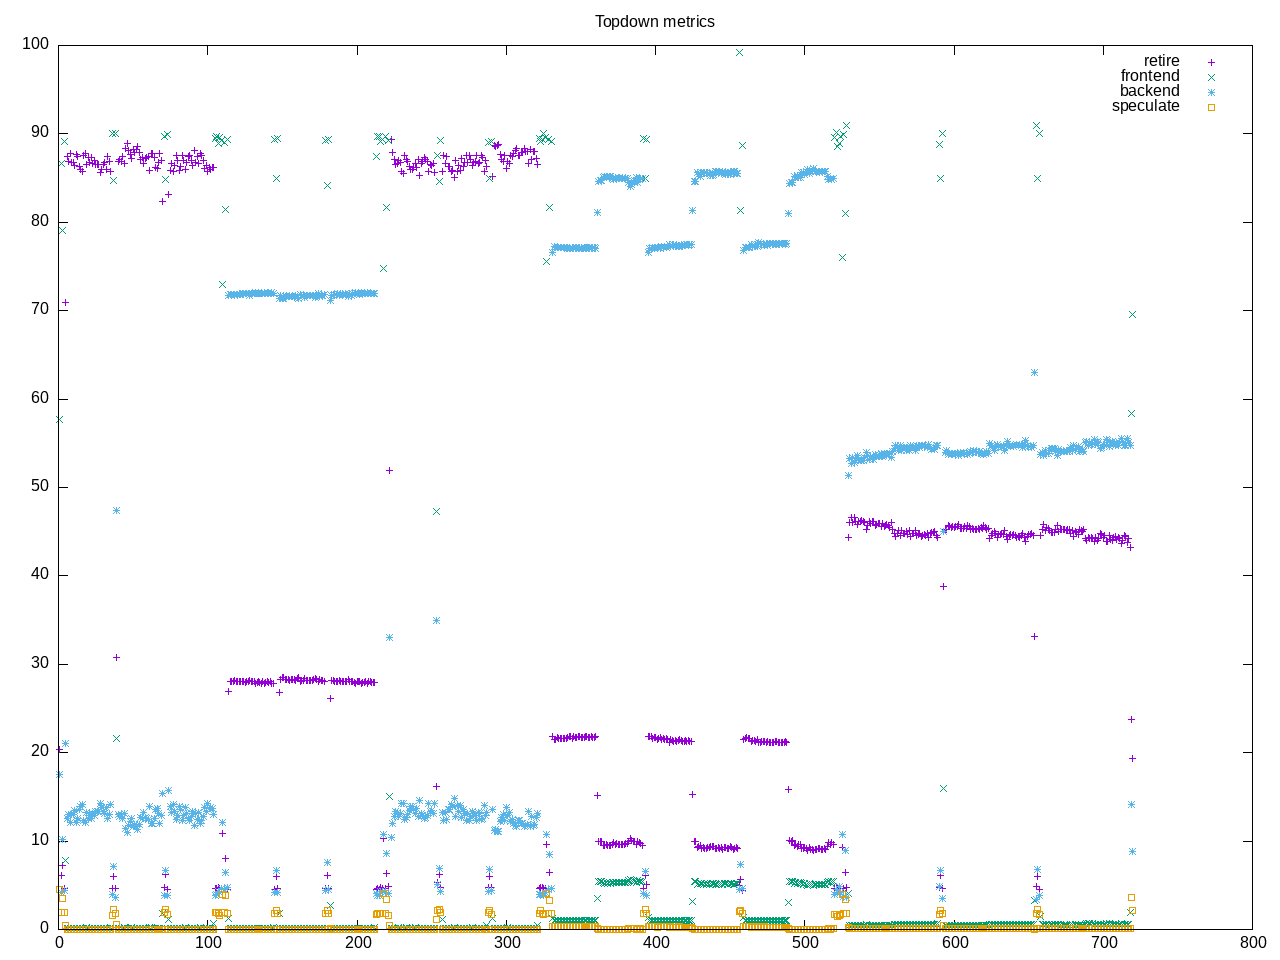
float scalar 0 # 0.000 scalar per 1000 instHere is the Intel composite profile. One thing that stands out is a high amount of branch misprediction. What also stands out is somehow only was run on two cores? So overall a somewhat squirrely test that could use a deeper dive. It also looks like the sources detect presence of particular ISAs particularly those cryptographic ones. You can also see from the phoronix run that particular cryptographic libraries are linked in as compiler options.
elapsed              323.082
on_cpu               0.131          # 2.10 / 16 cores
utime                531.315
stime                146.991
nvcsw                10503543       # 99.85%
nivcsw               15479          # 0.15%
inblock              8              # 0.02/sec
onblock              2931888        # 9074.76/sec
cpu-clock            670147573846   # 670.148 seconds
task-clock           671777403316   # 671.777 seconds
page faults          50351069       # 74952.013/sec
context switches     10519619       # 15659.382/sec
cpu migrations       30361          # 45.195/sec
major page faults    1              # 0.001/sec
minor page faults    50351068       # 74952.012/sec
alignment faults     0              # 0.000/sec
emulation faults     0              # 0.000/sec
branches             342678860344   # 135.988 branches per 1000 inst
branch misses        3385141914     # 0.99% branch miss
conditional          342679096184   # 135.988 conditional branches per 1000 inst
indirect             49044340836    # 19.463 indirect branches per 1000 inst
slots                6042017136368  #
retiring             2057791788255  # 34.1% (34.1%)
-- ucode             206973543335   #     3.4%
-- fastpath          1850818244920  #    30.6%
frontend             869596524785   # 14.4% (14.4%)
-- latency           441086010050   #     7.3%
-- bandwidth         428510514735   #     7.1%
backend              2531687347647  # 41.9% (41.9%)
-- cpu               625305575545   #    10.3%
-- memory            1906381772102  #    31.6%
speculation          609068467938   # 10.1% (10.1%)
-- branch mispredict 488700891743   #     8.1%
-- pipeline restart  120367576195   #     2.0%
smt-contention       0              #  0.0% ( 0.0%)
cpu-cycles           3264854609930  # 0.61 GHz
instructions         4152760303612  # 1.27 IPC
l2 access            47561932109    # 20.313 l2 access per 1000 inst
l2 miss              20055987975    # 42.17% l2 miss
Drilling into the speculation amounts, I see occasional bursts of much higher misses. Also apparent in this graph is more time spent in particular benchmarks. I believe in some cases extra runs to make things converge but then this also adds to the totals where there are different workloads…So this one as a whole would benefit by breaking into separate cases rather than running them together.