
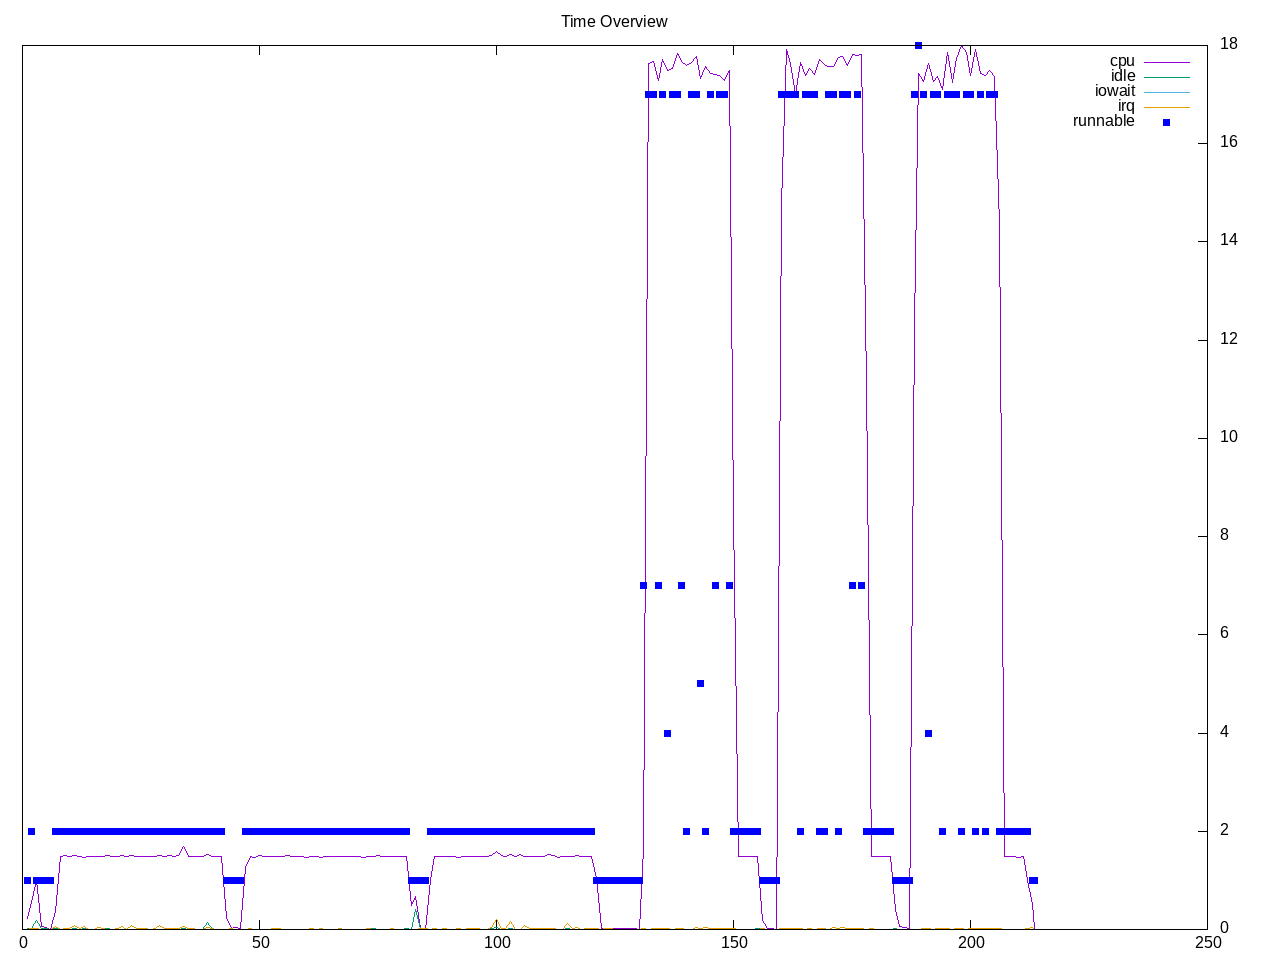
a JPEG image processing library. Exercised with two quick running workloads. The first runs on one thread, the second on “all” threads.
Topdown profile shows the single-threaded workload as having a higher retirement rate and some backend stalls. The parallel one is flipped.

AMD metrics show not much floating point, some L2 access including misses.
elapsed              214.087
on_cpu               0.230          # 3.69 / 16 cores
utime                572.235
stime                217.040
nvcsw                46264          # 80.71%
nivcsw               11056          # 19.29%
inblock              88             # 0.41/sec
onblock              293008         # 1368.64/sec
cpu-clock            789175841055   # 789.176 seconds
task-clock           789261200257   # 789.261 seconds
page faults          78020185       # 98852.173/sec
context switches     58208          # 73.750/sec
cpu migrations       7653           # 9.696/sec
major page faults    4              # 0.005/sec
minor page faults    78020181       # 98852.168/sec
alignment faults     0              # 0.000/sec
emulation faults     0              # 0.000/sec
branches             322457994967   # 72.656 branches per 1000 inst
branch misses        15346807047    # 4.76% branch miss
conditional          231733673746   # 52.214 conditional branches per 1000 inst
indirect             6110886568     # 1.377 indirect branches per 1000 inst
cpu-cycles           3143196687512  # 0.92 GHz
instructions         4405132309118  # 1.40 IPC
slots                6291991187694  #
retiring             1536387710543  # 24.4% (29.6%)
-- ucode             3228779195     #     0.1%
-- fastpath          1533158931348  #    24.4%
frontend             929644428644   # 14.8% (17.9%)
-- latency           707692046958   #    11.2%
-- bandwidth         221952381686   #     3.5%
backend              2565494368112  # 40.8% (49.5%)
-- cpu               956203684287   #    15.2%
-- memory            1609290683825  #    25.6%
speculation          150701191697   #  2.4% ( 2.9%)
-- branch mispredict 145671010991   #     2.3%
-- pipeline restart  5030180706     #     0.1%
smt-contention       1109755007091  # 17.6% ( 0.0%)
cpu-cycles           3147769160356  # 0.91 GHz
instructions         4396937620175  # 1.40 IPC
instructions         1480153486902  # 45.732 l2 access per 1000 inst
l2 hit from l1       54965304511    # 11.34% l2 miss
l2 miss from l1      3863029248     #
l2 hit from l2 pf    8912497384     #
l3 hit from l2 pf    2337614534     #
l3 miss from l2 pf   1474996298     #
instructions         1468633262644  # 47.498 float per 1000 inst
float 512            57             # 0.000 AVX-512 per 1000 inst
float 256            602            # 0.000 AVX-256 per 1000 inst
float 128            69757460749    # 47.498 AVX-128 per 1000 inst
float MMX            0              # 0.000 MMX per 1000 inst
float scalar         0              # 0.000 scalar per 1000 inst
instructions         4410783289171  #
opcache              639131229094   # 144.902 opcache per 1000 inst
opcache miss         75966023342    # 11.9% opcache miss rate
l1 dTLB miss         15719138380    # 3.564 L1 dTLB per 1000 inst
l2 dTLB miss         696242527      # 0.158 L2 dTLB per 1000 inst
instructions         4411366720558  #
icache               147700356249   # 33.482 icache per 1000 inst
icache miss          9449915162     #  6.4% icache miss rate
l1 iTLB miss         30947776       # 0.007 L1 iTLB per 1000 inst
l2 iTLB miss         0              # 0.000 L2 iTLB per 1000 inst
tlb flush            23457          # 0.000 TLB flush per 1000 inst
Intel metrics show backend stalls are more at L1/L2 levels than all the way out to dram
elapsed              229.959
on_cpu               0.221          # 3.54 / 16 cores
utime                655.417
stime                157.900
nvcsw                47596          # 81.51%
nivcsw               10796          # 18.49%
inblock              248224         # 1079.43/sec
onblock              281728         # 1225.12/sec
cpu-clock            812664634134   # 812.665 seconds
task-clock           812731141309   # 812.731 seconds
page faults          64066346       # 78828.462/sec
context switches     59368          # 73.048/sec
cpu migrations       11485          # 14.131/sec
major page faults    1276           # 1.570/sec
minor page faults    64065070       # 78826.892/sec
alignment faults     0              # 0.000/sec
emulation faults     0              # 0.000/sec
branches             289467025331   # 66.628 branches per 1000 inst
branch misses        4791047711     # 1.66% branch miss
conditional          289467037075   # 66.628 conditional branches per 1000 inst
indirect             46740820621    # 10.759 indirect branches per 1000 inst
slots                7250543859452  #
retiring             3182672569517  # 43.9% (43.9%)
-- ucode             284462783358   #     3.9%
-- fastpath          2898209786159  #    40.0%
frontend             798789567358   # 11.0% (11.0%)
-- latency           466544490290   #     6.4%
-- bandwidth         332245077068   #     4.6%
backend              2613200296738  # 36.0% (36.0%)
-- cpu               1445575001374  #    19.9%
-- memory            1167625295364  #    16.1%
speculation          713440337672   #  9.8% ( 9.8%)
-- branch mispredict 642636577796   #     8.9%
-- pipeline restart  70803759876    #     1.0%
smt-contention       0              #  0.0% ( 0.0%)
cpu-cycles           3015898317055  # 0.82 GHz
instructions         5329185911432  # 1.77 IPC
l2 access            103439376307   # 33.427 l2 access per 1000 inst
l2 miss              23259806947    # 22.49% l2 miss
cpu-cycles           1737674083545  # 27.5% memory latency
load stalls          410906786285   # 11.1% l1 bound
l1 miss              217693607649   #  8.2% l2 bound
l2 miss              74926260792    #  2.1% l3 bound
l3 miss              38350978722    #  2.2% dram bound
store_stalls         66085442220    #  3.8% store bound