
Lammps is molecular dynamics code. A steady profile with a very high amount of branch mis-prediction.
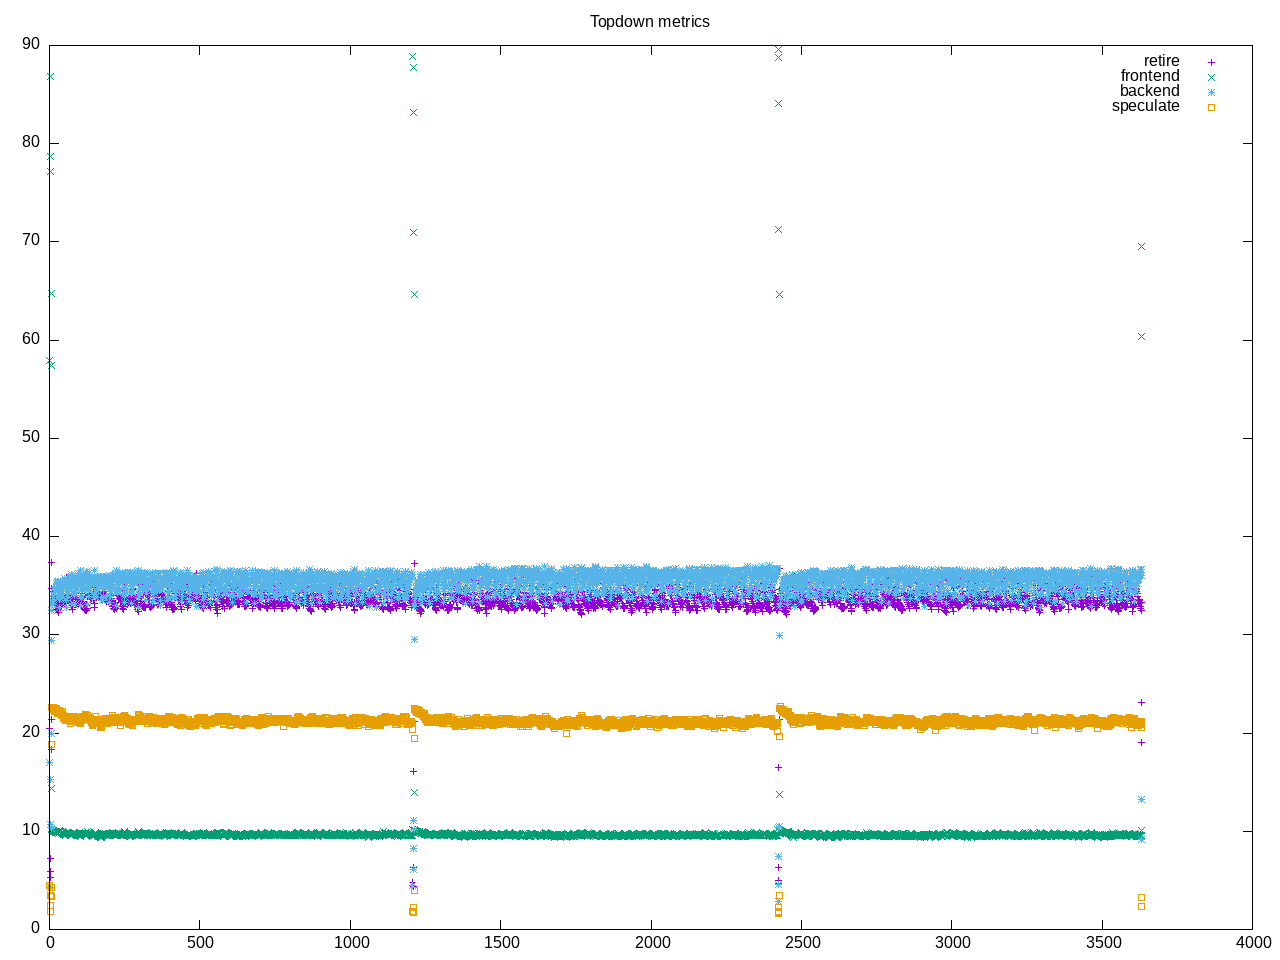
AMD metrics show a lot of floating point and a moderate number of branches with a high misprediction ratio and a relatively higher IPC
mev@augusta:~/source/wspy/workload/phoronix/lammps-perf$ more amdtopdown.txt
elapsed              3607.385
on_cpu               0.497          # 7.95 / 16 cores
utime                28422.382
stime                266.904
nvcsw                34931          # 31.82%
nivcsw               74834          # 68.18%
inblock              808            # 0.22/sec
onblock              149424         # 41.42/sec
cpu-clock            28689723667470 # 28689.724 seconds
task-clock           28689830702354 # 28689.831 seconds
page faults          320132         # 11.158/sec
context switches     127549         # 4.446/sec
cpu migrations       42780          # 1.491/sec
major page faults    318            # 0.011/sec
minor page faults    319814         # 11.147/sec
alignment faults     0              # 0.000/sec
emulation faults     0              # 0.000/sec
branches             23793575093943 # 98.234 branches per 1000 inst
branch misses        851710978452   # 3.58% branch miss
conditional          21073569115948 # 87.004 conditional branches per 1000 inst
indirect             230267785218   # 0.951 indirect branches per 1000 inst
cpu-cycles           121063342816018 # 2.09 GHz
instructions         243280310806043 # 2.01 IPC
slots                242118479094498 #
retiring             81755137984811 # 33.8% (33.8%)
-- ucode             12236037330    #     0.0%
-- fastpath          81742901947481 #    33.8%
frontend             23418316746824 #  9.7% ( 9.7%)
-- latency           12051836963268 #     5.0%
-- bandwidth         11366479783556 #     4.7%
backend              85433362902042 # 35.3% (35.3%)
-- cpu               51382962662189 #    21.2%
-- memory            34050400239853 #    14.1%
speculation          51385443415715 # 21.2% (21.2%)
-- branch mispredict 51082009983348 #    21.1%
-- pipeline restart  303433432367   #     0.1%
smt-contention       126136389092   #  0.1% ( 0.0%)
cpu-cycles           120737853365517 # 2.09 GHz
instructions         241988029059643 # 2.00 IPC
instructions         80671577903670 # 63.872 l2 access per 1000 inst
l2 hit from l1       3637543520009  # 3.39% l2 miss
l2 miss from l1      58163463293    #
l2 hit from l2 pf    1398780866072  #
l3 hit from l2 pf    61743676247    #
l3 miss from l2 pf   54570665759    #
instructions         80620315692299 # 332.278 float per 1000 inst
float 512            34             # 0.000 AVX-512 per 1000 inst
float 256            1002           # 0.000 AVX-256 per 1000 inst
float 128            26788381930153 # 332.278 AVX-128 per 1000 inst
float MMX            0              # 0.000 MMX per 1000 inst
float scalar         0              # 0.000 scalar per 1000 inst
Intel metrics show a particularly high IPC and more time overall in cores.
elapsed              5234.464
on_cpu               0.747          # 11.96 / 16 cores
utime                61938.747
stime                643.461
nvcsw                55070          # 27.73%
nivcsw               143501         # 72.27%
inblock              296264         # 56.60/sec
onblock              149624         # 28.58/sec
cpu-clock            62583082310865 # 62583.082 seconds
task-clock           62583209388366 # 62583.209 seconds
page faults          340254         # 5.437/sec
context switches     224519         # 3.588/sec
cpu migrations       45949          # 0.734/sec
major page faults    2768           # 0.044/sec
minor page faults    337486         # 5.393/sec
alignment faults     0              # 0.000/sec
emulation faults     0              # 0.000/sec
branches             48031836251892 # 124.988 branches per 1000 inst
branch misses        875770490567   # 1.82% branch miss
conditional          48031836267444 # 124.988 conditional branches per 1000 inst
indirect             10260173632800 # 26.699 indirect branches per 1000 inst
slots                359968213625054 #
retiring             207191541248343 # 57.6% (57.6%)
-- ucode             10580047628562 #     2.9%
-- fastpath          196611493619781 #    54.6%
frontend             24396382454844 #  6.8% ( 6.8%)
-- latency           9601924139766  #     2.7%
-- bandwidth         14794458315078 #     4.1%
backend              52986590450881 # 14.7% (14.7%)
-- cpu               45057192033341 #    12.5%
-- memory            7929398417540  #     2.2%
speculation          76099342557612 # 21.1% (21.1%)
-- branch mispredict 74687668037222 #    20.7%
-- pipeline restart  1411674520390  #     0.4%
smt-contention       0              #  0.0% ( 0.0%)
cpu-cycles           166960049481381 # 1.99 GHz
instructions         597991842690222 # 3.58 IPC
l2 access            4182134029230  # 19.354 l2 access per 1000 inst
l2 miss              218708314722   # 5.23% l2 miss
Most time spent in the lmp process; we do abort prematurely at end of the run
237 processes
	 24 lmp                  28521.62   274.58
	 19 vulkaninfo               0.46     0.38
	  2 vulkani:disk$0           0.05     0.04
	  6 clang                    0.05     0.01
	  1 llvmpipe-0               0.03     0.02
	  1 llvmpipe-1               0.03     0.02
	  1 llvmpipe-10              0.03     0.02
	  1 llvmpipe-11              0.03     0.02
	  1 llvmpipe-12              0.03     0.02
	  1 llvmpipe-13              0.03     0.02
	  1 llvmpipe-14              0.03     0.02
	  1 llvmpipe-15              0.03     0.02
	  1 llvmpipe-2               0.03     0.02
	  1 llvmpipe-3               0.03     0.02
	  1 llvmpipe-4               0.03     0.02
	  1 llvmpipe-5               0.03     0.02
	  1 llvmpipe-6               0.03     0.02
	  1 llvmpipe-7               0.03     0.02
	  1 llvmpipe-8               0.03     0.02
	  1 llvmpipe-9               0.03     0.02
	 68 sh                       0.00     0.00
	 13 gcc                      0.00     0.00
	  9 stty                     0.00     0.00
	  8 systemd-detect-          0.00     0.00
	  7 gsettings                0.00     0.00
	  7 stat                     0.00     0.00
	  6 llvm-link                0.00     0.00
	  5 gmain                    0.00     0.00
	  4 glxinfo                  0.00     0.00
	  4 phoronix-test-s          0.00     0.00
	  3 dconf worker             0.00     0.00
	  2 grep                     0.00     0.00
	  2 which                    0.00     0.00
	  1 cc                       0.00     0.00
	  1 clinfo                   0.00     0.00
	  1 date                     0.00     0.00
	  1 dirname                  0.00     0.00
	  1 ifconfig                 0.00     0.00
	  1 ip                       0.00     0.00
	  1 lscpu                    0.00     0.00
	  1 mktemp                   0.00     0.00
	  1 ps                       0.00     0.00
	  1 qdbus                    0.00     0.00
	  1 readlink                 0.00     0.00
	  1 realpath                 0.00     0.00
	  1 sed                      0.00     0.00
	  1 setterm                  0.00     0.00
	  1 sort                     0.00     0.00
	  1 systemctl                0.00     0.00
	  1 template.sh              0.00     0.00
	  1 wc                       0.00     0.00
14 processes running
47 maximum processes
Following is the profile until the end.
      7702) ?? start=4.82  finish=0.00
        7703) ?? start=4.82  finish=0.00
          7707) ?? start=5.53  finish=0.00
          7708) ?? start=6.18  finish=0.00
          7709) ?? start=6.18  finish=0.00
          7710) lmp start=6.21  finish=1206.38
            7712) lmp start=6.22  finish=1206.38
            7716) lmp start=6.22  finish=1206.38
          7711) lmp start=6.21  finish=1206.38
            7714) lmp start=6.22  finish=1206.38
            7719) lmp start=6.23  finish=1206.38
          7713) lmp start=6.22  finish=1206.38
            7717) lmp start=6.22  finish=1206.38
            7721) lmp start=6.23  finish=1206.38
          7715) lmp start=6.22  finish=1206.38
            7722) lmp start=6.23  finish=1206.38
            7725) lmp start=6.23  finish=1206.38
          7718) lmp start=6.22  finish=1206.38
            7724) lmp start=6.23  finish=1206.38
            7728) lmp start=6.23  finish=1206.38
          7720) lmp start=6.23  finish=1206.38
            7727) lmp start=6.23  finish=1206.38
            7730) lmp start=6.24  finish=1206.38
          7723) lmp start=6.23  finish=1206.38
            7729) lmp start=6.24  finish=1206.38
            7732) lmp start=6.24  finish=1206.38
          7726) lmp start=6.23  finish=1206.38
            7731) lmp start=6.24  finish=1206.38
            7733) lmp start=6.24  finish=1206.38