
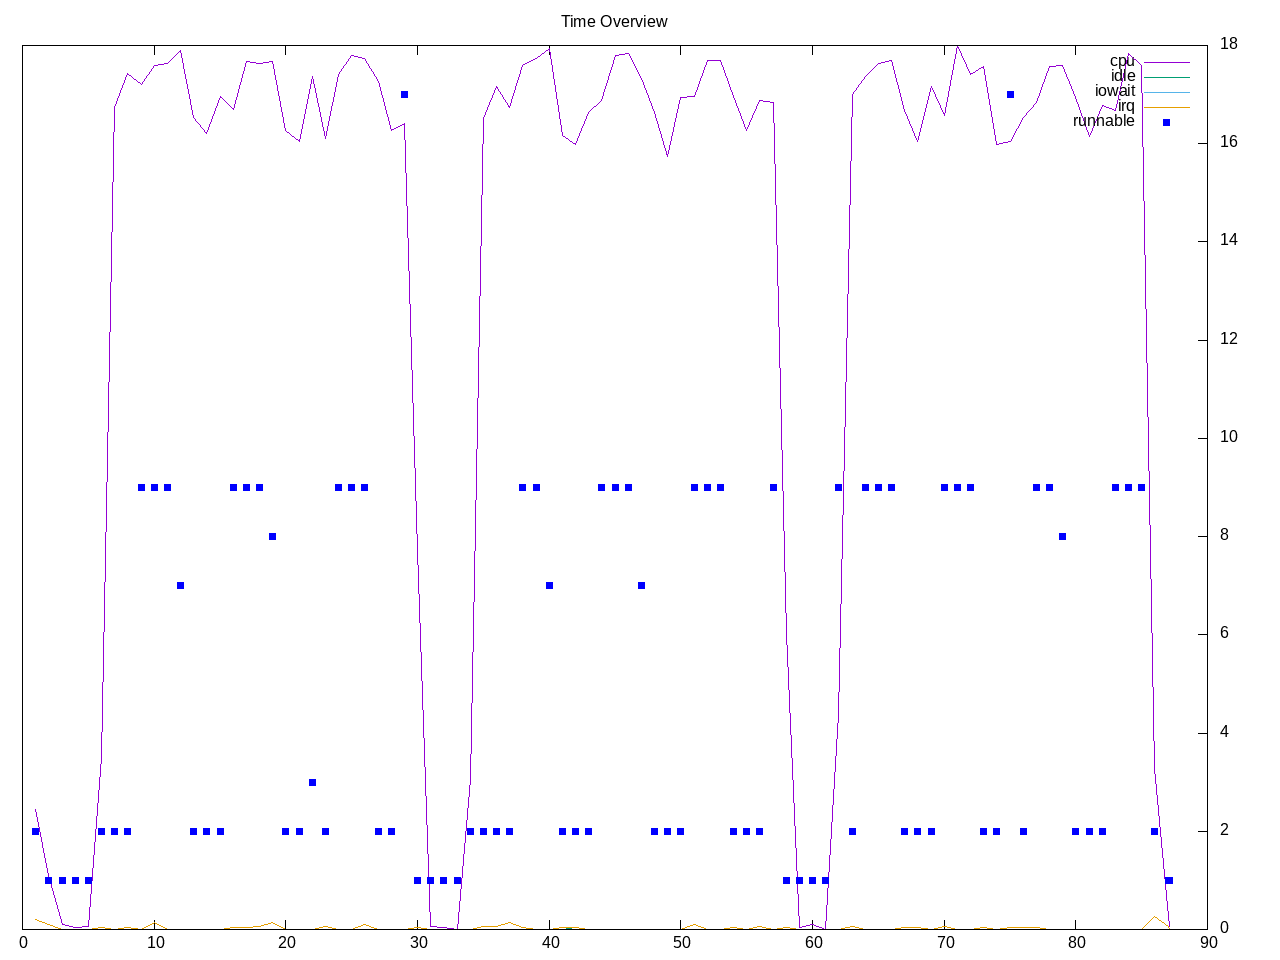
A RAW image decoder library using one test that runs quickly on about half the cores.
Topdown profile shows a higer retirement rate, some backend stalls and then frontend stalls.
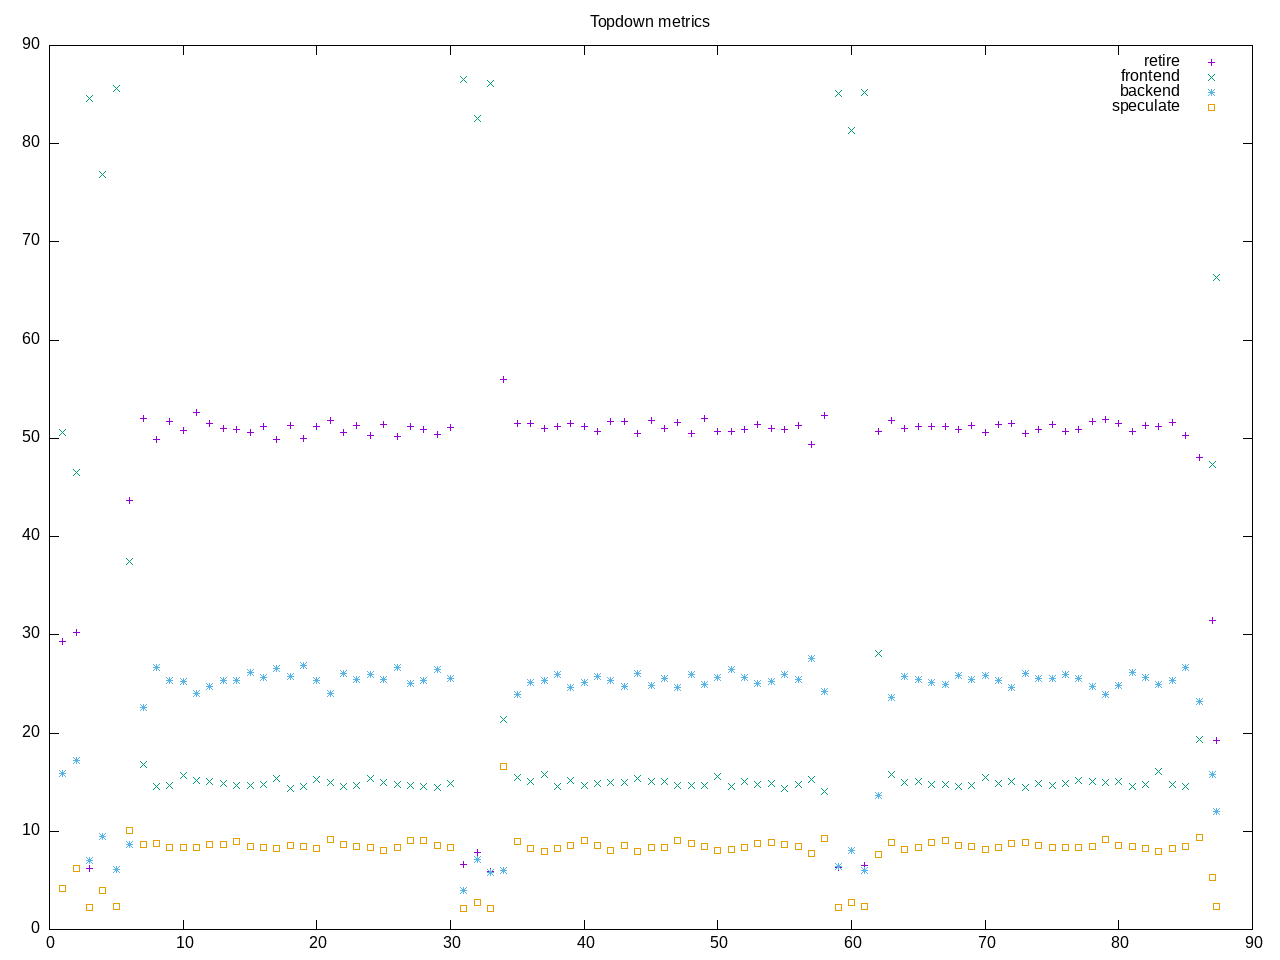
AMD metrics show some floating point code and not many L2 accesses
elapsed              92.773
on_cpu               0.245          # 3.92 / 16 cores
utime                344.601
stime                18.720
nvcsw                8707           # 74.14%
nivcsw               3037           # 25.86%
inblock              0              # 0.00/sec
onblock              12976          # 139.87/sec
cpu-clock            363253670075   # 363.254 seconds
task-clock           363275710684   # 363.276 seconds
page faults          10061284       # 27696.000/sec
context switches     11996          # 33.022/sec
cpu migrations       1849           # 5.090/sec
major page faults    4              # 0.011/sec
minor page faults    10061280       # 27695.989/sec
alignment faults     0              # 0.000/sec
emulation faults     0              # 0.000/sec
branches             371921917436   # 95.516 branches per 1000 inst
branch misses        11533532006    # 3.10% branch miss
conditional          288187005963   # 74.011 conditional branches per 1000 inst
indirect             11398445179    # 2.927 indirect branches per 1000 inst
cpu-cycles           1510864437836  # 1.08 GHz
instructions         3884284187340  # 2.57 IPC
slots                3024212308902  #
retiring             1355578218166  # 44.8% (51.1%)
-- ucode             886801671      #     0.0%
-- fastpath          1354691416495  #    44.8%
frontend             403473766023   # 13.3% (15.2%)
-- latency           276939449082   #     9.2%
-- bandwidth         126534316941   #     4.2%
backend              667421081203   # 22.1% (25.2%)
-- cpu               287734107756   #     9.5%
-- memory            379686973447   #    12.6%
speculation          225291888102   #  7.4% ( 8.5%)
-- branch mispredict 223143227858   #     7.4%
-- pipeline restart  2148660244     #     0.1%
smt-contention       372445243153   # 12.3% ( 0.0%)
cpu-cycles           1518221305031  # 1.09 GHz
instructions         3875946618563  # 2.55 IPC
instructions         1297207670686  # 11.784 l2 access per 1000 inst
l2 hit from l1       8328408905     # 18.65% l2 miss
l2 miss from l1      185058158      #
l2 hit from l2 pf    4292229866     #
l3 hit from l2 pf    342343388      #
l3 miss from l2 pf   2322779786     #
instructions         1299139440391  # 73.167 float per 1000 inst
float 512            53             # 0.000 AVX-512 per 1000 inst
float 256            454            # 0.000 AVX-256 per 1000 inst
float 128            95054465502    # 73.167 AVX-128 per 1000 inst
float MMX            0              # 0.000 MMX per 1000 inst
float scalar         0              # 0.000 scalar per 1000 inst
instructions         3890132649249  #
opcache              546431242470   # 140.466 opcache per 1000 inst
opcache miss         8678068146     #  1.6% opcache miss rate
l1 dTLB miss         483224034      # 0.124 L1 dTLB per 1000 inst
l2 dTLB miss         85475382       # 0.022 L2 dTLB per 1000 inst
instructions         3889800003726  #
icache               19586198023    # 5.035 icache per 1000 inst
icache miss          511702557      #  2.6% icache miss rate
l1 iTLB miss         8762679        # 0.002 L1 iTLB per 1000 inst
l2 iTLB miss         0              # 0.000 L2 iTLB per 1000 inst
tlb flush            20375          # 0.000 TLB flush per 1000 inst
Intel metrics confirm not much memory activity
elapsed              110.052
on_cpu               0.276          # 4.41 / 16 cores
utime                467.837
stime                17.337
nvcsw                8661           # 65.86%
nivcsw               4490           # 34.14%
inblock              624            # 5.67/sec
onblock              1688           # 15.34/sec
cpu-clock            485020107325   # 485.020 seconds
task-clock           485036129248   # 485.036 seconds
page faults          10056637       # 20733.789/sec
context switches     13484          # 27.800/sec
cpu migrations       3667           # 7.560/sec
major page faults    0              # 0.000/sec
minor page faults    10056637       # 20733.789/sec
alignment faults     0              # 0.000/sec
emulation faults     0              # 0.000/sec
branches             368733785557   # 94.829 branches per 1000 inst
branch misses        10172337462    # 2.76% branch miss
conditional          368733800853   # 94.829 conditional branches per 1000 inst
indirect             76920101111    # 19.782 indirect branches per 1000 inst
slots                4936643839022  #
retiring             2524863572358  # 51.1% (51.1%)
-- ucode             155834186802   #     3.2%
-- fastpath          2369029385556  #    48.0%
frontend             547568286220   # 11.1% (11.1%)
-- latency           258935604686   #     5.2%
-- bandwidth         288632681534   #     5.8%
backend              1136515909022  # 23.0% (23.0%)
-- cpu               990322802368   #    20.1%
-- memory            146193106654   #     3.0%
speculation          858612251070   # 17.4% (17.4%) high
-- branch mispredict 849565895371   #    17.2%
-- pipeline restart  9046355699     #     0.2%
smt-contention       0              #  0.0% ( 0.0%)
cpu-cycles           1729873292296  # 0.83 GHz
instructions         4434644648060  # 2.56 IPC
l2 access            21287223434    # 8.591 l2 access per 1000 inst
l2 miss              10391816082    # 48.82% l2 miss
cpu-cycles           967524598650   #  7.7% memory latency
load stalls          65110295869    #  1.5% l1 bound
l1 miss              50619430068    #  3.6% l2 bound
l2 miss              16022667734    #  0.4% l3 bound
l3 miss              12272259351    #  1.3% dram bound
store_stalls         8999117992     #  0.9% store bound
Process overviews gives name as postprocessing_
438 processes
	 75 postprocessing_       5494.88   281.28
	 68 clinfo                  17.84     7.98
	 38 vulkaninfo               1.52     1.32
	  4 vulkani:disk$0           0.16     0.14
	  6 glxinfo:gdrv0            0.12     0.08
	  6 glxinfo:gl0              0.12     0.08
	  2 llvmpipe-0               0.08     0.08
	  2 llvmpipe-1               0.08     0.08
	  2 llvmpipe-10              0.08     0.08
	  2 llvmpipe-11              0.08     0.08
	  2 llvmpipe-12              0.08     0.08
	  2 llvmpipe-13              0.08     0.08
	  2 llvmpipe-14              0.08     0.08
	  2 llvmpipe-15              0.08     0.08
	  2 llvmpipe-2               0.08     0.08
	  2 llvmpipe-3               0.08     0.08
	  2 llvmpipe-4               0.08     0.08
	  2 llvmpipe-5               0.08     0.08
	  2 llvmpipe-6               0.08     0.08
	  2 llvmpipe-7               0.08     0.08
	  2 llvmpipe-8               0.08     0.08
	  2 llvmpipe-9               0.08     0.08
	  6 php                      0.07     0.06
	  2 glxinfo                  0.06     0.04
	  2 glxinfo:cs0              0.06     0.04
	  2 glxinfo:disk$0           0.06     0.04
	  2 glxinfo:sh0              0.06     0.04
	  2 glxinfo:shlo0            0.06     0.04
	  6 clang                    0.04     0.08
	  3 rocminfo                 0.03     0.00
	  1 lspci                    0.01     0.02
	  1 ps                       0.00     0.01
	 82 sh                       0.00     0.00
	 13 gcc                      0.00     0.00
	 12 gsettings                0.00     0.00
	 10 sed                      0.00     0.00
	  8 stat                     0.00     0.00
	  8 systemd-detect-          0.00     0.00
	  6 llvm-link                0.00     0.00
	  5 phoronix-test-s          0.00     0.00
	  3 gmain                    0.00     0.00
	  3 libraw                   0.00     0.00
	  3 ls                       0.00     0.00
	  2 cc                       0.00     0.00
	  2 lscpu                    0.00     0.00
	  2 uname                    0.00     0.00
	  2 which                    0.00     0.00
	  2 xset                     0.00     0.00
	  1 date                     0.00     0.00
	  1 dconf worker             0.00     0.00
	  1 dirname                  0.00     0.00
	  1 dmesg                    0.00     0.00
	  1 dmidecode                0.00     0.00
	  1 grep                     0.00     0.00
	  1 ifconfig                 0.00     0.00
	  1 ip                       0.00     0.00
	  1 lsmod                    0.00     0.00
	  1 mktemp                   0.00     0.00
	  1 qdbus                    0.00     0.00
	  1 readlink                 0.00     0.00
	  1 realpath                 0.00     0.00
	  1 sort                     0.00     0.00
	  1 stty                     0.00     0.00
	  1 systemctl                0.00     0.00
	  1 template.sh              0.00     0.00
	  1 wc                       0.00     0.00
	  1 xrandr                   0.00     0.00
0 processes running
47 maximum processes
Computation blocks
      57005) libraw           cpu=5 start=5.88  finish=29.81
        57006) postprocessing_  cpu=0 start=5.88  finish=29.80
          57007) postprocessing_  cpu=3 start=5.88  finish=5.88
            57008) postprocessing_  cpu=4 start=5.88  finish=5.88
          57009) postprocessing_  cpu=15 start=5.89  finish=5.89
          57010) postprocessing_  cpu=2 start=5.89  finish=5.89
            57011) postprocessing_  cpu=14 start=5.89  finish=5.89
            57012) sed              cpu=0 start=5.89  finish=5.89
          57013) postprocessing_  cpu=14 start=5.89  finish=5.89
            57014) ls               cpu=3 start=5.89  finish=5.89
            57015) sed              cpu=4 start=5.89  finish=5.89
          57016) postprocessing_  cpu=2 start=5.89  finish=5.90
          57017) postprocessing_  cpu=15 start=5.90  finish=5.90
            57018) postprocessing_  cpu=0 start=5.90  finish=5.90
            57019) sed              cpu=10 start=5.90  finish=5.90
          57020) postprocessing_  cpu=9 start=6.36  finish=29.80
          57021) postprocessing_  cpu=7 start=6.36  finish=29.80
          57022) postprocessing_  cpu=5 start=6.36  finish=29.80
          57023) postprocessing_  cpu=2 start=6.36  finish=29.80
          57024) postprocessing_  cpu=13 start=6.36  finish=29.80
          57025) postprocessing_  cpu=11 start=6.36  finish=29.80
          57026) postprocessing_  cpu=3 start=6.36  finish=29.80
          57027) postprocessing_  cpu=1 start=6.36  finish=29.80
          57028) postprocessing_  cpu=4 start=6.36  finish=29.80
          57029) postprocessing_  cpu=14 start=6.36  finish=29.80
          57030) postprocessing_  cpu=6 start=6.36  finish=29.80
          57031) postprocessing_  cpu=8 start=6.36  finish=29.80
          57032) postprocessing_  cpu=15 start=6.36  finish=29.80
          57033) postprocessing_  cpu=12 start=6.36  finish=29.80
          57034) postprocessing_  cpu=10 start=6.36  finish=29.80