
Testing operations on the libreoffice office suite. This is a single-threaded test that runs in five seconds. Overall test time is a minute, mostly because of high variability.
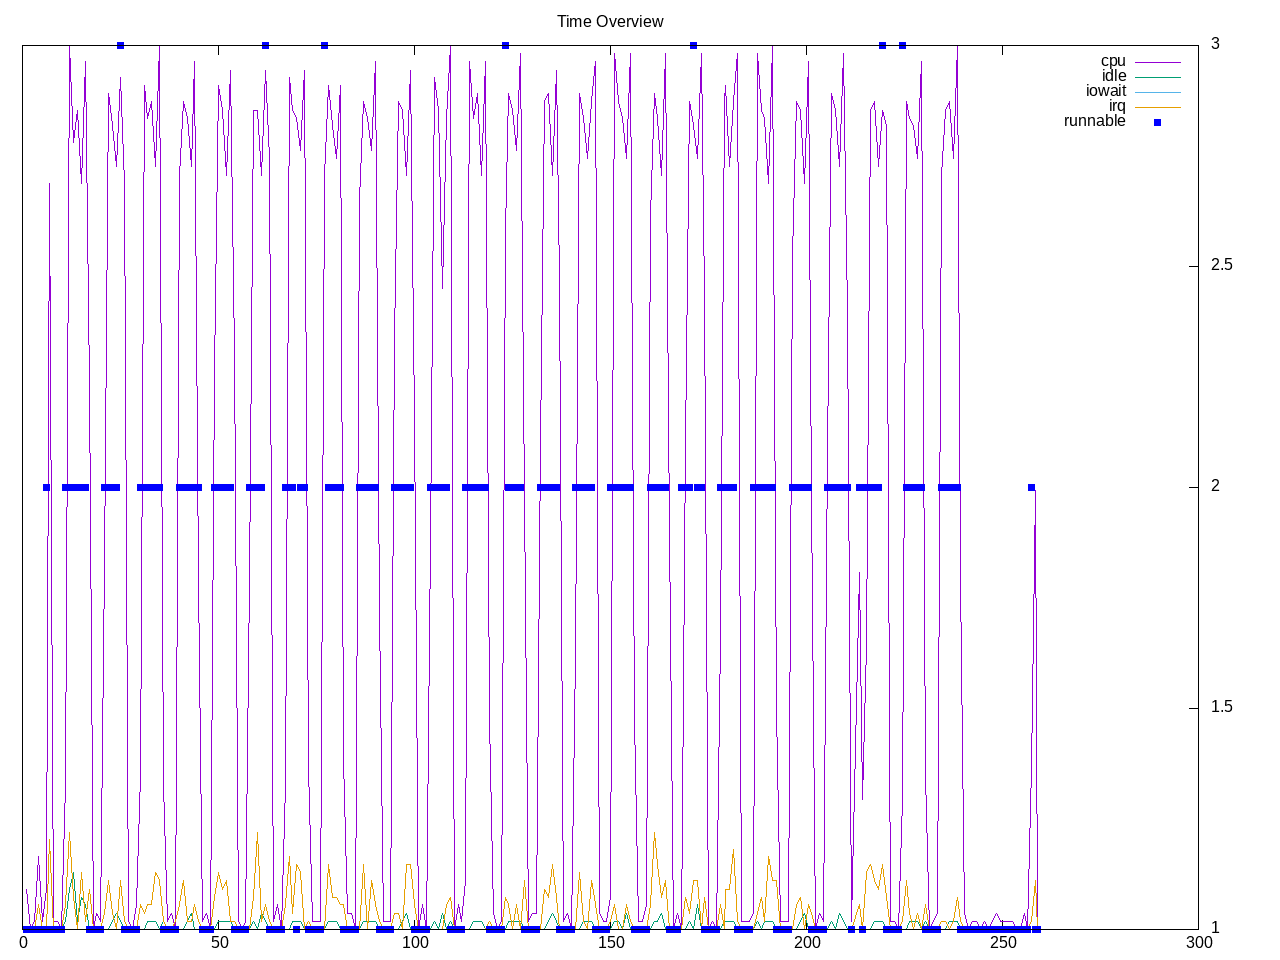
Topdown profile is sparse because of the short run
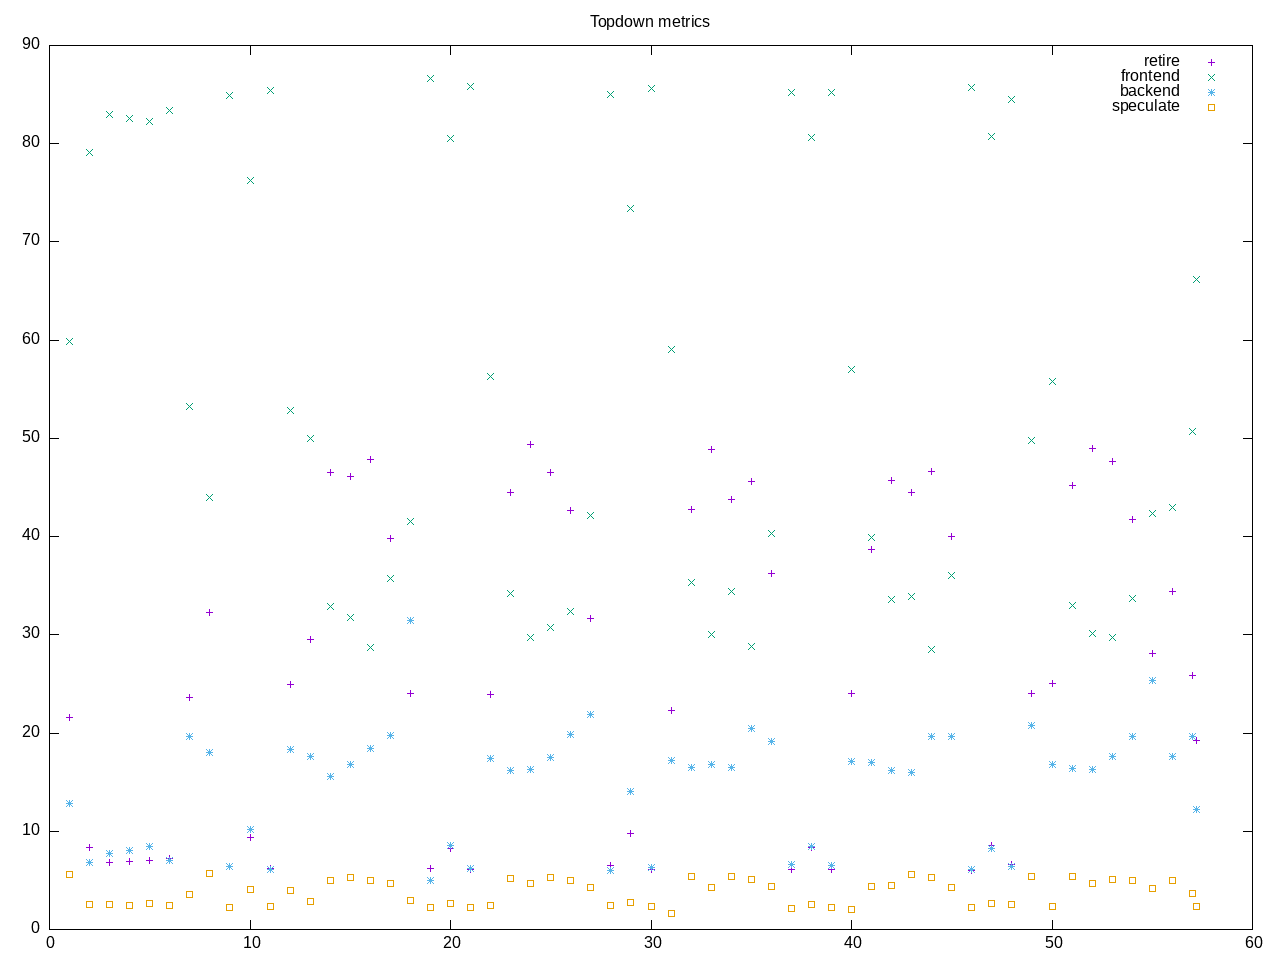
AMD metrics show little floating point and 1/5 instructions are branches.
elapsed              65.053
on_cpu               0.027          # 0.43 / 16 cores
utime                23.151
stime                5.130
nvcsw                9762           # 93.36%
nivcsw               694            # 6.64%
inblock              0              # 0.00/sec
onblock              231472         # 3558.20/sec
cpu-clock            28670040506    # 28.670 seconds
task-clock           28677377196    # 28.677 seconds
page faults          1952369        # 68080.459/sec
context switches     10793          # 376.359/sec
cpu migrations       496            # 17.296/sec
major page faults    2              # 0.070/sec
minor page faults    1952367        # 68080.389/sec
alignment faults     0              # 0.000/sec
emulation faults     0              # 0.000/sec
branches             60867415596    # 200.444 branches per 1000 inst
branch misses        884004142      # 1.45% branch miss
conditional          41929220922    # 138.078 conditional branches per 1000 inst
indirect             2911613795     # 9.588 indirect branches per 1000 inst
cpu-cycles           117546719492   # 0.11 GHz
instructions         297459137680   # 2.53 IPC
slots                241209687702   #
retiring             99530516378    # 41.3% (41.3%)
-- ucode             209766273      #     0.1%
-- fastpath          99320750105    #    41.2%
frontend             87544687255    # 36.3% (36.3%)
-- latency           56574027480    #    23.5%
-- bandwidth         30970659775    #    12.8%
backend              42964033184    # 17.8% (17.8%) low
-- cpu               6937592949     #     2.9%
-- memory            36026440235    #    14.9%
speculation          11106078823    #  4.6% ( 4.6%)
-- branch mispredict 10882699511    #     4.5%
-- pipeline restart  223379312      #     0.1%
smt-contention       64117039       #  0.0% ( 0.0%)
cpu-cycles           117448575149   # 0.11 GHz
instructions         297614366315   # 2.53 IPC
instructions         101365562489   # 25.898 l2 access per 1000 inst
l2 hit from l1       2313911682     # 15.80% l2 miss
l2 miss from l1      248710412      #
l2 hit from l2 pf    145147029      #
l3 hit from l2 pf    92422826       #
l3 miss from l2 pf   73685561       #
instructions         100944503121   # 21.604 float per 1000 inst
float 512            106            # 0.000 AVX-512 per 1000 inst
float 256            644            # 0.000 AVX-256 per 1000 inst
float 128            2180845145     # 21.604 AVX-128 per 1000 inst
float MMX            0              # 0.000 MMX per 1000 inst
float scalar         0              # 0.000 scalar per 1000 inst
Intel metrics
elapsed              54.031
on_cpu               0.036          # 0.57 / 16 cores
utime                27.985
stime                3.075
nvcsw                9058           # 95.55%
nivcsw               422            # 4.45%
inblock              0              # 0.00/sec
onblock              220312         # 4077.48/sec
cpu-clock            31361635146    # 31.362 seconds
task-clock           31371710340    # 31.372 seconds
page faults          1959051        # 62446.420/sec
context switches     9814           # 312.830/sec
cpu migrations       445            # 14.185/sec
major page faults    0              # 0.000/sec
minor page faults    1959051        # 62446.420/sec
alignment faults     0              # 0.000/sec
emulation faults     0              # 0.000/sec
branches             60079561479    # 198.728 branches per 1000 inst
branch misses        503746265      # 0.84% branch miss
conditional          60079603239    # 198.728 conditional branches per 1000 inst
indirect             2956796157     # 9.780 indirect branches per 1000 inst
slots                693544645334   #
retiring             293920153149   # 42.4% (42.4%)
-- ucode             24690564639    #     3.6%
-- fastpath          269229588510   #    38.8%
frontend             203371946515   # 29.3% (29.3%)
-- latency           80960925918    #    11.7%
-- bandwidth         122411020597   #    17.7%
backend              126035615832   # 18.2% (18.2%)
-- cpu               55693241478    #     8.0%
-- memory            70342374354    #    10.1%
speculation          72883668637    # 10.5% (10.5%) high
-- branch mispredict 67912085128    #     9.8%
-- pipeline restart  4971583509     #     0.7%
smt-contention       0              #  0.0% ( 0.0%)
cpu-cycles           116363225194   # 0.13 GHz
instructions         301780347164   # 2.59 IPC
l2 access            7057765981     # 23.435 l2 access per 1000 inst
l2 miss              1677968006     # 23.77% l2 miss
Process overview suggests largest time is Unzipping
1193 processes
	365 Unzipping              746.27   251.41
	150 Parser                 264.06   101.66
	 23 configmgrWriter         57.97    16.17
	 45 soffice.bin             22.11     3.95
	  5 PipeIPC                 21.64     3.80
	 68 clinfo                  19.18     7.32
	 38 vulkaninfo               1.50     1.33
	 10 soffice.:gdrv0           0.22     0.06
	 10 soffice.:shlo0           0.22     0.06
	 10 soffice.bi:cs0           0.22     0.06
	 10 soffice.bi:gl0           0.22     0.06
	 10 soffice.bi:sh0           0.22     0.06
	 10 soffice:disk$0           0.22     0.06
	  4 vulkani:disk$0           0.16     0.14
	  6 glxinfo:gdrv0            0.10     0.10
	  6 glxinfo:gl0              0.10     0.10
	  2 llvmpipe-0               0.09     0.07
	  2 llvmpipe-1               0.09     0.07
	  2 llvmpipe-10              0.09     0.07
	  2 llvmpipe-11              0.09     0.07
	  2 llvmpipe-12              0.09     0.07
	  2 llvmpipe-13              0.09     0.07
	  2 llvmpipe-14              0.09     0.07
	  2 llvmpipe-15              0.09     0.07
	  2 llvmpipe-2               0.09     0.07
	  2 llvmpipe-3               0.09     0.07
	  2 llvmpipe-4               0.09     0.07
	  2 llvmpipe-5               0.09     0.07
	  2 llvmpipe-6               0.09     0.07
	  2 llvmpipe-7               0.09     0.07
	  2 llvmpipe-8               0.09     0.07
	  2 llvmpipe-9               0.09     0.07
	  6 php                      0.06     0.08
	  6 clang                    0.06     0.06
	  2 glxinfo                  0.06     0.04
	  2 glxinfo:cs0              0.06     0.04
	  2 glxinfo:disk$0           0.06     0.04
	  2 glxinfo:sh0              0.06     0.04
	  2 glxinfo:shlo0            0.06     0.04
	  5 CUPSManager cup          0.00    12.11
	  3 rocminfo                 0.00     0.03
	  1 lspci                    0.00     0.02
	 86 sh                       0.00     0.00
	 40 libreoffice              0.00     0.00
	 21 dirname                  0.00     0.00
	 19 osl_executeProc          0.00     0.00
	 15 gpgconf                  0.00     0.00
	 14 gsettings                0.00     0.00
	 12 gcc                      0.00     0.00
	 12 uname                    0.00     0.00
	 11 grep                     0.00     0.00
	 11 sed                      0.00     0.00
	 10 basename                 0.00     0.00
	 10 ls                       0.00     0.00
	 10 oosplash                 0.00     0.00
	 10 rm                       0.00     0.00
	  8 stat                     0.00     0.00
	  8 systemd-detect-          0.00     0.00
	  6 llvm-link                0.00     0.00
	  5 gpg                      0.00     0.00
	  5 gpgsm                    0.00     0.00
	  5 head                     0.00     0.00
	  5 lo                       0.00     0.00
	  5 paperconf                0.00     0.00
	  5 phoronix-test-s          0.00     0.00
	  2 gmain                    0.00     0.00
	  2 lscpu                    0.00     0.00
	  2 which                    0.00     0.00
	  2 xset                     0.00     0.00
	  1 cc                       0.00     0.00
	  1 date                     0.00     0.00
	  1 dmesg                    0.00     0.00
	  1 dmidecode                0.00     0.00
	  1 ifconfig                 0.00     0.00
	  1 ip                       0.00     0.00
	  1 lsmod                    0.00     0.00
	  1 mktemp                   0.00     0.00
	  1 ps                       0.00     0.00
	  1 qdbus                    0.00     0.00
	  1 readlink                 0.00     0.00
	  1 realpath                 0.00     0.00
	  1 sort                     0.00     0.00
	  1 stty                     0.00     0.00
	  1 systemctl                0.00     0.00
	  1 template.sh              0.00     0.00
	  1 wc                       0.00     0.00
	  1 xrandr                   0.00     0.00
1 processes running
48 maximum processes
Overall a bit too small to be particularly interesting.