
A container for large language models. There are three workloads targeted towards both cpu and gpu. However, the numbers for CPU/GPU are almost identical on AMD. The largest model wizardcoder is 25Gb and seems to run for multiple hours per iteration on Intel, so will prune these and GPU instances for a shorter AMD and Intel run.
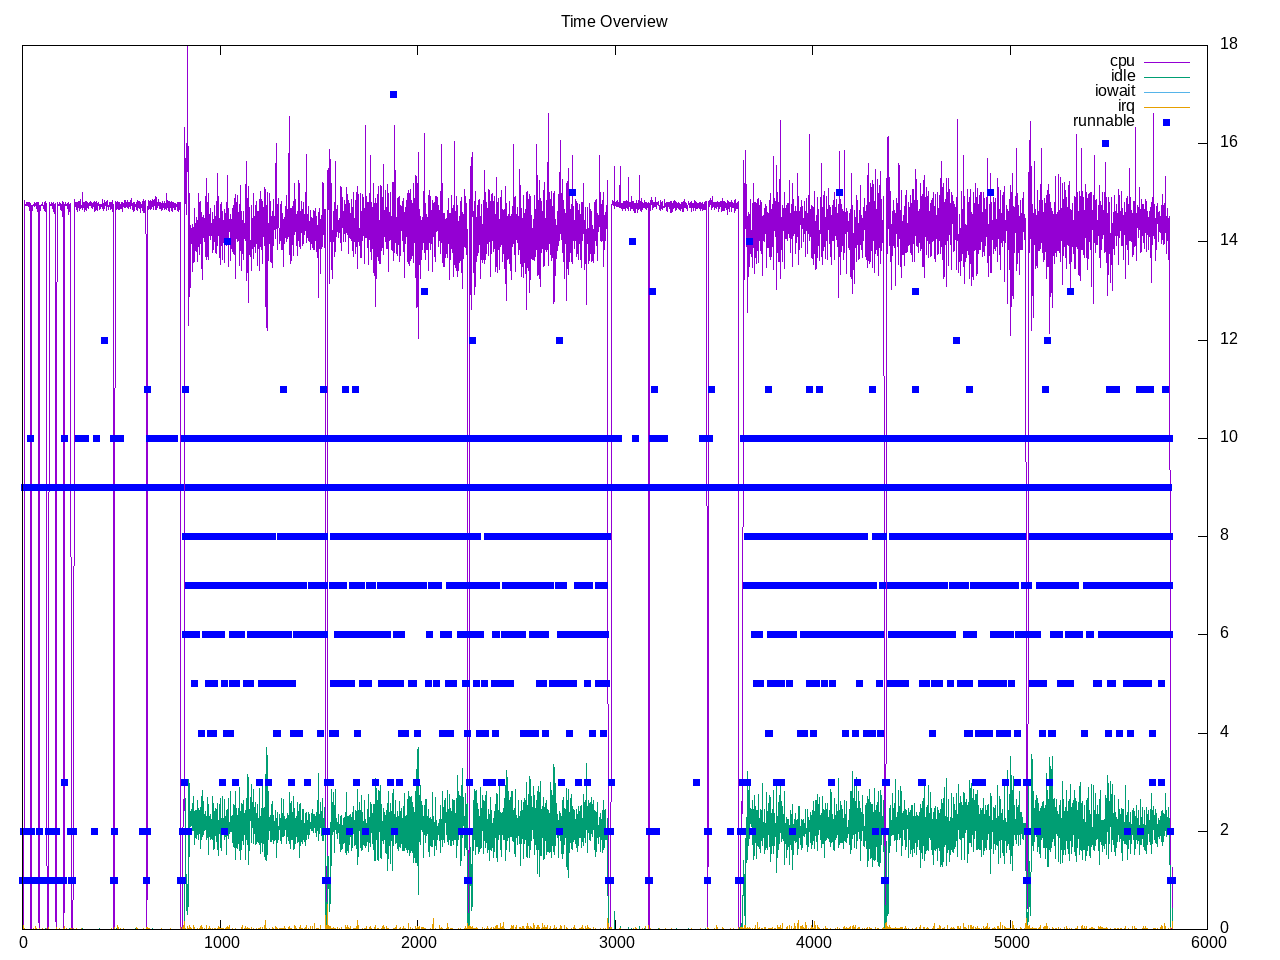
Below is overall initial profile with llava cpu followed by llava gpu that look similar. Next is mistral, then wizardcoder, mistral and wizardcoder.
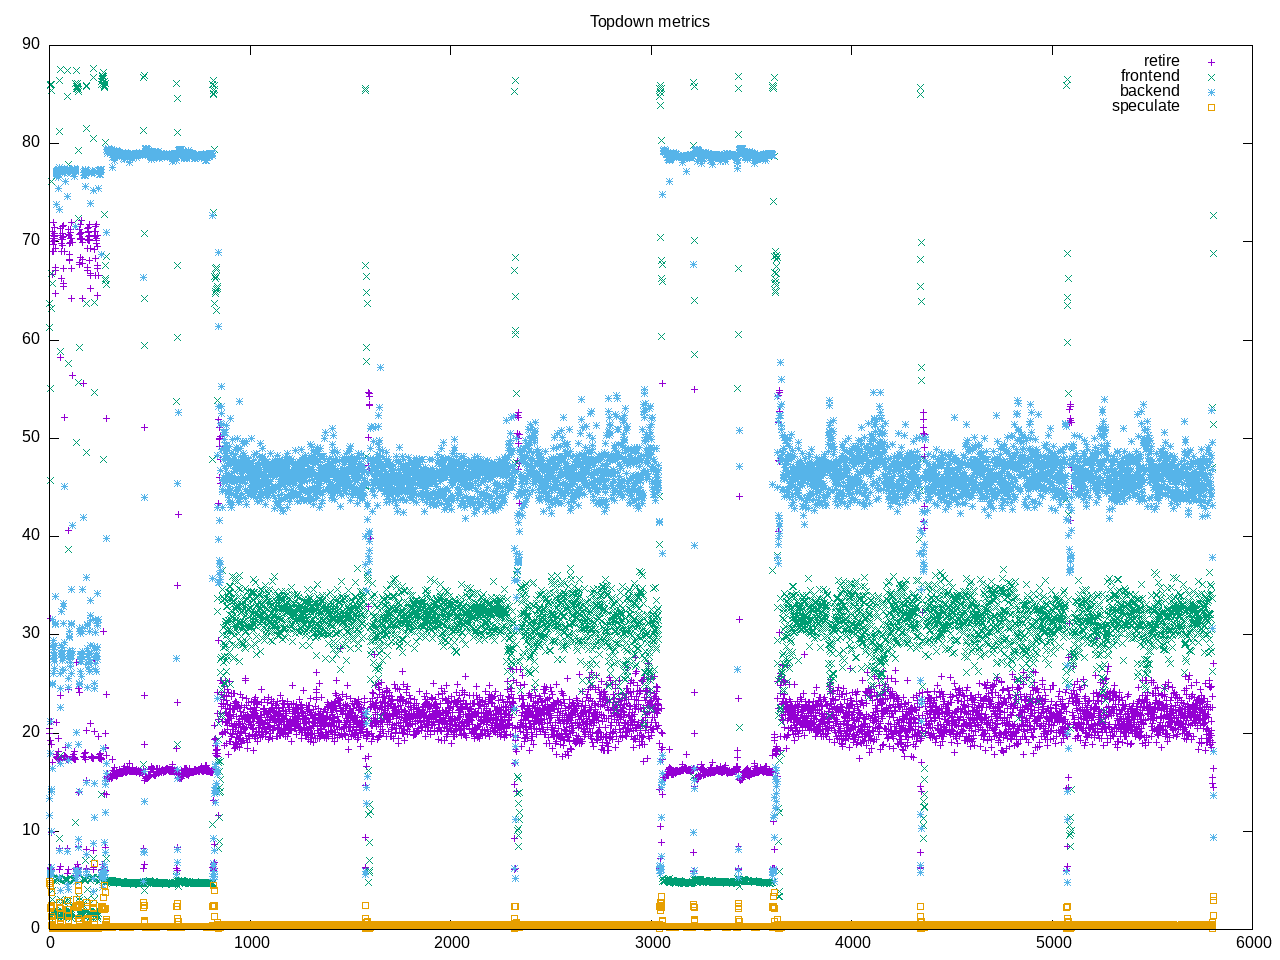
Topdown profile overall where it looks like the workloads have slightly different behaviors:
- llava has many backend stalls, occasional bursts of retiring around 70% mixed with 20%
- mistral has a high steady set of backend stalls and low frontend stalls
- wizardcoder has high amount of backend stalls followed by frontend stalls and retirement rate around 60%
AMD metrics for the initial runs. Not much floating point, about 1/5 branches and relatively lower L2 rate, though still 40% stalls overall due to memory.
elapsed              5740.930
on_cpu               0.428          # 6.84 / 16 cores
utime                19032.937
stime                20239.858
nvcsw                52563348       # 99.72%
nivcsw               147652         # 0.28%
inblock              31403119608    # 5470040.55/sec
onblock              38144          # 6.64/sec
cpu-clock            39261413823847 # 39261.414 seconds
task-clock           39279337459487 # 39279.337 seconds
page faults          353758504      # 9006.224/sec
context switches     52739472       # 1342.677/sec
cpu migrations       87009          # 2.215/sec
major page faults    101636407      # 2587.529/sec
minor page faults    252122097      # 6418.695/sec
alignment faults     0              # 0.000/sec
emulation faults     0              # 0.000/sec
branches             51479259799748 # 203.530 branches per 1000 inst
branch misses        1237762282920  # 2.40% branch miss
conditional          46059322653958 # 182.102 conditional branches per 1000 in
st
indirect             70496823006    # 0.279 indirect branches per 1000 inst
cpu-cycles           174391979349954 # 1.89 GHz
instructions         250856249247977 # 1.44 IPC
slots                349790712272532 #
retiring             73401234680303 # 21.0% (21.6%)
-- ucode             272932901934   #     0.1%
-- fastpath          73128301778369 #    20.9%
frontend             81513626313603 # 23.3% (23.9%)
-- latency           61933943649462 #    17.7%
-- bandwidth         19579682664141 #     5.6%
backend              184288707674764 # 52.7% (54.1%)
-- cpu               32547593647971 #     9.3%
-- memory            151741114026793 #    43.4%
speculation          1309588691565  #  0.4% ( 0.4%)
-- branch mispredict 1301250820929  #     0.4%
-- pipeline restart  8337870636     #     0.0%
smt-contention       9275220420640  #  2.7% ( 0.0%)
cpu-cycles           173630436198185 # 1.89 GHz
instructions         251446897565663 # 1.45 IPC
instructions         83927288072433 # 18.740 l2 access per 1000 inst
l2 hit from l1       1036401083080  # 35.43% l2 miss
l2 miss from l1      185454750375   #
l2 hit from l2 pf    164579165452   #
l3 hit from l2 pf    26313703133    #
l3 miss from l2 pf   345543249282   #
instructions         83884963229502 # 58.437 float per 1000 inst
float 512            80             # 0.000 AVX-512 per 1000 inst
float 256            590            # 0.000 AVX-256 per 1000 inst
float 128            4901955330707  # 58.437 AVX-128 per 1000 inst
float MMX            0              # 0.000 MMX per 1000 inst
float scalar         0              # 0.000 scalar per 1000 inst
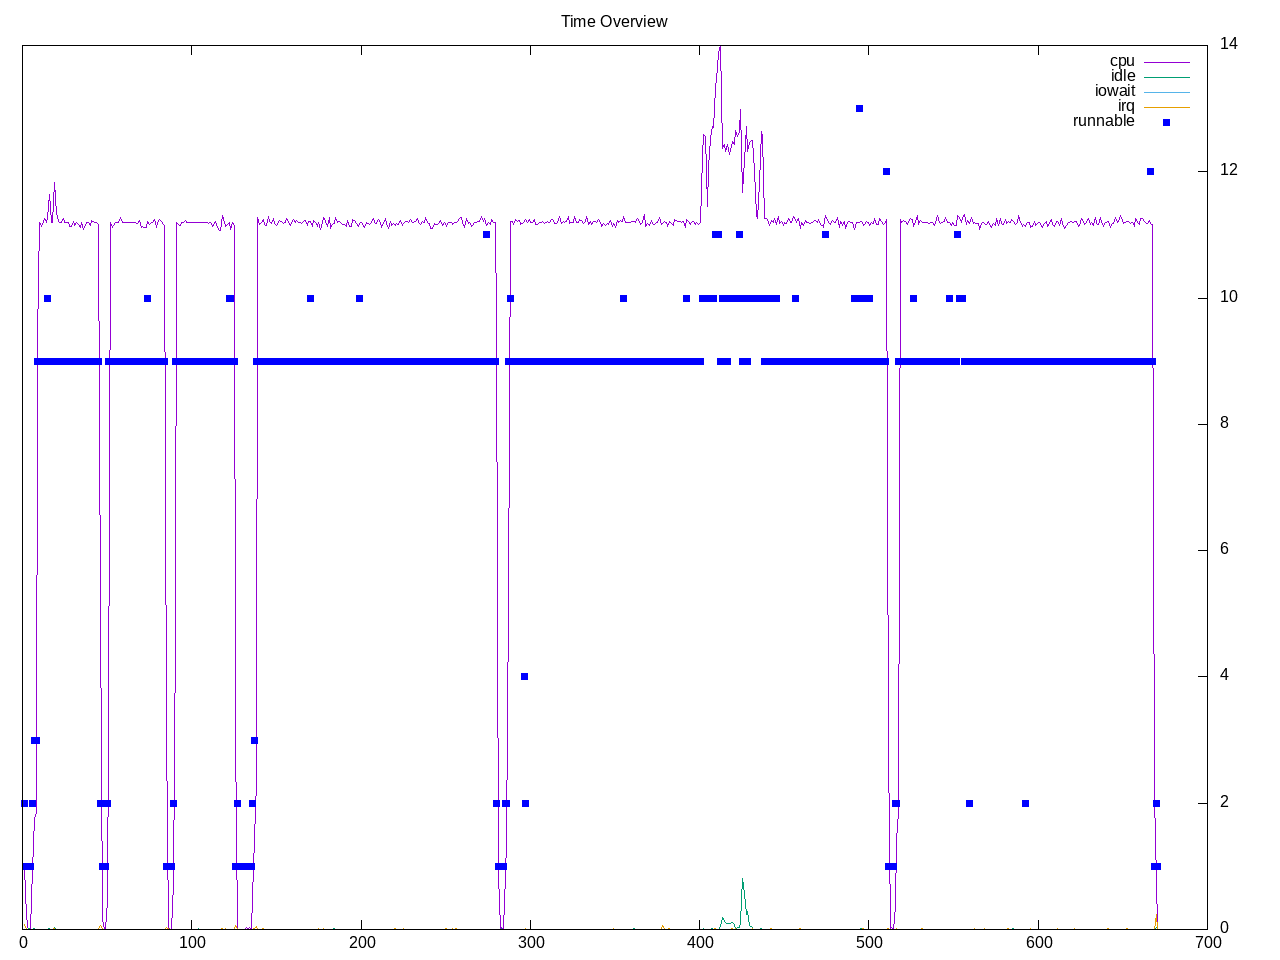
Below is a finer profile for CPU-only and skipping wizardcoder and running on both AMD and Intel.
System metrics
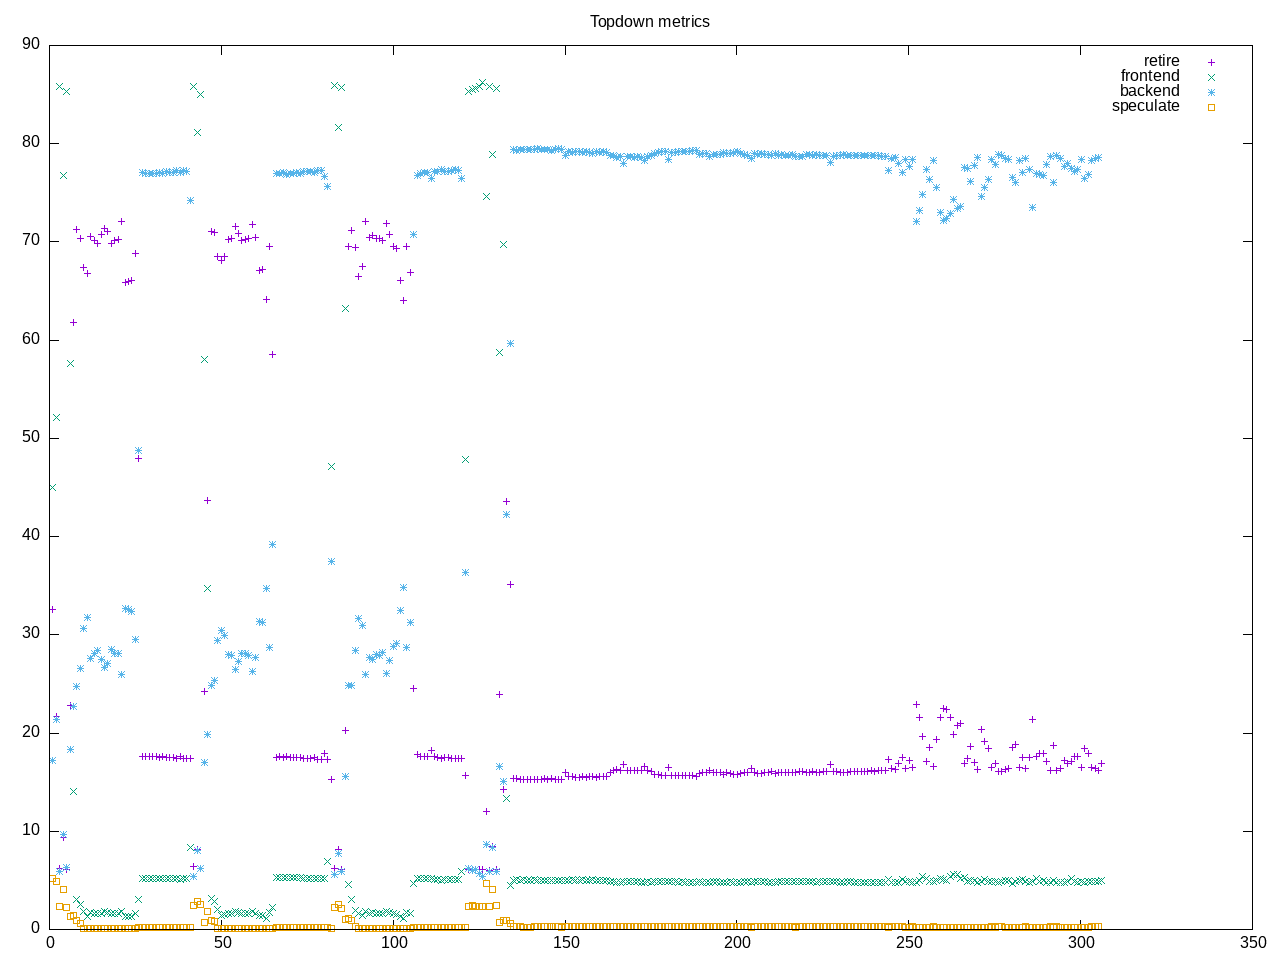
Topdown profile shows a consistent very high backend stall for mistral that now dominates. Frontend stalls have also decreased
AMD metrics have on-cpu about 50%, about 1/6 of the instructions are floating point and 1/8 of the instructions are branches.
elapsed              667.339
on_cpu               0.461          # 7.37 / 16 cores
utime                4905.423
stime                14.444
nvcsw                5395           # 14.74%
nivcsw               31215          # 85.26%
inblock              18528          # 27.76/sec
onblock              19520          # 29.25/sec
cpu-clock            4960666298242  # 4960.666 seconds
task-clock           4960706614930  # 4960.707 seconds
page faults          4464998        # 900.073/sec
context switches     39773          # 8.018/sec
cpu migrations       11723          # 2.363/sec
major page faults    103            # 0.021/sec
minor page faults    4464895        # 900.052/sec
alignment faults     0              # 0.000/sec
emulation faults     0              # 0.000/sec
branches             4035588127360  # 130.463 branches per 1000 inst
branch misses        7310505281     # 0.18% branch miss
conditional          3971931723479  # 128.405 conditional branches per 1000 inst
indirect             11640429002    # 0.376 indirect branches per 1000 inst
cpu-cycles           25333703263220 # 2.08 GHz
instructions         34439795611172 # 1.36 IPC
slots                51204272991462 #
retiring             10215999459883 # 20.0% (20.0%)
-- ucode             19900295748    #     0.0%
-- fastpath          10196099164135 #    19.9%
frontend             2419627561696  #  4.7% ( 4.7%)
-- latency           1856700162912  #     3.6%
-- bandwidth         562927398784   #     1.1%
backend              38415298990260 # 75.0% (75.1%)
-- cpu               6031775651712  #    11.8%
-- memory            32383523338548 #    63.2%
speculation          129528281851   #  0.3% ( 0.3%)
-- branch mispredict 122844753023   #     0.2%
-- pipeline restart  6683528828     #     0.0%
smt-contention       23803666239    #  0.0% ( 0.0%)
cpu-cycles           24037561495762 # 2.07 GHz
instructions         32871036475486 # 1.37 IPC
instructions         11020218304460 # 28.382 l2 access per 1000 inst
l2 hit from l1       181382801603   # 35.85% l2 miss
l2 miss from l1      4955340264     #
l2 hit from l2 pf    24230247202    #
l3 hit from l2 pf    2552245785     #
l3 miss from l2 pf   104608981619   #
instructions         11008357940799 # 171.573 float per 1000 inst
float 512            58             # 0.000 AVX-512 per 1000 inst
float 256            628            # 0.000 AVX-256 per 1000 inst
float 128            1888734595266  # 171.573 AVX-128 per 1000 inst
float MMX            0              # 0.000 MMX per 1000 inst
float scalar         0              # 0.000 scalar per 1000 inst
Intel metrics
elapsed              1105.661
on_cpu               0.685          # 10.96 / 16 cores
utime                12094.486
stime                25.406
nvcsw                102046         # 60.80%
nivcsw               65786          # 39.20%
inblock              24311000       # 21987.74/sec
onblock              8320           # 7.52/sec
cpu-clock            12193957359997 # 12193.957 seconds
task-clock           12194177616863 # 12194.178 seconds
page faults          4474723        # 366.956/sec
context switches     173169         # 14.201/sec
cpu migrations       15785          # 1.294/sec
major page faults    5362           # 0.440/sec
minor page faults    4469361        # 366.516/sec
alignment faults     0              # 0.000/sec
emulation faults     0              # 0.000/sec
branches             19882348618895 # 223.161 branches per 1000 inst
branch misses        7057325942     # 0.04% branch miss
conditional          19882349906991 # 223.161 conditional branches per 1000 inst
indirect             1694772181839  # 19.022 indirect branches per 1000 inst
slots                69260916573944 #
retiring             42473534180193 # 61.3% (61.3%)
-- ucode             1387721249939  #     2.0%
-- fastpath          41085812930254 #    59.3%
frontend             4202805929454  #  6.1% ( 6.1%)
-- latency           1173156955285  #     1.7%
-- bandwidth         3029648974169  #     4.4%
backend              22454897439220 # 32.4% (32.4%)
-- cpu               9963665012709  #    14.4%
-- memory            12491232426511 #    18.0%
speculation          135184450216   #  0.2% ( 0.2%)
-- branch mispredict 90651395969    #     0.1%
-- pipeline restart  44533054247    #     0.1%
smt-contention       0              #  0.0% ( 0.0%)
cpu-cycles           19131695130476 # 1.24 GHz
instructions         70685292369861 # 3.69 IPC
l2 access            267428419187   # 4.459 l2 access per 1000 inst
l2 miss              173959218540   # 65.05% l2 miss
Process overview
23667 processes
	23302 .ape-1.10            17522165.26 52960.63
	 68 clinfo                  17.77     5.33
	 38 vulkaninfo               1.33     1.12
	  4 vulkani:disk$0           0.14     0.11
	  6 php                      0.08     0.58
	  6 glxinfo:gdrv0            0.08     0.10
	  6 glxinfo:gl0              0.08     0.10
	  2 llvmpipe-0               0.07     0.06
	  2 llvmpipe-1               0.07     0.06
	  2 llvmpipe-10              0.07     0.06
	  2 llvmpipe-11              0.07     0.06
	  2 llvmpipe-12              0.07     0.06
	  2 llvmpipe-13              0.07     0.06
	  2 llvmpipe-14              0.07     0.06
	  2 llvmpipe-15              0.07     0.06
	  2 llvmpipe-2               0.07     0.06
	  2 llvmpipe-3               0.07     0.06
	  2 llvmpipe-4               0.07     0.06
	  2 llvmpipe-5               0.07     0.06
	  2 llvmpipe-6               0.07     0.06
	  2 llvmpipe-7               0.07     0.06
	  2 llvmpipe-8               0.07     0.06
	  2 llvmpipe-9               0.07     0.06
	  2 glxinfo                  0.04     0.05
	  2 glxinfo:cs0              0.04     0.04
	  2 glxinfo:disk$0           0.04     0.04
	  2 glxinfo:sh0              0.04     0.04
	  2 glxinfo:shlo0            0.04     0.04
	  6 clang                    0.03     0.09
	  3 rocminfo                 0.03     0.00
	  1 lspci                    0.00     0.03
	 83 sh                       0.00     0.00
	 12 gcc                      0.00     0.00
	  8 stat                     0.00     0.00
	  8 systemd-detect-          0.00     0.00
	  6 gsettings                0.00     0.00
	  6 llamafile                0.00     0.00
	  6 llvm-link                0.00     0.00
	  6 run-llava                0.00     0.00
	  6 run-mistral              0.00     0.00
	  5 dconf worker             0.00     0.00
	  5 gmain                    0.00     0.00
	  5 phoronix-test-s          0.00     0.00
	  2 lscpu                    0.00     0.00
	  2 uname                    0.00     0.00
	  2 which                    0.00     0.00
	  2 xset                     0.00     0.00
	  1 cc                       0.00     0.00
	  1 date                     0.00     0.00
	  1 dirname                  0.00     0.00
	  1 dmesg                    0.00     0.00
	  1 dmidecode                0.00     0.00
	  1 grep                     0.00     0.00
	  1 ifconfig                 0.00     0.00
	  1 ip                       0.00     0.00
	  1 lsmod                    0.00     0.00
	  1 mktemp                   0.00     0.00
	  1 ps                       0.00     0.00
	  1 qdbus                    0.00     0.00
	  1 readlink                 0.00     0.00
	  1 realpath                 0.00     0.00
	  1 sed                      0.00     0.00
	  1 sort                     0.00     0.00
	  1 stty                     0.00     0.00
	  1 systemctl                0.00     0.00
	  1 template.sh              0.00     0.00
	  1 wc                       0.00     0.00
	  1 xrandr                   0.00     0.00
0 processes running
47 maximum processes
Computation blocks look something like this…except as suggested above by the number of processes, many more.
      497258) llamafile        cpu=0 start=5.54  finish=43.87
        497259) run-llava        cpu=2 start=5.54  finish=43.87
          497260) .ape-1.10        cpu=7 start=5.55  finish=43.69
            497261) run-llava        cpu=9 start=5.55  finish=5.55
            497262) .ape-1.10        cpu=0 start=6.74  finish=8.71
            497263) .ape-1.10        cpu=1 start=6.74  finish=8.71
            497264) .ape-1.10        cpu=11 start=6.74  finish=8.71
            497265) .ape-1.10        cpu=12 start=6.74  finish=8.71
            497266) .ape-1.10        cpu=2 start=6.74  finish=8.71
            497267) .ape-1.10        cpu=7 start=6.74  finish=8.71
            497268) .ape-1.10        cpu=13 start=6.74  finish=8.71
            497269) .ape-1.10        cpu=0 start=8.72  finish=9.63
            497270) .ape-1.10        cpu=11 start=8.72  finish=9.63
            497271) .ape-1.10        cpu=12 start=8.72  finish=9.63
            497272) .ape-1.10        cpu=2 start=8.72  finish=9.63
            497273) .ape-1.10        cpu=1 start=8.72  finish=9.63
            497274) .ape-1.10        cpu=7 start=8.72  finish=9.63
            497275) .ape-1.10        cpu=13 start=8.72  finish=9.63
            497276) .ape-1.10        cpu=0 start=9.64  finish=23.74
            497277) .ape-1.10        cpu=12 start=9.64  finish=23.74
            497278) .ape-1.10        cpu=11 start=9.64  finish=23.74
            497279) .ape-1.10        cpu=10 start=9.64  finish=23.74
            497280) .ape-1.10        cpu=9 start=9.64  finish=23.74
            497281) .ape-1.10        cpu=13 start=9.64  finish=23.74
            497282) .ape-1.10        cpu=7 start=9.64  finish=23.74
            497288) .ape-1.10        cpu=9 start=23.74 finish=25.56
            497289) .ape-1.10        cpu=10 start=23.74 finish=25.56
            497290) .ape-1.10        cpu=11 start=23.74 finish=25.56
            497291) .ape-1.10        cpu=8 start=23.74 finish=25.56
            497292) .ape-1.10        cpu=12 start=23.74 finish=25.56
            497293) .ape-1.10        cpu=7 start=23.74 finish=25.56
            497294) .ape-1.10        cpu=5 start=23.74 finish=25.56
            497295) .ape-1.10        cpu=13 start=25.56 finish=26.23
            497296) .ape-1.10        cpu=10 start=25.56 finish=26.23
            497297) .ape-1.10        cpu=15 start=25.56 finish=26.23
            497298) .ape-1.10        cpu=1 start=25.56 finish=26.23
            497299) .ape-1.10        cpu=8 start=25.56 finish=26.23
            497300) .ape-1.10        cpu=11 start=25.56 finish=26.23
            497301) .ape-1.10        cpu=12 start=25.56 finish=26.23
            497302) .ape-1.10        cpu=12 start=26.23 finish=26.35
            497303) .ape-1.10        cpu=13 start=26.23 finish=26.35
            497304) .ape-1.10        cpu=8 start=26.23 finish=26.35
            497305) .ape-1.10        cpu=9 start=26.23 finish=26.35
            497306) .ape-1.10        cpu=11 start=26.23 finish=26.35
            497307) .ape-1.10        cpu=10 start=26.23 finish=26.35
            497308) .ape-1.10        cpu=7 start=26.23 finish=26.35
            497309) .ape-1.10        cpu=7 start=26.35 finish=26.48
            497310) .ape-1.10        cpu=4 start=26.35 finish=26.48
            497311) .ape-1.10        cpu=13 start=26.35 finish=26.48
            497312) .ape-1.10        cpu=1 start=26.35 finish=26.48
            497313) .ape-1.10        cpu=3 start=26.35 finish=26.48
            497314) .ape-1.10        cpu=0 start=26.35 finish=26.48
            497315) .ape-1.10        cpu=14 start=26.35 finish=26.48
            497316) .ape-1.10        cpu=2 start=26.48 finish=26.60
            497317) .ape-1.10        cpu=11 start=26.48 finish=26.60
            497318) .ape-1.10        cpu=4 start=26.48 finish=26.60
            497319) .ape-1.10        cpu=1 start=26.48 finish=26.60
            497320) .ape-1.10        cpu=8 start=26.48 finish=26.60
            497321) .ape-1.10        cpu=13 start=26.48 finish=26.60
            497322) .ape-1.10        cpu=15 start=26.48 finish=26.60
            497323) .ape-1.10        cpu=13 start=26.60 finish=26.72
            497324) .ape-1.10        cpu=4 start=26.60 finish=26.72
            497325) .ape-1.10        cpu=1 start=26.60 finish=26.72
            497326) .ape-1.10        cpu=7 start=26.60 finish=26.72
            497327) .ape-1.10        cpu=2 start=26.60 finish=26.72
            497328) .ape-1.10        cpu=0 start=26.60 finish=26.72
            497329) .ape-1.10        cpu=3 start=26.60 finish=26.72
            497330) .ape-1.10        cpu=13 start=26.72 finish=26.84
            497331) .ape-1.10        cpu=4 start=26.72 finish=26.84
            497332) .ape-1.10        cpu=9 start=26.72 finish=26.84
            497333) .ape-1.10        cpu=15 start=26.72 finish=26.84
            497334) .ape-1.10        cpu=10 start=26.72 finish=26.84
            497335) .ape-1.10        cpu=8 start=26.72 finish=26.84
            497336) .ape-1.10        cpu=3 start=26.72 finish=26.84
            497337) .ape-1.10        cpu=2 start=26.84 finish=26.96