
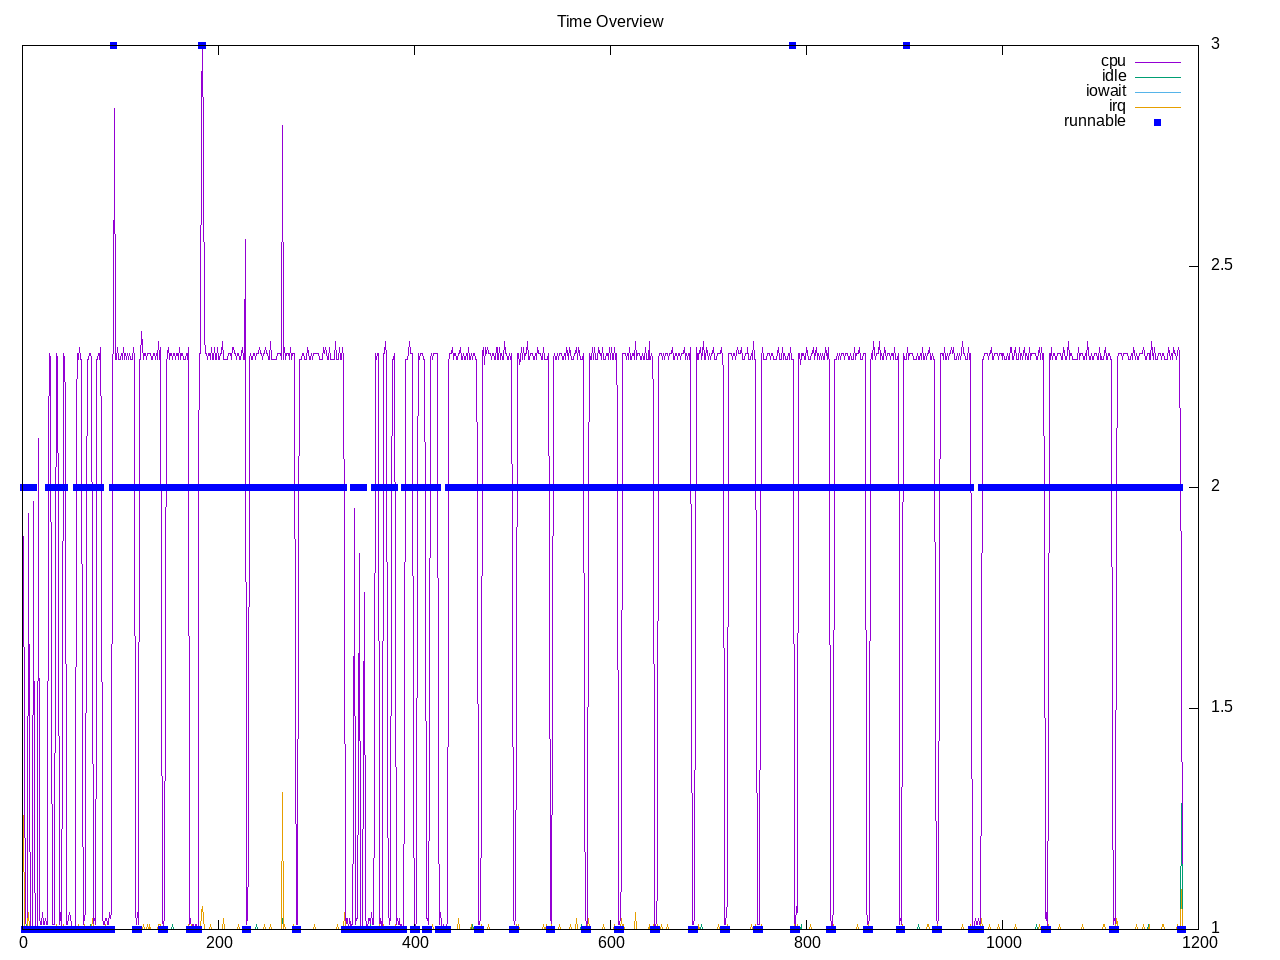
A test of the memory bandwidth with 10 tests not all of whom run. It provides a set of memory MiB/s for various sizes. This looks to be mostly single-threaded test
Topdown profile confirms this is a backend bound test with some frontend stalls in larger sizes.
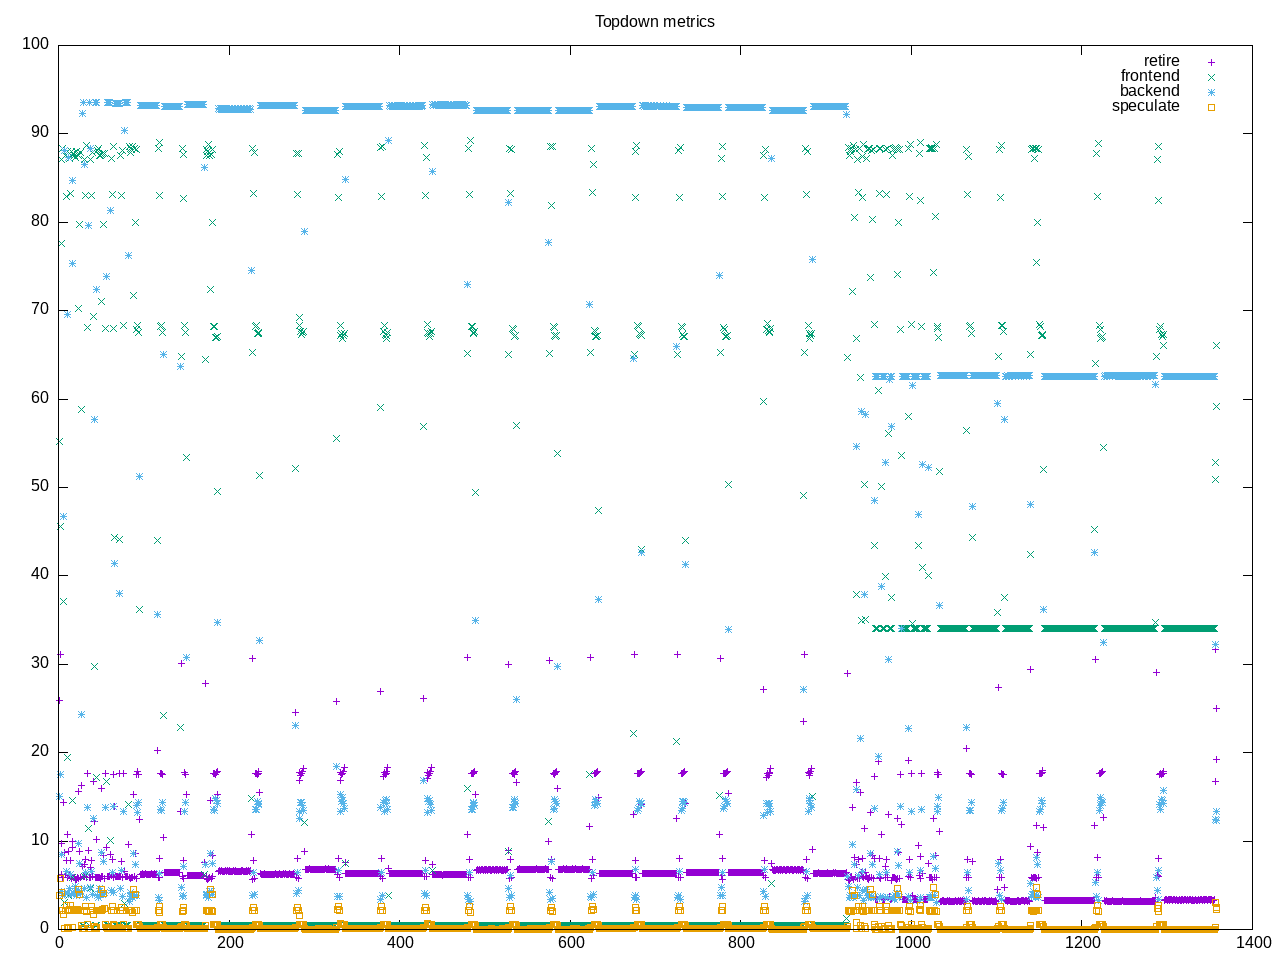
AMD metrics show integer code with a large amount of L2 access and moderate L2 misses. Retirement is low and branch speculation is also low.
elapsed              1906.853
on_cpu               0.054          # 0.86 / 16 cores
utime                1465.009
stime                168.283
nvcsw                2300           # 26.27%
nivcsw               6455           # 73.73%
inblock              11800          # 6.19/sec
onblock              15256          # 8.00/sec
cpu-clock            1633730433783  # 1633.730 seconds
task-clock           1633769790814  # 1633.770 seconds
page faults          118525539      # 72547.271/sec
context switches     17991          # 11.012/sec
cpu migrations       492            # 0.301/sec
major page faults    161            # 0.099/sec
minor page faults    118525378      # 72547.172/sec
alignment faults     0              # 0.000/sec
emulation faults     0              # 0.000/sec
branches             184498880490   # 125.478 branches per 1000 inst
branch misses        17912279504    # 9.71% branch miss
conditional          104707448177   # 71.211 conditional branches per 1000 inst
indirect             220068086      # 0.150 indirect branches per 1000 inst
cpu-cycles           9419362477582  # 0.25 GHz
instructions         1577981338302  # 0.17 IPC low
slots                18847418332872 #
retiring             1050894854958  #  5.6% ( 5.6%) low
-- ucode             2259314547     #     0.0%
-- fastpath          1048635540411  #     5.6%
frontend             5607452820130  # 29.8% (29.8%)
-- latency           1088308031532  #     5.8%
-- bandwidth         4519144788598  #    24.0%
backend              12170699176018 # 64.6% (64.6%)
-- cpu               1136102468324  #     6.0%
-- memory            11034596707694 #    58.5%
speculation          18222191413    #  0.1% ( 0.1%) low
-- branch mispredict 17960309928    #     0.1%
-- pipeline restart  261881485      #     0.0%
smt-contention       148500392      #  0.0% ( 0.0%)
cpu-cycles           7614828753868  # 0.25 GHz
instructions         1422724198869  # 0.19 IPC low
instructions         474208968884   # 884.989 l2 access per 1000 inst
l2 hit from l1       263889056294   # 34.85% l2 miss
l2 miss from l1      21212440530    #
l2 hit from l2 pf    30746495113    #
l3 hit from l2 pf    93217343       #
l3 miss from l2 pf   124940831103   #
instructions         473877223684   # 1.407 float per 1000 inst
float 512            105            # 0.000 AVX-512 per 1000 inst
float 256            628            # 0.000 AVX-256 per 1000 inst
float 128            666869221      # 1.407 AVX-128 per 1000 inst
float MMX            0              # 0.000 MMX per 1000 inst
float scalar         0              # 0.000 scalar per 1000 inst
instructions         1629693076163  #
opcache              346637082277   # 212.701 opcache per 1000 inst
opcache miss         94188496323    # 27.2% opcache miss rate
l1 dTLB miss         8230083399     # 5.050 L1 dTLB per 1000 inst
l2 dTLB miss         8044640037     # 4.936 L2 dTLB per 1000 inst
instructions         1682572313999  #
icache               239322611531   # 142.236 icache per 1000 inst
icache miss          5556630826     #  2.3% icache miss rate
l1 iTLB miss         9942612        # 0.006 L1 iTLB per 1000 inst
l2 iTLB miss         0              # 0.000 L2 iTLB per 1000 inst
tlb flush            32020          # 0.000 TLB flush per 1000 inst
Intel metrics show some L2 misses and 35% memory wait.
elapsed              517.446
on_cpu               0.041          # 0.65 / 16 cores
utime                292.934
stime                45.784
nvcsw                6723           # 72.07%
nivcsw               2606           # 27.93%
inblock              338344         # 653.87/sec
onblock              2760           # 5.33/sec
cpu-clock            338823248265   # 338.823 seconds
task-clock           338834035232   # 338.834 seconds
page faults          41152904       # 121454.458/sec
context switches     11710          # 34.560/sec
cpu migrations       384            # 1.133/sec
major page faults    3868           # 11.416/sec
minor page faults    41149035       # 121443.039/sec
alignment faults     0              # 0.000/sec
emulation faults     0              # 0.000/sec
branches             54342363240    # 123.020 branches per 1000 inst
branch misses        53810125       # 0.10% branch miss
conditional          54342374216    # 123.020 conditional branches per 1000 inst
indirect             108688801      # 0.246 indirect branches per 1000 inst
slots                6532654943156  #
retiring             638473263119   #  9.8% ( 9.8%) low
-- ucode             161532651554   #     2.5%
-- fastpath          476940611565   #     7.3%
frontend             345713728545   #  5.3% ( 5.3%)
-- latency           206060283622   #     3.2%
-- bandwidth         139653444923   #     2.1%
backend              5642367685225  # 86.4% (86.4%) high
-- cpu               313856952783   #     4.8%
-- memory            5328510732442  #    81.6%
speculation          122339221354   #  1.9% ( 1.9%)
-- branch mispredict 54754544255    #     0.8%
-- pipeline restart  67584677099    #     1.0%
smt-contention       0              #  0.0% ( 0.0%)
cpu-cycles           1099257587698  # 0.13 GHz
instructions         423991355150   # 0.39 IPC low
l2 access            196921917831   # 464.565 l2 access per 1000 inst
l2 miss              151420460256   # 76.89% l2 miss
cpu-cycles           1108264144554  # 84.2% memory latency
load stalls          760509116721   #  1.8% l1 bound
l1 miss              740812702789   # 12.4% l2 bound
l2 miss              603439901224   # 18.7% l3 bound
l3 miss              395727304135   # 35.7% dram bound
store_stalls         172596010117   # 15.6% store bound
Process overview shows time is spent in invocations of mbw process
435 processes
	 42 mbw                    875.10    97.92
	 68 clinfo                  15.87     6.64
	 38 vulkaninfo               1.31     1.33
	  6 php                      0.14     0.45
	  4 vulkani:disk$0           0.13     0.14
	  2 llvmpipe-0               0.07     0.07
	  2 llvmpipe-1               0.07     0.07
	  2 llvmpipe-10              0.07     0.07
	  2 llvmpipe-11              0.07     0.07
	  2 llvmpipe-12              0.07     0.07
	  2 llvmpipe-13              0.07     0.07
	  2 llvmpipe-14              0.07     0.07
	  2 llvmpipe-15              0.07     0.07
	  2 llvmpipe-2               0.07     0.07
	  2 llvmpipe-3               0.07     0.07
	  2 llvmpipe-4               0.07     0.07
	  2 llvmpipe-5               0.07     0.07
	  2 llvmpipe-6               0.07     0.07
	  2 llvmpipe-7               0.07     0.07
	  2 llvmpipe-8               0.07     0.07
	  2 llvmpipe-9               0.07     0.07
	  6 clang                    0.03     0.09
	  3 rocminfo                 0.03     0.00
	  1 lspci                    0.00     0.02
	  1 ps                       0.00     0.01
	102 sh                       0.00     0.00
	 42 mbw-benchmark            0.00     0.00
	 13 gcc                      0.00     0.00
	  8 gsettings                0.00     0.00
	  8 stat                     0.00     0.00
	  8 systemd-detect-          0.00     0.00
	  6 llvm-link                0.00     0.00
	  5 glxinfo                  0.00     0.00
	  5 phoronix-test-s          0.00     0.00
	  4 dconf worker             0.00     0.00
	  4 gmain                    0.00     0.00
	  2 cc                       0.00     0.00
	  2 grep                     0.00     0.00
	  2 lscpu                    0.00     0.00
	  2 setterm                  0.00     0.00
	  2 uname                    0.00     0.00
	  2 which                    0.00     0.00
	  1 date                     0.00     0.00
	  1 dirname                  0.00     0.00
	  1 dmesg                    0.00     0.00
	  1 dmidecode                0.00     0.00
	  1 ifconfig                 0.00     0.00
	  1 ip                       0.00     0.00
	  1 lsmod                    0.00     0.00
	  1 mktemp                   0.00     0.00
	  1 qdbus                    0.00     0.00
	  1 readlink                 0.00     0.00
	  1 realpath                 0.00     0.00
	  1 sed                      0.00     0.00
	  1 sort                     0.00     0.00
	  1 stty                     0.00     0.00
	  1 systemctl                0.00     0.00
	  1 template.sh              0.00     0.00
	  1 wc                       0.00     0.00
0 processes running
47 maximum processes
Process structure is simple
      235063) sh               cpu=1 start=81.78 finish=81.78
        235064) sh               cpu=3 start=81.78 finish=81.78
      235065) mbw-benchmark    cpu=8 start=91.98 finish=115.85
        235066) mbw              cpu=1 start=91.99 finish=115.85
      235067) mbw-benchmark    cpu=0 start=119.85 finish=143.70
        235068) mbw              cpu=1 start=119.86 finish=143.70
      235069) mbw-benchmark    cpu=0 start=147.71 finish=172.00
        235070) mbw              cpu=1 start=147.71 finish=171.99
      235071) sh               cpu=1 start=172.00 finish=172.00
        235072) sh               cpu=10 start=172.00 finish=172.00
      235074) mbw-benchmark    cpu=9 start=182.18 finish=229.48
        235075) mbw              cpu=2 start=182.18 finish=229.48
      235076) mbw-benchmark    cpu=9 start=233.49 finish=281.12
        235077) mbw              cpu=10 start=233.49 finish=281.12
      235078) mbw-benchmark    cpu=1 start=285.12 finish=332.32
        235079) mbw              cpu=10 start=285.13 finish=332.32