
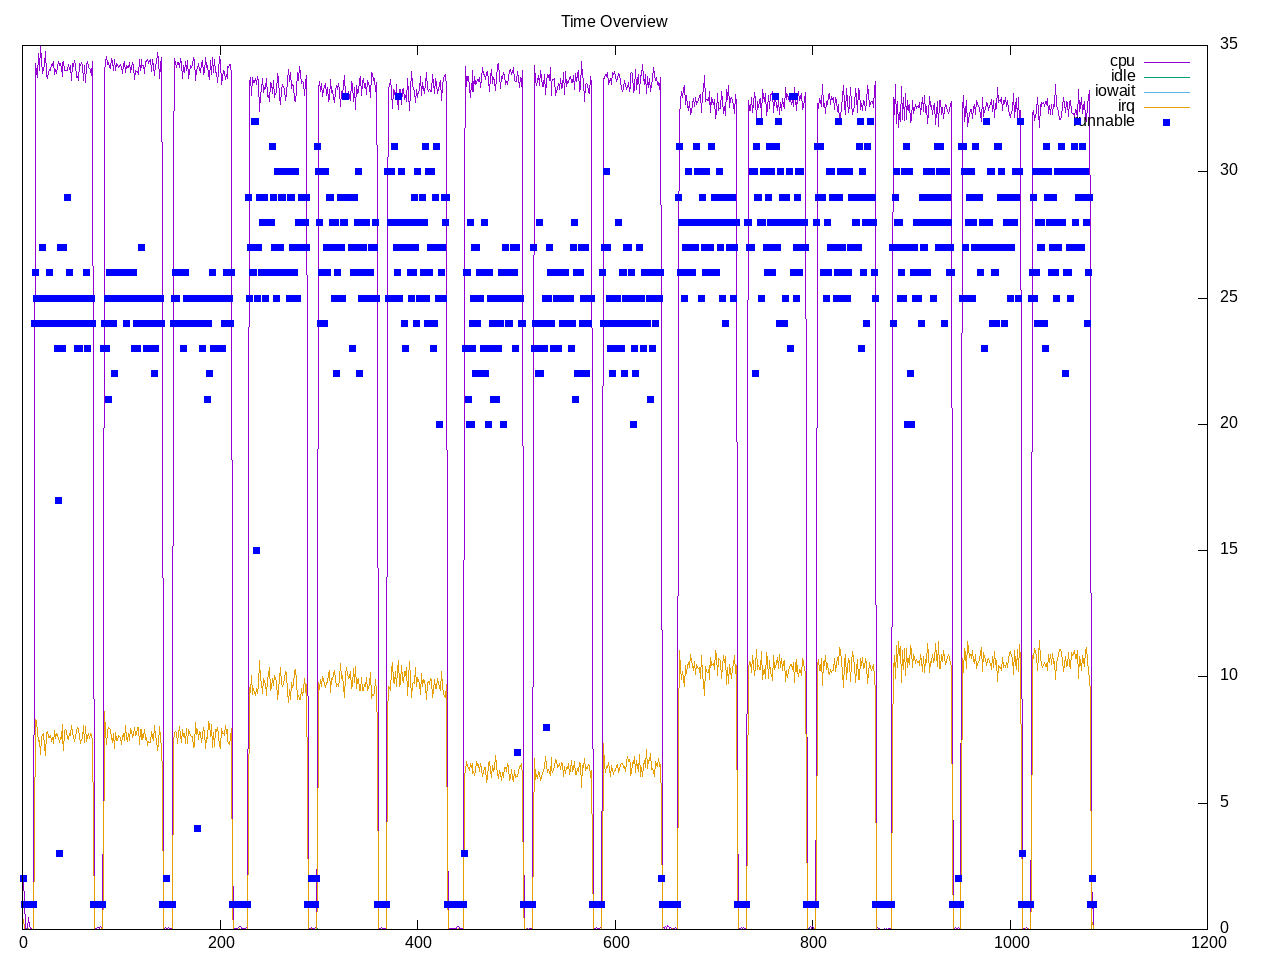
A distributed memory object caching system. There are five tests. These run on AMD system but appeared to hang on my Intel system. Overall a high level of interrupts.
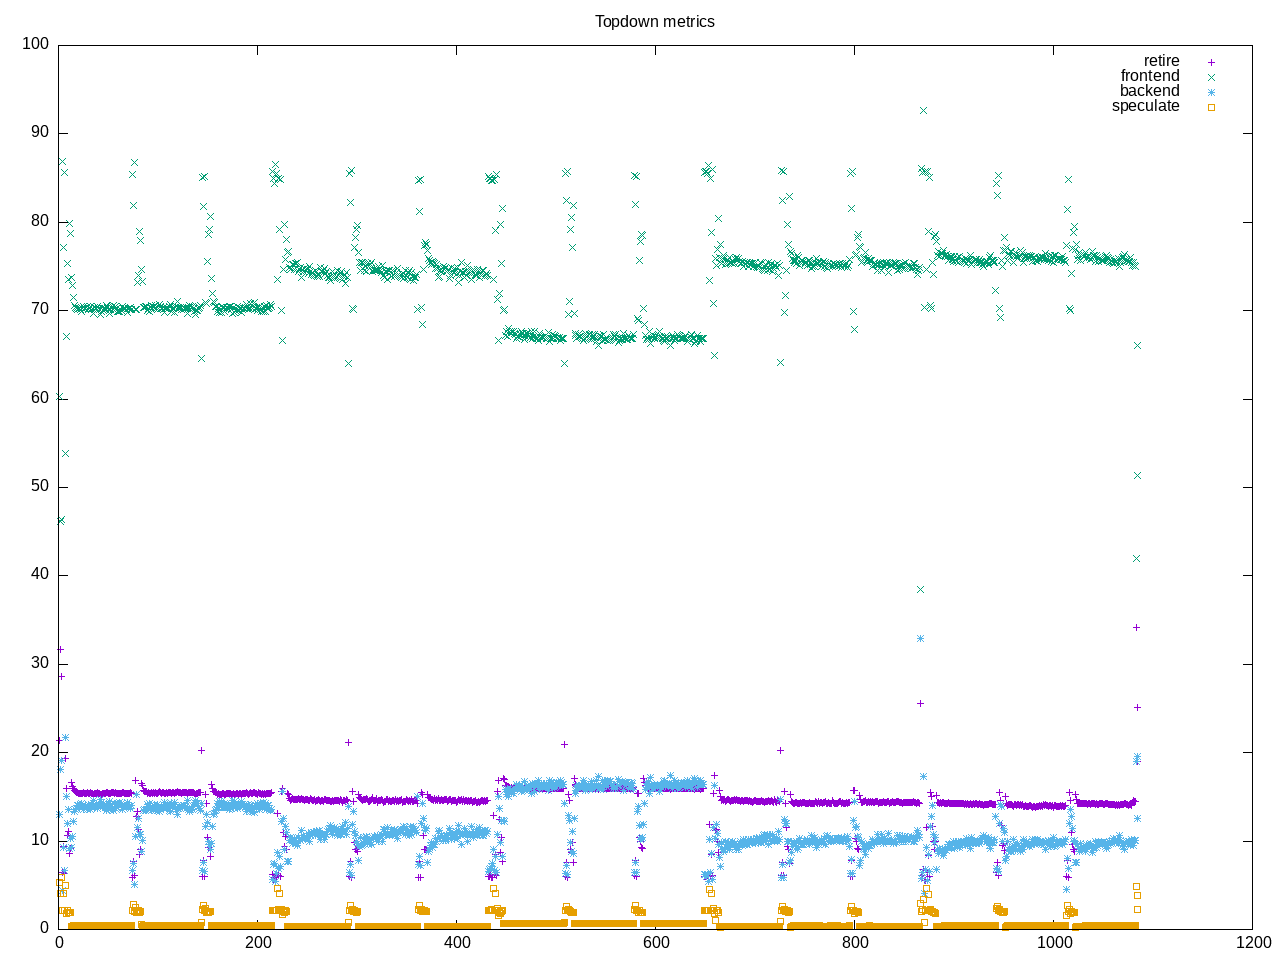
Topdown profile shows a high level of frontend stalls and lower backend stalls.
AMD metrics show little floating point. There is a high opcache miss rate and relatively high icache miss rate.
elapsed              1084.896
on_cpu               0.389          # 6.22 / 16 cores
utime                1805.389
stime                4939.507
nvcsw                222708743      # 99.61%
nivcsw               879355         # 0.39%
inblock              0              # 0.00/sec
onblock              13520          # 12.46/sec
cpu-clock            14028143035597 # 14028.143 seconds
task-clock           14037521121094 # 14037.521 seconds
page faults          414637         # 29.538/sec
context switches     452028530      # 32201.450/sec
cpu migrations       13908050       # 990.777/sec
major page faults    4              # 0.000/sec
minor page faults    414633         # 29.537/sec
alignment faults     0              # 0.000/sec
emulation faults     0              # 0.000/sec
branches             7951525581786  # 201.057 branches per 1000 inst
branch misses        699053211919   # 8.79% branch miss
conditional          4336195723529  # 109.642 conditional branches per 1000 inst
indirect             190468268236   # 4.816 indirect branches per 1000 inst
cpu-cycles           55276954057609 # 3.19 GHz
instructions         40357397448074 # 0.73 IPC
slots                109074132046182 #
retiring             14946314860049 # 13.7% (15.0%)
-- ucode             84759708463    #     0.1%
-- fastpath          14861555151586 #    13.6%
frontend             72590179804234 # 66.6% (72.8%) high
-- latency           61583813788416 #    56.5%
-- bandwidth         11006366015818 #    10.1%
backend              11812472983875 # 10.8% (11.8%) low
-- cpu               1924685512382  #     1.8%
-- memory            9887787471493  #     9.1%
speculation          405394937992   #  0.4% ( 0.4%) low
-- branch mispredict 404417600603   #     0.4%
-- pipeline restart  977337389      #     0.0%
smt-contention       9314599861603  #  8.5% ( 0.0%)
cpu-cycles           55180514514939 # 3.18 GHz
instructions         40266935720025 # 0.73 IPC
instructions         13262256645581 # 96.029 l2 access per 1000 inst
l2 hit from l1       1230269784634  # 3.68% l2 miss
l2 miss from l1      35338152294    #
l2 hit from l2 pf    31699410997    #
l3 hit from l2 pf    11257846706    #
l3 miss from l2 pf   331933190      #
instructions         13269290387328 # 12.628 float per 1000 inst
float 512            110            # 0.000 AVX-512 per 1000 inst
float 256            378            # 0.000 AVX-256 per 1000 inst
float 128            167564373522   # 12.628 AVX-128 per 1000 inst
float MMX            0              # 0.000 MMX per 1000 inst
float scalar         0              # 0.000 scalar per 1000 inst
instructions         40133117880873 #
opcache              10528047887039 # 262.328 opcache per 1000 inst
opcache miss         6905745934303  # 65.6% opcache miss rate
l1 dTLB miss         190180493018   # 4.739 L1 dTLB per 1000 inst
l2 dTLB miss         24651135861    # 0.614 L2 dTLB per 1000 inst
instructions         39830954865181 #
icache               10343658357264 # 259.689 icache per 1000 inst
icache miss          2793707140548  # 27.0% icache miss rate
l1 iTLB miss         83597661651    # 2.099 L1 iTLB per 1000 inst
l2 iTLB miss         0              # 0.000 L2 iTLB per 1000 inst
tlb flush            407944934      # 0.010 TLB flush per 1000 inst
Process summary shows memtier_benchmark as the primary driver process.
971 processes
	255 memtier_benchma      32375.71 83025.09
	240 mc-worker            19305.92 97636.80
	 30 memcached             1206.62  6102.30
	 15 mc-assocmaint         1206.62  6102.30
	 15 mc-itemcrawler        1206.62  6102.30
	 15 mc-log                1206.62  6102.30
	 15 mc-lrumaint           1206.62  6102.30
	 15 mc-slabmaint          1206.62  6102.30
	 68 clinfo                  16.22     6.33
	 38 vulkaninfo               1.33     1.15
	  4 vulkani:disk$0           0.14     0.12
	  6 php                      0.08     0.24
	  2 llvmpipe-0               0.07     0.06
	  2 llvmpipe-1               0.07     0.06
	  2 llvmpipe-10              0.07     0.06
	  2 llvmpipe-11              0.07     0.06
	  2 llvmpipe-12              0.07     0.06
	  2 llvmpipe-13              0.07     0.06
	  2 llvmpipe-14              0.07     0.06
	  2 llvmpipe-15              0.07     0.06
	  2 llvmpipe-2               0.07     0.06
	  2 llvmpipe-3               0.07     0.06
	  2 llvmpipe-4               0.07     0.06
	  2 llvmpipe-5               0.07     0.06
	  2 llvmpipe-6               0.07     0.06
	  2 llvmpipe-7               0.07     0.06
	  2 llvmpipe-8               0.07     0.06
	  2 llvmpipe-9               0.07     0.06
	  6 glxinfo:gdrv0            0.06     0.12
	  6 glxinfo:gl0              0.06     0.12
	  6 clang                    0.06     0.06
	  2 glxinfo                  0.04     0.05
	  2 glxinfo:cs0              0.04     0.05
	  2 glxinfo:disk$0           0.04     0.05
	  2 glxinfo:sh0              0.04     0.04
	  2 glxinfo:shlo0            0.04     0.04
	  1 lspci                    0.01     0.01
	  3 rocminfo                 0.00     0.03
	  1 ps                       0.00     0.01
	 90 sh                       0.00     0.00
	 15 sleep                    0.00     0.00
	 13 gcc                      0.00     0.00
	  8 stat                     0.00     0.00
	  8 systemd-detect-          0.00     0.00
	  7 gsettings                0.00     0.00
	  6 llvm-link                0.00     0.00
	  5 gmain                    0.00     0.00
	  5 phoronix-test-s          0.00     0.00
	  4 dconf worker             0.00     0.00
	  2 cc                       0.00     0.00
	  2 lscpu                    0.00     0.00
	  2 uname                    0.00     0.00
	  2 which                    0.00     0.00
	  2 xset                     0.00     0.00
	  1 date                     0.00     0.00
	  1 dirname                  0.00     0.00
	  1 dmesg                    0.00     0.00
	  1 dmidecode                0.00     0.00
	  1 grep                     0.00     0.00
	  1 ifconfig                 0.00     0.00
	  1 ip                       0.00     0.00
	  1 lsmod                    0.00     0.00
	  1 mktemp                   0.00     0.00
	  1 qdbus                    0.00     0.00
	  1 readlink                 0.00     0.00
	  1 realpath                 0.00     0.00
	  1 sed                      0.00     0.00
	  1 sort                     0.00     0.00
	  1 stty                     0.00     0.00
	  1 systemctl                0.00     0.00
	  1 template.sh              0.00     0.00
	  1 wc                       0.00     0.00
	  1 xrandr                   0.00     0.00
0 processes running
49 maximum processes
Process summary shows a collection of worker threads started on each core and then a set of benchmark threads started six seconds later.
      988848) memcached        cpu=12 start=5.73  finish=71.75
        988849) memcached        cpu=15 start=5.73  finish=72.03
          988851) mc-log           cpu=2 start=5.74  finish=72.03
          988852) mc-worker        cpu=8 start=5.76  finish=72.03
          988853) mc-worker        cpu=13 start=5.76  finish=72.03
          988854) mc-worker        cpu=0 start=5.76  finish=72.03
          988855) mc-worker        cpu=3 start=5.76  finish=72.03
          988856) mc-worker        cpu=9 start=5.76  finish=72.03
          988857) mc-worker        cpu=14 start=5.76  finish=72.03
          988858) mc-worker        cpu=10 start=5.76  finish=72.03
          988859) mc-worker        cpu=4 start=5.76  finish=72.03
          988860) mc-worker        cpu=5 start=5.76  finish=72.03
          988861) mc-worker        cpu=12 start=5.76  finish=72.03
          988862) mc-worker        cpu=10 start=5.76  finish=72.03
          988863) mc-worker        cpu=7 start=5.76  finish=72.03
          988864) mc-worker        cpu=11 start=5.76  finish=72.03
          988865) mc-worker        cpu=6 start=5.76  finish=72.03
          988866) mc-worker        cpu=7 start=5.76  finish=72.03
          988867) mc-worker        cpu=1 start=5.76  finish=72.03
          988868) mc-assocmaint    cpu=1 start=5.76  finish=72.03
          988869) mc-itemcrawler   cpu=15 start=5.76  finish=72.03
          988870) mc-lrumaint      cpu=3 start=5.76  finish=72.03
          988871) mc-slabmaint     cpu=5 start=5.76  finish=72.03
        988850) sleep            cpu=15 start=5.73  finish=11.73
        988872) memtier_benchma  cpu=12 start=11.74 finish=71.75
          988873) memtier_benchma  cpu=11 start=11.74 finish=71.74
          988874) memtier_benchma  cpu=15 start=11.74 finish=71.74
          988875) memtier_benchma  cpu=1 start=11.74 finish=71.74
          988876) memtier_benchma  cpu=15 start=11.74 finish=71.74
          988877) memtier_benchma  cpu=5 start=11.74 finish=71.74
          988878) memtier_benchma  cpu=1 start=11.74 finish=71.74
          988879) memtier_benchma  cpu=13 start=11.74 finish=71.74
          988880) memtier_benchma  cpu=9 start=11.74 finish=71.74
          988881) memtier_benchma  cpu=12 start=11.74 finish=71.74
          988882) memtier_benchma  cpu=8 start=11.74 finish=71.74
          988883) memtier_benchma  cpu=13 start=11.74 finish=71.74
          988884) memtier_benchma  cpu=14 start=11.74 finish=71.74
          988885) memtier_benchma  cpu=5 start=11.74 finish=71.74
          988886) memtier_benchma  cpu=0 start=11.74 finish=71.74
          988887) memtier_benchma  cpu=6 start=11.74 finish=71.74
          988888) memtier_benchma  cpu=10 start=11.74 finish=71.74