
This is a benchmark for the Bristol University Docking Engine. A very flat profile with almost 0% time spent in front-end misses and very low L2 access and as a result high average GHz. The time bottleneck seems to be backend CPU cycles at least on AMD.
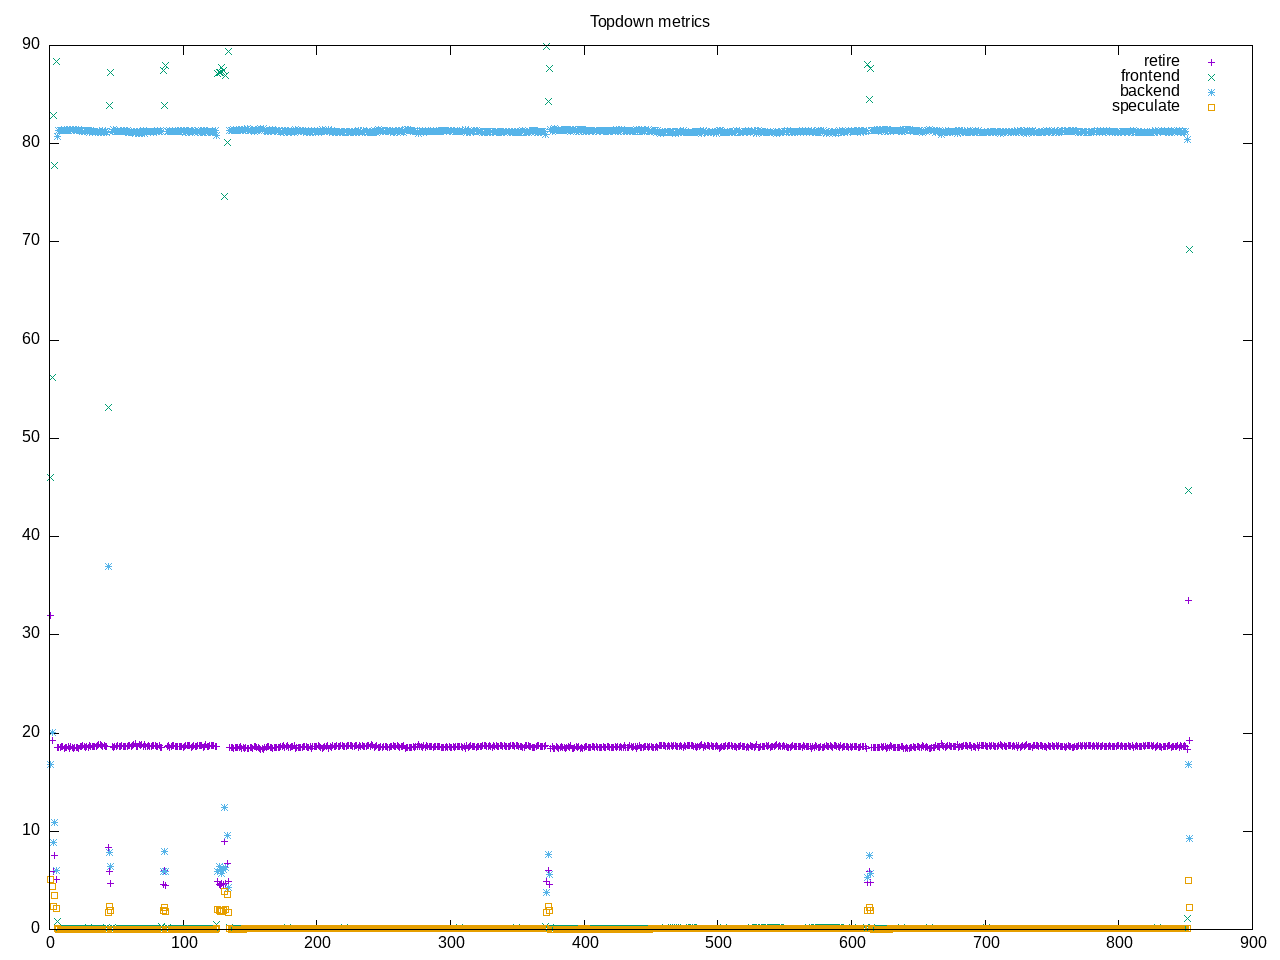
AMD metrics. The amount of frontend time is surprisingly low (0.1%), the backend CPU is higher than average. This is a floating point code that does much better on my AMD processor than Intel processor.
elapsed              860.823
on_cpu               0.959          # 15.34 / 16 cores
utime                13199.154
stime                4.191
nvcsw                3153           # 1.55%
nivcsw               200170         # 98.45%
inblock              9416           # 10.94/sec
onblock              1472           # 1.71/sec
cpu-clock            13203663272263 # 13203.663 seconds
task-clock           13203751860729 # 13203.752 seconds
page faults          149139         # 11.295/sec
context switches     207434         # 15.710/sec
cpu migrations       327            # 0.025/sec
major page faults    9              # 0.001/sec
minor page faults    149130         # 11.295/sec
alignment faults     0              # 0.000/sec
emulation faults     0              # 0.000/sec
branches             1812286189855  # 36.357 branches per 1000 inst
branch misses        3373308787     # 0.19% branch miss
conditional          1736412032224  # 34.835 conditional branches per 1000 inst
indirect             347384335      # 0.007 indirect branches per 1000 inst
cpu-cycles           56442460721050 # 4.11 GHz
instructions         49855526461212 # 0.88 IPC
slots                112896497428296 #
retiring             16597169840414 # 14.7% (18.6%)
-- ucode             182636319      #     0.0%
-- fastpath          16596987204095 #    14.7%
frontend             133841423134   #  0.1% ( 0.1%)
-- latency           103818842496   #     0.1%
-- bandwidth         30022580638    #     0.0%
backend              72647925519692 # 64.3% (81.2%)
-- cpu               72220434205857 #    64.0%
-- memory            427491313835   #     0.4%
speculation          52940901992    #  0.0% ( 0.1%)
-- branch mispredict 52901934851    #     0.0%
-- pipeline restart  38967141       #     0.0%
smt-contention       23464406142871 # 20.8% ( 0.0%)
cpu-cycles           56319475365345 # 4.12 GHz
instructions         49846507153415 # 0.89 IPC
instructions         16619408448807 # 0.564 l2 access per 1000 inst
l2 hit from l1       8974505532     # 0.41% l2 miss
l2 miss from l1      25839841       #
l2 hit from l2 pf    387375438      #
l3 hit from l2 pf    8204553        #
l3 miss from l2 pf   4449609        #
instructions         16612896802749 # 90.745 float per 1000 inst
float 512            79             # 0.000 AVX-512 per 1000 inst
float 256            1115000285842  # 67.117 AVX-256 per 1000 inst
float 128            392531488237   # 23.628 AVX-128 per 1000 inst
float MMX            0              # 0.000 MMX per 1000 inst
float scalar         0              # 0.000 scalar per 1000 inst
Intel metrics. Somewhat of a contrast including more frontend latency and a lower IPC. It would be interesting to see the mix of floating point. The on-core amount is also less.
elapsed              2532.034
on_cpu               0.768          # 12.29 / 16 cores
utime                31128.271
stime                1.284
nvcsw                23228          # 10.24%
nivcsw               203670         # 89.76%
inblock              9776           # 3.86/sec
onblock              1464           # 0.58/sec
cpu-clock            31128499474749 # 31128.499 seconds
task-clock           31128588659384 # 31128.589 seconds
page faults          144833         # 4.653/sec
context switches     239360         # 7.689/sec
cpu migrations       31310          # 1.006/sec
major page faults    62             # 0.002/sec
minor page faults    144770         # 4.651/sec
alignment faults     0              # 0.000/sec
emulation faults     0              # 0.000/sec
branches             2938735691997  # 29.701 branches per 1000 inst
branch misses        63751468128    # 2.17% branch miss
conditional          2938735707069  # 29.701 conditional branches per 1000 inst
indirect             702385471417   # 7.099 indirect branches per 1000 inst
slots                191258364400442 #
retiring             78324202863149 # 41.0% (41.0%)
-- ucode             9916757825840  #     5.2%
-- fastpath          68407445037309 #    35.8%
frontend             33150398566636 # 17.3% (17.3%)
-- latency           31618399330327 #    16.5%
-- bandwidth         1531999236309  #     0.8%
backend              76230829114597 # 39.9% (39.9%)
-- cpu               70409289474916 #    36.8%
-- memory            5821539639681  #     3.0%
speculation          3245583067706  #  1.7% ( 1.7%)
-- branch mispredict 3245437890649  #     1.7%
-- pipeline restart  145177057      #     0.0%
smt-contention       0              #  0.0% ( 0.0%)
cpu-cycles           104562031071524 # 2.59 GHz
instructions         140985466084116 # 1.35 IPC
l2 access            11979732638    # 0.167 l2 access per 1000 inst
l2 miss              263932623      # 2.20% l2 miss
Process structure is straighforward
454 processes
	 96 bude                 210888.16    15.80
	 64 clinfo                  11.20     4.48
	 38 vulkaninfo               0.76     1.14
	  6 glxinfo:gdrv0            0.11     0.05
	  4 vulkani:disk$0           0.08     0.12
	  6 php                      0.07     0.09
	  2 glxinfo                  0.06     0.03
	  2 glxinfo:cs0              0.06     0.03
	  2 glxinfo:disk$0           0.06     0.03
	  2 glxinfo:sh0              0.06     0.03
	  2 glxinfo:shlo0            0.06     0.03
	  2 llvmpipe-0               0.04     0.06
	  2 llvmpipe-1               0.04     0.06
	  2 llvmpipe-10              0.04     0.06
	  2 llvmpipe-11              0.04     0.06
	  2 llvmpipe-12              0.04     0.06
	  2 llvmpipe-13              0.04     0.06
	  2 llvmpipe-14              0.04     0.06
	  2 llvmpipe-15              0.04     0.06
	  2 llvmpipe-2               0.04     0.06
	  2 llvmpipe-3               0.04     0.06
	  2 llvmpipe-4               0.04     0.06
	  2 llvmpipe-5               0.04     0.06
	  2 llvmpipe-6               0.04     0.06
	  2 llvmpipe-7               0.04     0.06
	  2 llvmpipe-8               0.04     0.06
	  2 llvmpipe-9               0.04     0.06
	  6 clang                    0.04     0.05
	  1 lspci                    0.00     0.03
	 91 sh                       0.00     0.00
	 13 gcc                      0.00     0.00
	 11 gsettings                0.00     0.00
	  9 stty                     0.00     0.00
	  8 stat                     0.00     0.00
	  8 systemd-detect-          0.00     0.00
	  6 llvm-link                0.00     0.00
	  6 minibude                 0.00     0.00
	  5 phoronix-test-s          0.00     0.00
	  4 gmain                    0.00     0.00
	  2 cc                       0.00     0.00
	  2 lscpu                    0.00     0.00
	  2 uname                    0.00     0.00
	  2 which                    0.00     0.00
	  2 xset                     0.00     0.00
	  1 date                     0.00     0.00
	  1 dconf worker             0.00     0.00
	  1 dirname                  0.00     0.00
	  1 dmesg                    0.00     0.00
	  1 dmidecode                0.00     0.00
	  1 grep                     0.00     0.00
	  1 ifconfig                 0.00     0.00
	  1 ip                       0.00     0.00
	  1 lsmod                    0.00     0.00
	  1 mktemp                   0.00     0.00
	  1 ps                       0.00     0.00
	  1 qdbus                    0.00     0.00
	  1 readlink                 0.00     0.00
	  1 realpath                 0.00     0.00
	  1 sed                      0.00     0.00
	  1 sort                     0.00     0.00
	  1 systemctl                0.00     0.00
	  1 template.sh              0.00     0.00
	  1 wc                       0.00     0.00
	  1 xrandr                   0.00     0.00
0 processes running
47 maximum processes
The core parts start one on each core
      283675) minibude         cpu=6 start=46.75 finish=83.83
        283676) bude             cpu=10 start=46.75 finish=83.82
          283677) bude             cpu=2 start=46.76 finish=83.82
          283678) bude             cpu=3 start=46.76 finish=83.82
          283679) bude             cpu=4 start=46.76 finish=83.82
          283680) bude             cpu=9 start=46.76 finish=83.82
          283681) bude             cpu=0 start=46.76 finish=83.82
          283682) bude             cpu=5 start=46.76 finish=83.82
          283683) bude             cpu=6 start=46.76 finish=83.82
          283684) bude             cpu=1 start=46.76 finish=83.82
          283685) bude             cpu=11 start=46.76 finish=83.82
          283686) bude             cpu=12 start=46.76 finish=83.82
          283687) bude             cpu=8 start=46.76 finish=83.82
          283688) bude             cpu=9 start=46.76 finish=83.82
          283689) bude             cpu=13 start=46.76 finish=83.82
          283690) bude             cpu=14 start=46.76 finish=83.82
          283691) bude             cpu=7 start=46.76 finish=83.82