
MiniFE Finite Element is an application for unstructured finite element codes. There is a small, medium and large model. Only the small model runs on my 8GB Intel system or AMD 16 GB system. The large one fails quicker than the medium case.
Topdown profile shows backend stalls dominate and frontend stalls are also higher leaving a small retirement rate.
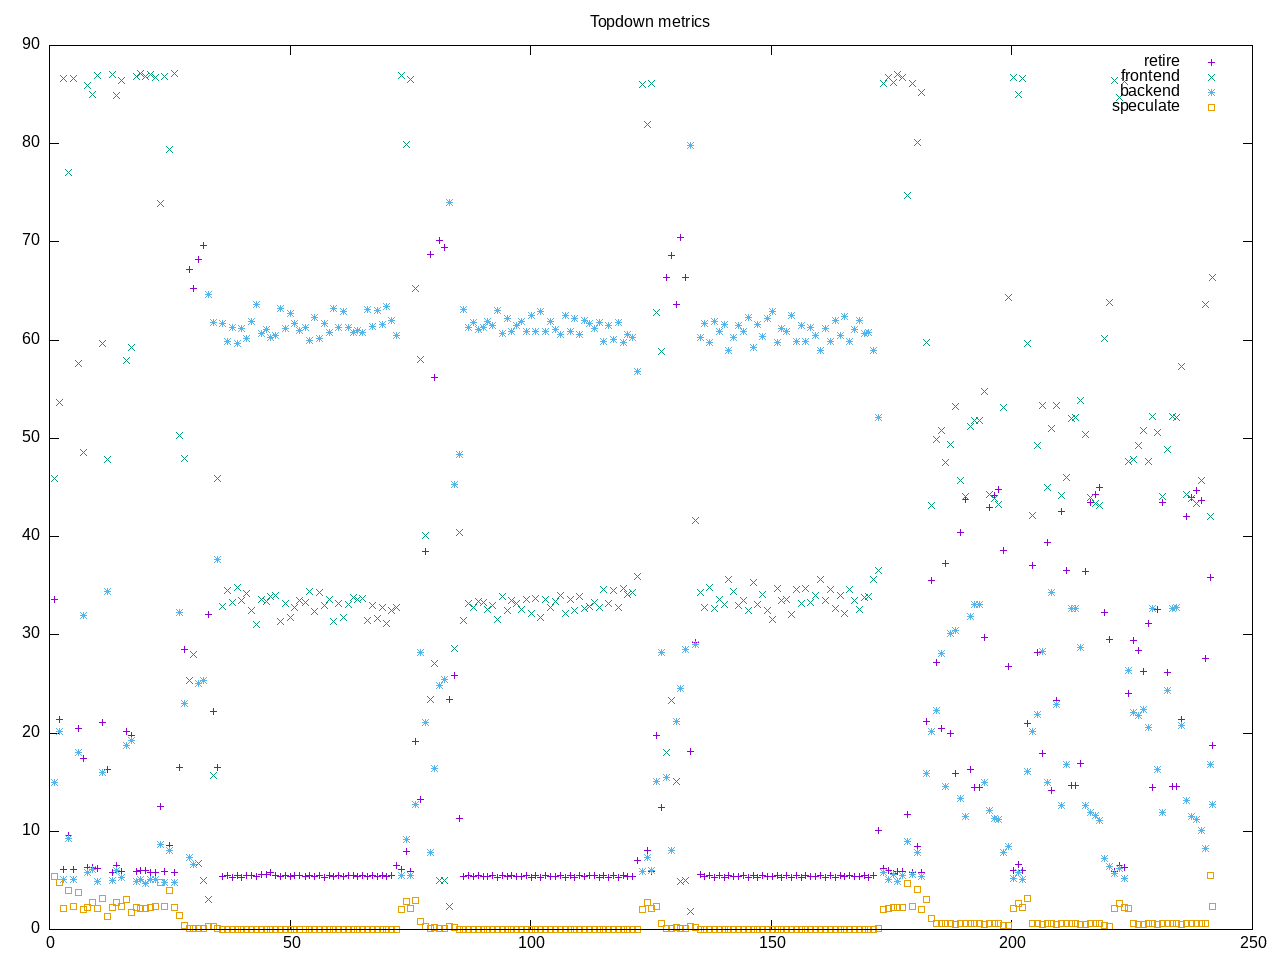
AMD metrics confirm a low 9% retirement rate. This is floating point code with a reasonable L2 miss rate.
elapsed              243.690
on_cpu               0.524          # 8.39 / 16 cores
utime                1993.160
stime                51.697
nvcsw                13870          # 46.17%
nivcsw               16171          # 53.83%
inblock              3344           # 13.72/sec
onblock              12608          # 51.74/sec
cpu-clock            2047157103380  # 2047.157 seconds
task-clock           2047257770017  # 2047.258 seconds
page faults          31046999       # 15165.164/sec
context switches     33542          # 16.384/sec
cpu migrations       971            # 0.474/sec
major page faults    720            # 0.352/sec
minor page faults    31046279       # 15164.812/sec
alignment faults     0              # 0.000/sec
emulation faults     0              # 0.000/sec
branches             706236278470   # 161.538 branches per 1000 inst
branch misses        5014293222     # 0.71% branch miss
conditional          641878405657   # 146.817 conditional branches per 1000 inst
indirect             2013712249     # 0.461 indirect branches per 1000 inst
cpu-cycles           9210992376881  # 2.38 GHz
instructions         4361725796880  # 0.47 IPC low
slots                18424742893032 #
retiring             1408820057528  #  7.6% ( 9.0%) low
-- ucode             2257470384     #     0.0%
-- fastpath          1406562587144  #     7.6%
frontend             5043746195655  # 27.4% (32.3%)
-- latency           4347570093138  #    23.6%
-- bandwidth         696176102517   #     3.8%
backend              9173912664192  # 49.8% (58.7%)
-- cpu               827799698650   #     4.5%
-- memory            8346112965542  #    45.3%
speculation          7079727654     #  0.0% ( 0.0%) low
-- branch mispredict 6974699002     #     0.0%
-- pipeline restart  105028652      #     0.0%
smt-contention       2791179374818  # 15.1% ( 0.0%)
cpu-cycles           9202270231305  # 2.38 GHz
instructions         4356300172549  # 0.47 IPC low
instructions         1452484540467  # 40.542 l2 access per 1000 inst
l2 hit from l1       36762046483    # 36.18% l2 miss
l2 miss from l1      2251102278     #
l2 hit from l2 pf    3068590825     #
l3 hit from l2 pf    61142096       #
l3 miss from l2 pf   18994133948    #
instructions         1454513550889  # 186.109 float per 1000 inst
float 512            91             # 0.000 AVX-512 per 1000 inst
float 256            624            # 0.000 AVX-256 per 1000 inst
float 128            270698676105   # 186.109 AVX-128 per 1000 inst
float MMX            0              # 0.000 MMX per 1000 inst
float scalar         2              # 0.000 scalar per 1000 inst
instructions         4359084815682  #
opcache              874086295911   # 200.521 opcache per 1000 inst
opcache miss         30119422719    #  3.4% opcache miss rate
l1 dTLB miss         1340796010     # 0.308 L1 dTLB per 1000 inst
l2 dTLB miss         1081626104     # 0.248 L2 dTLB per 1000 inst
instructions         4357779438705  #
icache               71313624570    # 16.365 icache per 1000 inst
icache miss          1458400180     #  2.0% icache miss rate
l1 iTLB miss         9490258        # 0.002 L1 iTLB per 1000 inst
l2 iTLB miss         0              # 0.000 L2 iTLB per 1000 inst
tlb flush            44877          # 0.000 TLB flush per 1000 inst
Intel metrics show 40% of the memory stalls are dram
elapsed              247.687
on_cpu               0.533          # 8.52 / 16 cores
utime                2075.936
stime                34.629
nvcsw                23274          # 59.55%
nivcsw               15812          # 40.45%
inblock              673936         # 2720.92/sec
onblock              1336           # 5.39/sec
cpu-clock            2111985298342  # 2111.985 seconds
task-clock           2112024687329  # 2112.025 seconds
page faults          23467689       # 11111.465/sec
context switches     48757          # 23.085/sec
cpu migrations       3111           # 1.473/sec
major page faults    12398          # 5.870/sec
minor page faults    23455288       # 11105.594/sec
alignment faults     0              # 0.000/sec
emulation faults     0              # 0.000/sec
branches             659038623656   # 157.161 branches per 1000 inst
branch misses        524366491      # 0.08% branch miss
conditional          659038641448   # 157.161 conditional branches per 1000 inst
indirect             208339155122   # 49.683 indirect branches per 1000 inst
slots                10368305007182 #
retiring             2669877911887  # 25.8% (25.8%)
-- ucode             222134393351   #     2.1%
-- fastpath          2447743518536  #    23.6%
frontend             1210078632156  # 11.7% (11.7%)
-- latency           859054106519   #     8.3%
-- bandwidth         351024525637   #     3.4%
backend              6892978942426  # 66.5% (66.5%)
-- cpu               2269699099109  #    21.9%
-- memory            4623279843317  #    44.6%
speculation          129944168269   #  1.3% ( 1.3%)
-- branch mispredict 104901134836   #     1.0%
-- pipeline restart  25043033433    #     0.2%
smt-contention       0              #  0.0% ( 0.0%)
cpu-cycles           14924883336483 # 1.80 GHz
instructions         10110279002150 # 0.68 IPC low
l2 access            178924470824   # 31.017 l2 access per 1000 inst
l2 miss              106730592575   # 59.65% l2 miss
cpu-cycles           3247227300486  # 60.2% memory latency
load stalls          1921815818188  #  0.0% l1 bound
l1 miss              1950070359204  #  8.5% l2 bound
l2 miss              1673267884336  # 11.9% l3 bound
l3 miss              1288195279271  # 39.7% dram bound
store_stalls         31750377590    #  1.0% store bound
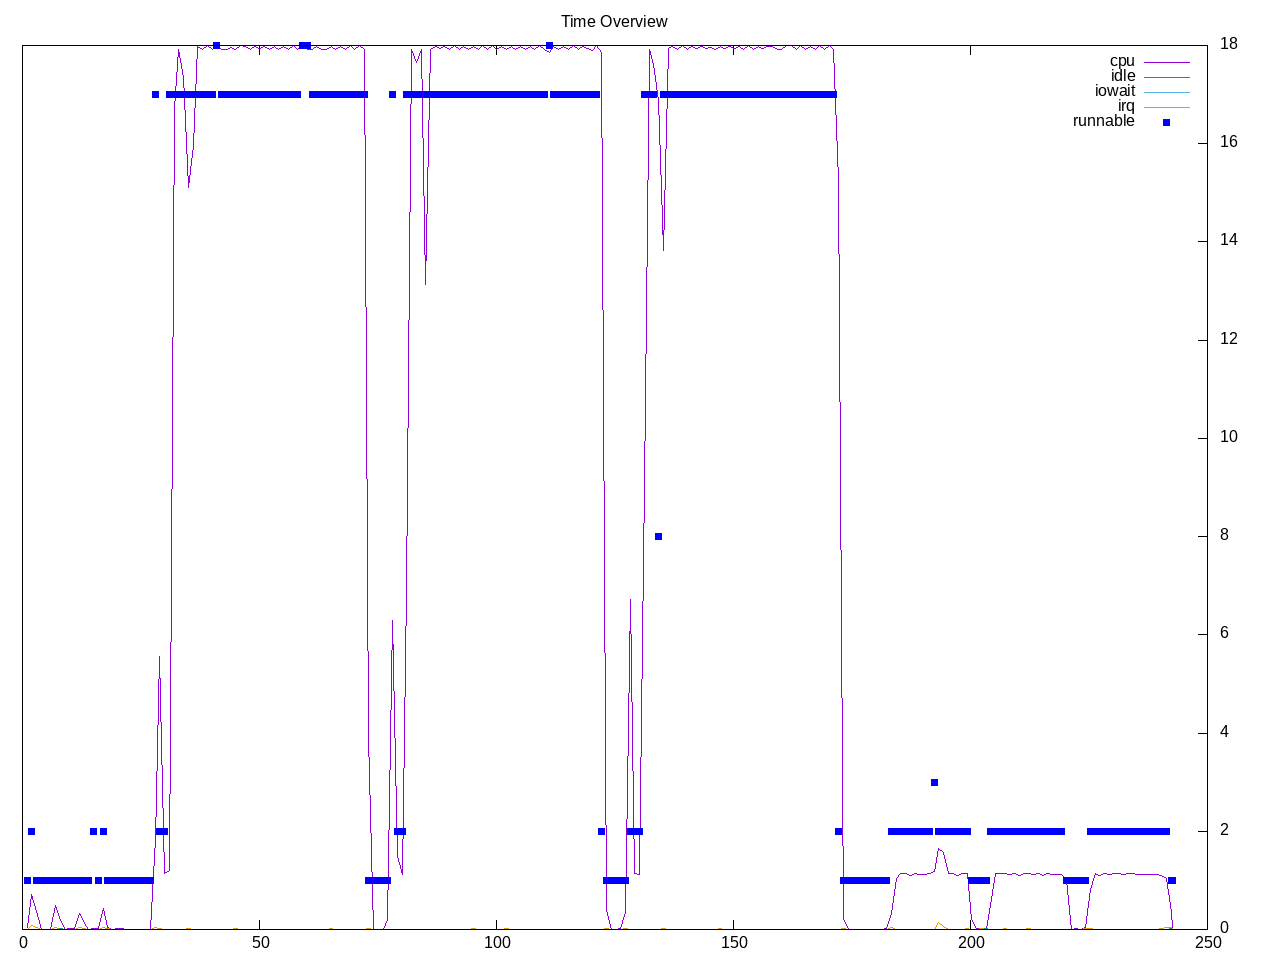
Process overview shows miniFE.x as the running process
591 processes
	180 miniFE.x             37870.42   922.58
	 68 clinfo                  16.87     5.89
	 54 orted                    2.29     5.33
	 38 vulkaninfo               1.71     0.95
	  4 vulkani:disk$0           0.18     0.10
	  6 php                      0.13     0.13
	  2 llvmpipe-0               0.09     0.05
	  2 llvmpipe-1               0.09     0.05
	  2 llvmpipe-10              0.09     0.05
	  2 llvmpipe-11              0.09     0.05
	  2 llvmpipe-12              0.09     0.05
	  2 llvmpipe-13              0.09     0.05
	  2 llvmpipe-14              0.09     0.05
	  2 llvmpipe-15              0.09     0.05
	  2 llvmpipe-2               0.09     0.05
	  2 llvmpipe-3               0.09     0.05
	  2 llvmpipe-4               0.09     0.05
	  2 llvmpipe-5               0.09     0.05
	  2 llvmpipe-6               0.09     0.05
	  2 llvmpipe-7               0.09     0.05
	  2 llvmpipe-8               0.09     0.05
	  2 llvmpipe-9               0.09     0.05
	  6 clang                    0.08     0.04
	  3 rocminfo                 0.03     0.00
	  1 lspci                    0.01     0.01
	  1 ps                       0.00     0.01
	 83 sh                       0.00     0.00
	 13 gcc                      0.00     0.00
	 11 gsettings                0.00     0.00
	  9 cat                      0.00     0.00
	  9 minife                   0.00     0.00
	  9 rm                       0.00     0.00
	  8 stat                     0.00     0.00
	  8 systemd-detect-          0.00     0.00
	  6 llvm-link                0.00     0.00
	  5 phoronix-test-s          0.00     0.00
	  4 glxinfo                  0.00     0.00
	  3 gmain                    0.00     0.00
	  2 cc                       0.00     0.00
	  2 dconf worker             0.00     0.00
	  2 lscpu                    0.00     0.00
	  2 setterm                  0.00     0.00
	  2 uname                    0.00     0.00
	  2 which                    0.00     0.00
	  1 date                     0.00     0.00
	  1 dirname                  0.00     0.00
	  1 dmesg                    0.00     0.00
	  1 dmidecode                0.00     0.00
	  1 grep                     0.00     0.00
	  1 ifconfig                 0.00     0.00
	  1 ip                       0.00     0.00
	  1 lsmod                    0.00     0.00
	  1 mktemp                   0.00     0.00
	  1 qdbus                    0.00     0.00
	  1 readlink                 0.00     0.00
	  1 realpath                 0.00     0.00
	  1 sed                      0.00     0.00
	  1 sort                     0.00     0.00
	  1 stty                     0.00     0.00
	  1 systemctl                0.00     0.00
	  1 template.sh              0.00     0.00
	  1 wc                       0.00     0.00
0 processes running
47 maximum processes
Computation blocks
      164783) minife           cpu=7 start=5.62  finish=6.45
        164784) rm               cpu=6 start=5.63  finish=5.63
        164785) miniFE.x         cpu=1 start=5.63  finish=6.43
          164786) orted            cpu=0 start=5.63  finish=6.46
            164789) orted            cpu=3 start=5.83  finish=6.46
            164790) orted            cpu=6 start=5.84  finish=5.84
            164791) orted            cpu=6 start=5.86  finish=6.45
            164792) orted            cpu=1 start=5.96  finish=6.45
            164793) orted            cpu=5 start=5.96  finish=6.46
          164794) miniFE.x         cpu=4 start=5.97  finish=6.43
          164795) miniFE.x         cpu=0 start=5.97  finish=6.43
          164798) miniFE.x         cpu=10 start=6.12  finish=6.43
          164799) miniFE.x         cpu=14 start=6.12  finish=6.12
          164800) miniFE.x         cpu=9 start=6.35  finish=6.42
          164801) miniFE.x         cpu=11 start=6.35  finish=6.42
          164802) miniFE.x         cpu=4 start=6.35  finish=6.42
          164803) miniFE.x         cpu=8 start=6.35  finish=6.42
          164804) miniFE.x         cpu=7 start=6.35  finish=6.42
          164805) miniFE.x         cpu=6 start=6.35  finish=6.42
          164806) miniFE.x         cpu=2 start=6.35  finish=6.42
          164807) miniFE.x         cpu=8 start=6.35  finish=6.42
          164808) miniFE.x         cpu=9 start=6.35  finish=6.42
          164809) miniFE.x         cpu=3 start=6.35  finish=6.42
          164810) miniFE.x         cpu=12 start=6.35  finish=6.42
          164811) miniFE.x         cpu=13 start=6.35  finish=6.42
          164812) miniFE.x         cpu=15 start=6.35  finish=6.42
          164813) miniFE.x         cpu=11 start=6.35  finish=6.42
          164814) miniFE.x         cpu=14 start=6.35  finish=6.42
        164816) cat              cpu=2 start=6.45  finish=6.45