
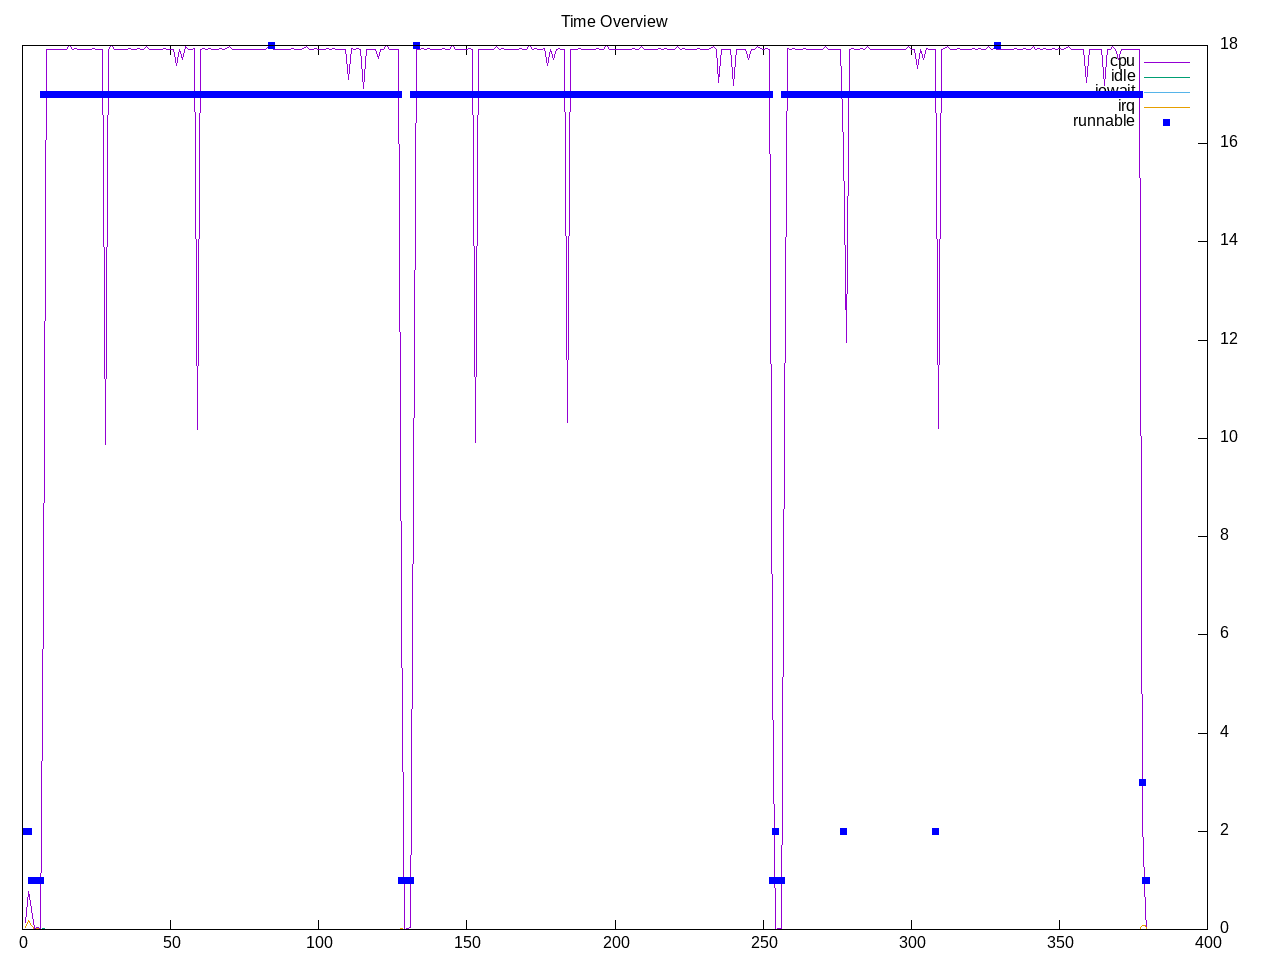
mnn is a neural network framework. This test tries eight different models and creates a geographic mean. The process overview suggests consistently spawning threads on all cores.
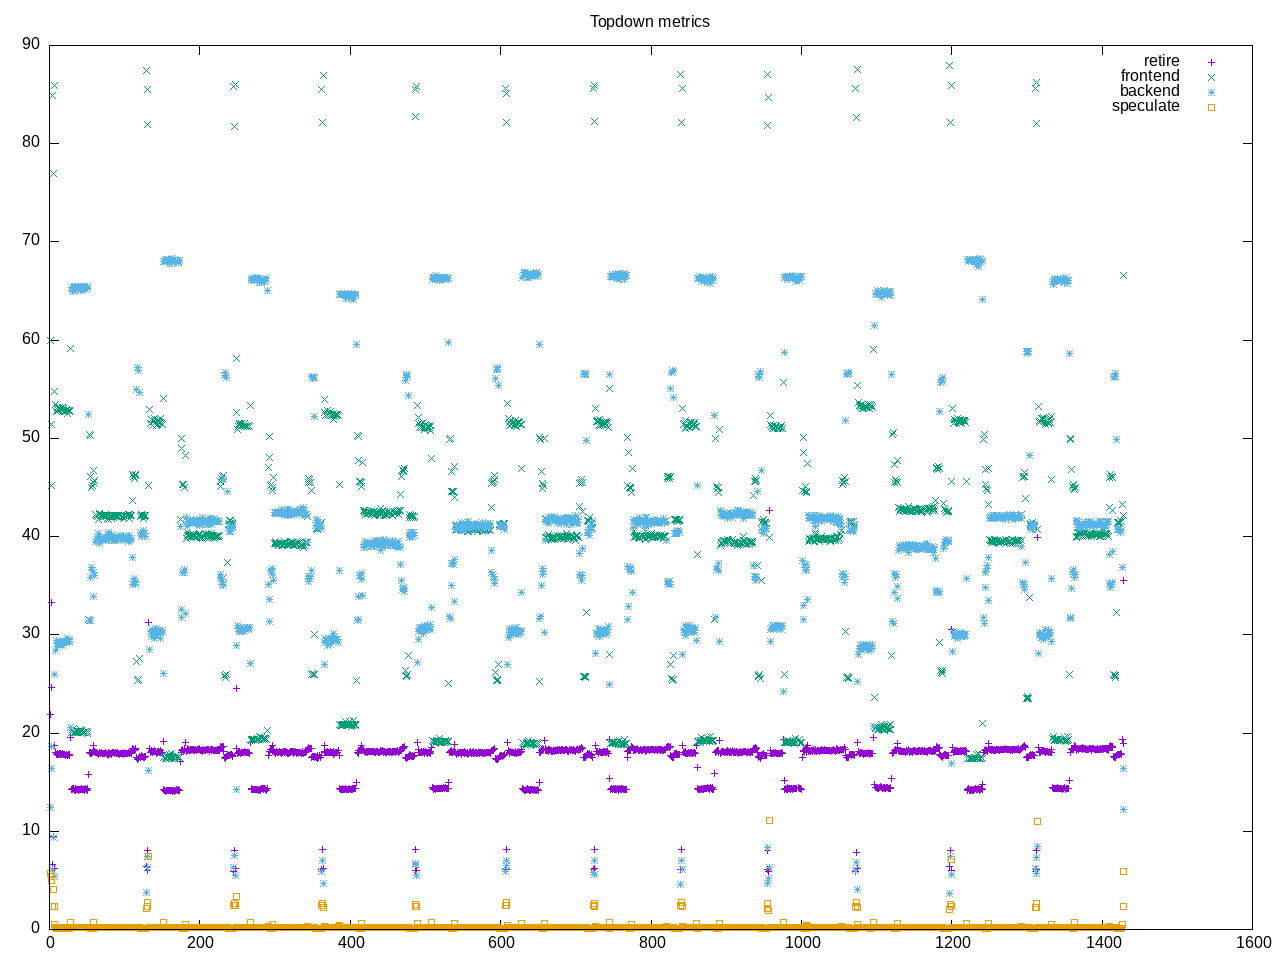
Topdown overview suggests certain phases of backend activity or frontend activity and a consistent retirement rate.
AMD metrics
elapsed              350.487
on_cpu               0.942          # 15.07 / 16 cores
utime                3132.874
stime                2147.667
nvcsw                2652           # 5.72%
nivcsw               43705          # 94.28%
inblock              8              # 0.02/sec
onblock              12752          # 36.38/sec
cpu-clock            5280985842856  # 5280.986 seconds
task-clock           5281014226031  # 5281.014 seconds
page faults          1210146        # 229.150/sec
context switches     47938          # 9.077/sec
cpu migrations       286            # 0.054/sec
major page faults    2              # 0.000/sec
minor page faults    1210144        # 229.150/sec
alignment faults     0              # 0.000/sec
emulation faults     0              # 0.000/sec
branches             2031821929040  # 120.505 branches per 1000 inst
branch misses        253888931138   # 12.50% branch miss
conditional          970120823455   # 57.537 conditional branches per 1000 inst
indirect             20899090234    # 1.239 indirect branches per 1000 inst
cpu-cycles           110973875070917 # 3.88 GHz
instructions         86300390156541 # 0.78 IPC
slots                221938347605922 #
retiring             32263730366925 # 14.5% (17.3%)
-- ucode             168671411473   #     0.1%
-- fastpath          32095058955452 #    14.5%
frontend             71461075367125 # 32.2% (38.2%)
-- latency           59166100322928 #    26.7%
-- bandwidth         12294975044197 #     5.5%
backend              82836224092829 # 37.3% (44.3%)
-- cpu               36711151611261 #    16.5%
-- memory            46125072481568 #    20.8%
speculation          366713033149   #  0.2% ( 0.2%)
-- branch mispredict 362656308286   #     0.2%
-- pipeline restart  4056724863     #     0.0%
smt-contention       35010489172413 # 15.8% ( 0.0%)
cpu-cycles           111531376124456 # 3.86 GHz
instructions         86619805970825 # 0.78 IPC
instructions         28881985494088 # 73.009 l2 access per 1000 inst
l2 hit from l1       1518505686348  # 21.90% l2 miss
l2 miss from l1      198514190460   #
l2 hit from l2 pf    326870900178   #
l3 hit from l2 pf    224827579693   #
l3 miss from l2 pf   38451066229    #
instructions         28860405033995 # 19.572 float per 1000 inst
float 512            54             # 0.000 AVX-512 per 1000 inst
float 256            658            # 0.000 AVX-256 per 1000 inst
float 128            564863466718   # 19.572 AVX-128 per 1000 inst
float MMX            0              # 0.000 MMX per 1000 inst
float scalar         1              # 0.000 scalar per 1000 inst
Intel metrics
elapsed              2678.159
on_cpu               0.975          # 15.59 / 16 cores
utime                25134.666
stime                16629.070
nvcsw                4543           # 0.15%
nivcsw               3013644        # 99.85%
inblock              1368           # 0.51/sec
onblock              1880           # 0.70/sec
cpu-clock            41764931327447 # 41764.931 seconds
task-clock           41765074209486 # 41765.074 seconds
page faults          4760326        # 113.979/sec
context switches     3031380        # 72.582/sec
cpu migrations       516            # 0.012/sec
major page faults    1              # 0.000/sec
minor page faults    4760325        # 113.979/sec
alignment faults     0              # 0.000/sec
emulation faults     0              # 0.000/sec
branches             19697851320338 # 108.948 branches per 1000 inst
branch misses        11220044229    # 0.06% branch miss
conditional          19697851339346 # 108.948 conditional branches per 1000 inst
indirect             5502668904687  # 30.435 indirect branches per 1000 inst
slots                46191558811640 #
retiring             26812914980896 # 58.0% (58.0%)
-- ucode             3186273037326  #     6.9%
-- fastpath          23626641943570 #    51.1%
frontend             12488108841259 # 27.0% (27.0%)
-- latency           7466005891595  #    16.2%
-- bandwidth         5022102949664  #    10.9%
backend              6407985278786  # 13.9% (13.9%)
-- cpu               2050555342763  #     4.4%
-- memory            4357429936023  #     9.4%
speculation          385626559145   #  0.8% ( 0.8%)
-- branch mispredict 263567987217   #     0.6%
-- pipeline restart  122058571928   #     0.3%
smt-contention       0              #  0.0% ( 0.0%)
cpu-cycles           70900703783603 # 1.63 GHz
instructions         116275737814803 # 1.64 IPC
l2 access            2953834438475  # 28.835 l2 access per 1000 inst
l2 miss              650131037736   # 22.01% l2 miss
Process overview shows the application is named benchmark.out
597 processes
	240 benchmark.out        255571.35 185286.88
	 68 clinfo                  18.83     7.01
	 38 vulkaninfo               1.32     1.33
	  6 glxinfo:gdrv0            0.22     0.04
	  6 php                      0.15     0.25
	  4 vulkani:disk$0           0.14     0.14
	  2 glxinfo                  0.10     0.02
	  2 glxinfo:cs0              0.10     0.02
	  2 glxinfo:disk$0           0.10     0.02
	  2 glxinfo:sh0              0.10     0.02
	  2 glxinfo:shlo0            0.10     0.02
	  2 llvmpipe-0               0.07     0.07
	  2 llvmpipe-1               0.07     0.07
	  2 llvmpipe-10              0.07     0.07
	  2 llvmpipe-11              0.07     0.07
	  2 llvmpipe-12              0.07     0.07
	  2 llvmpipe-13              0.07     0.07
	  2 llvmpipe-14              0.07     0.07
	  2 llvmpipe-15              0.07     0.07
	  2 llvmpipe-2               0.07     0.07
	  2 llvmpipe-3               0.07     0.07
	  2 llvmpipe-4               0.07     0.07
	  2 llvmpipe-5               0.07     0.07
	  2 llvmpipe-6               0.07     0.07
	  2 llvmpipe-7               0.07     0.07
	  2 llvmpipe-8               0.07     0.07
	  2 llvmpipe-9               0.07     0.07
	  6 clang                    0.06     0.06
	  3 rocminfo                 0.01     0.03
	  1 lspci                    0.00     0.02
	  1 ps                       0.00     0.01
	 82 sh                       0.00     0.00
	 15 mnn                      0.00     0.00
	 13 gcc                      0.00     0.00
	 11 gsettings                0.00     0.00
	  8 stat                     0.00     0.00
	  8 systemd-detect-          0.00     0.00
	  6 llvm-link                0.00     0.00
	  5 phoronix-test-s          0.00     0.00
	  3 gmain                    0.00     0.00
	  2 cc                       0.00     0.00
	  2 dconf worker             0.00     0.00
	  2 lscpu                    0.00     0.00
	  2 uname                    0.00     0.00
	  2 which                    0.00     0.00
	  2 xset                     0.00     0.00
	  1 date                     0.00     0.00
	  1 dirname                  0.00     0.00
	  1 dmesg                    0.00     0.00
	  1 dmidecode                0.00     0.00
	  1 grep                     0.00     0.00
	  1 ifconfig                 0.00     0.00
	  1 ip                       0.00     0.00
	  1 lsmod                    0.00     0.00
	  1 mktemp                   0.00     0.00
	  1 qdbus                    0.00     0.00
	  1 readlink                 0.00     0.00
	  1 realpath                 0.00     0.00
	  1 sed                      0.00     0.00
	  1 sort                     0.00     0.00
	  1 stty                     0.00     0.00
	  1 systemctl                0.00     0.00
	  1 template.sh              0.00     0.00
	  1 wc                       0.00     0.00
	  1 xrandr                   0.00     0.00
0 processes running
47 maximum processes
Core computation blocks
      12168) mnn              cpu=2 start=6.75  finish=128.36
        12169) benchmark.out    cpu=12 start=6.75  finish=128.35
          12170) benchmark.out    cpu=13 start=6.90  finish=128.35
          12171) benchmark.out    cpu=5 start=6.90  finish=128.35
          12172) benchmark.out    cpu=0 start=6.90  finish=128.35
          12173) benchmark.out    cpu=9 start=6.90  finish=128.35
          12174) benchmark.out    cpu=11 start=6.90  finish=128.35
          12175) benchmark.out    cpu=7 start=6.90  finish=128.35
          12176) benchmark.out    cpu=3 start=6.90  finish=128.35
          12177) benchmark.out    cpu=14 start=6.90  finish=128.35
          12178) benchmark.out    cpu=8 start=6.90  finish=128.35
          12179) benchmark.out    cpu=1 start=6.90  finish=128.35
          12180) benchmark.out    cpu=15 start=6.90  finish=128.35
          12181) benchmark.out    cpu=10 start=6.90  finish=128.35
          12182) benchmark.out    cpu=4 start=6.90  finish=128.35
          12183) benchmark.out    cpu=2 start=6.90  finish=128.35
          12184) benchmark.out    cpu=14 start=6.90  finish=128.35