
A multi-threaded DGEMM benchmark. This reports one score with a GLOP/s rate. As the name implies this runs on all the core. There are many separate runs underneath but not sure what size GEMMs are being tested though the process is invoked with “./mtdgemm 3072 4”
Topdown profile shows almost entirely memory bound program.
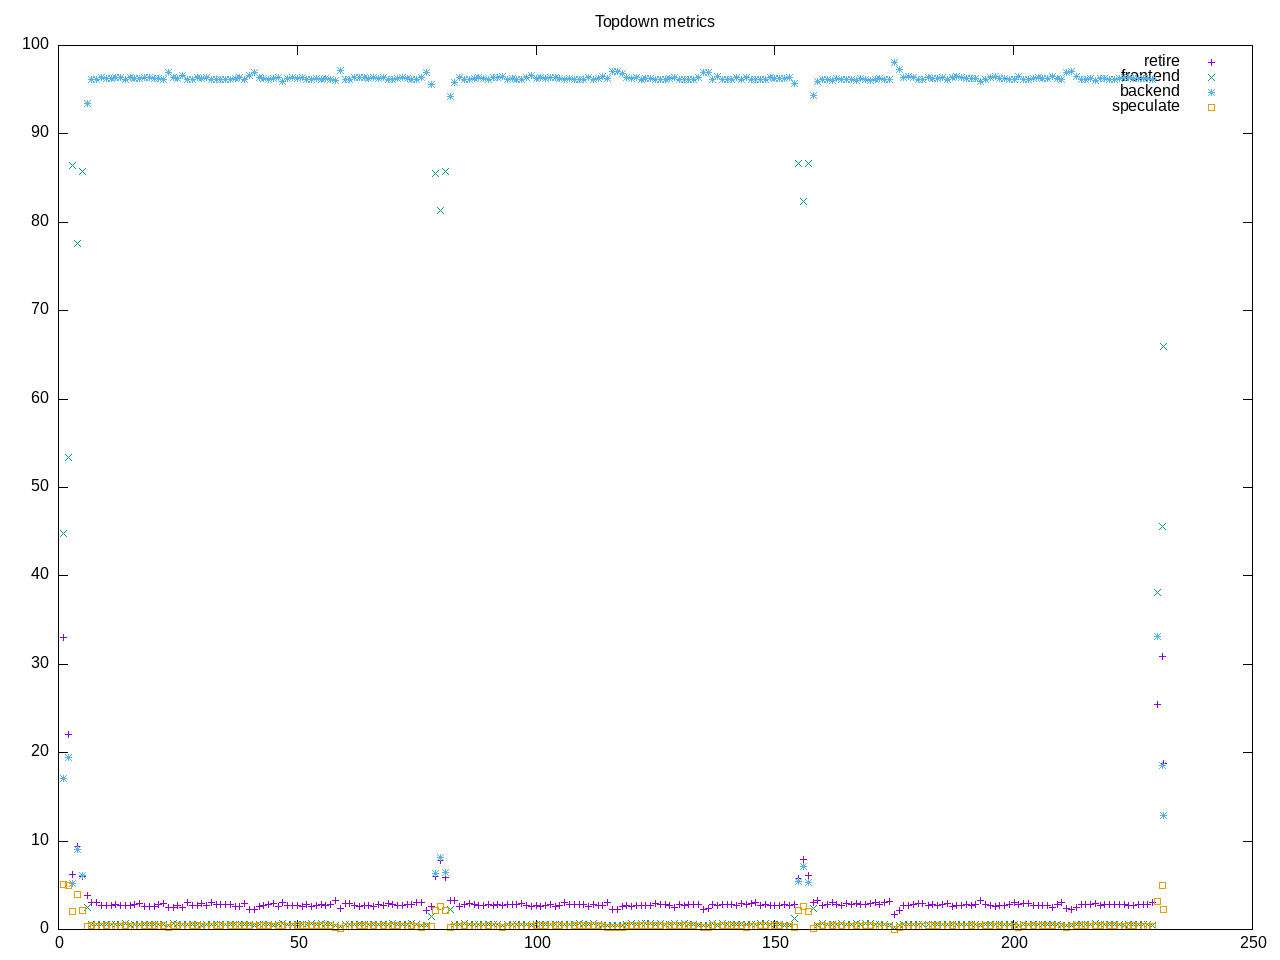
AMD metrics confirm floating point, very low retirement rate and high backend memory stalls.
elapsed              236.762
on_cpu               0.814          # 13.02 / 16 cores
utime                3082.168
stime                1.545
nvcsw                2176           # 6.99%
nivcsw               28943          # 93.01%
inblock              0              # 0.00/sec
onblock              12568          # 53.08/sec
cpu-clock            3084227120940  # 3084.227 seconds
task-clock           3084245086573  # 3084.245 seconds
page faults          313289         # 101.577/sec
context switches     32134          # 10.419/sec
cpu migrations       344            # 0.112/sec
major page faults    2              # 0.001/sec
minor page faults    313287         # 101.577/sec
alignment faults     0              # 0.000/sec
emulation faults     0              # 0.000/sec
branches             351139025627   # 143.215 branches per 1000 inst
branch misses        320886189      # 0.09% branch miss
conditional          349858597521   # 142.692 conditional branches per 1000 inst
indirect             53554288       # 0.022 indirect branches per 1000 inst
cpu-cycles           13433029028472 # 3.62 GHz
instructions         2454061328682  # 0.18 IPC low
slots                26852113381386 #
retiring             702637987249   #  2.6% ( 2.8%) low
-- ucode             48563383       #     0.0%
-- fastpath          702589423866   #     2.6%
frontend             164843205984   #  0.6% ( 0.6%) low
-- latency           130868974098   #     0.5%
-- bandwidth         33974231886    #     0.1%
backend              24525712173385 # 91.3% (96.2%) high
-- cpu               1884899227506  #     7.0%
-- memory            22640812945879 #    84.3%
speculation          91876384132    #  0.3% ( 0.4%) low
-- branch mispredict 12856371210    #     0.0%
-- pipeline restart  79020012922    #     0.3%
smt-contention       1367029251075  #  5.1% ( 0.0%)
cpu-cycles           13306883314532 # 3.60 GHz
instructions         2453753385490  # 0.18 IPC low
instructions         817406031890   # 448.524 l2 access per 1000 inst
l2 hit from l1       231006146862   # 36.78% l2 miss
l2 miss from l1      79974047304    #
l2 hit from l2 pf    80741481294    #
l3 hit from l2 pf    43129765140    #
l3 miss from l2 pf   11748482860    #
instructions         816967728215   # 141.991 float per 1000 inst
float 512            68             # 0.000 AVX-512 per 1000 inst
float 256            660            # 0.000 AVX-256 per 1000 inst
float 128            116002191550   # 141.991 AVX-128 per 1000 inst
float MMX            0              # 0.000 MMX per 1000 inst
float scalar         0              # 0.000 scalar per 1000 inst
instructions         2667710        #
opcache              992627         # 372.090 opcache per 1000 inst
opcache miss         530181         # 53.4% opcache miss rate
l1 dTLB miss         5737           # 2.151 L1 dTLB per 1000 inst
l2 dTLB miss         1200           # 0.450 L2 dTLB per 1000 inst
instructions         2679046        #
icache               1285981        # 480.015 icache per 1000 inst
icache miss          108585         #  8.4% icache miss rate
l1 iTLB miss         17             # 0.006 L1 iTLB per 1000 inst
l2 iTLB miss         0              # 0.000 L2 iTLB per 1000 inst
tlb flush            20             # 0.007 TLB flush per 1000 inst
Intel metrics show the memory stalls as being mostly dram with L3 also contributing.
elapsed              492.592
on_cpu               0.833          # 13.33 / 16 cores
utime                6565.321
stime                1.594
nvcsw                2251           # 4.08%
nivcsw               52966          # 95.92%
inblock              952            # 1.93/sec
onblock              1376           # 2.79/sec
cpu-clock            6567284228049  # 6567.284 seconds
task-clock           6567309903417  # 6567.310 seconds
page faults          414015         # 63.042/sec
context switches     57503          # 8.756/sec
cpu migrations       454            # 0.069/sec
major page faults    6              # 0.001/sec
minor page faults    414009         # 63.041/sec
alignment faults     0              # 0.000/sec
emulation faults     0              # 0.000/sec
branches             583567246701   # 166.739 branches per 1000 inst
branch misses        213359226      # 0.04% branch miss
conditional          583567261165   # 166.739 conditional branches per 1000 inst
indirect             290449592779   # 82.988 indirect branches per 1000 inst
slots                17661678302474 #
retiring             932467763006   #  5.3% ( 5.3%) low
-- ucode             22575755190    #     0.1%
-- fastpath          909892007816   #     5.2%
frontend             814357561668   #  4.6% ( 4.6%) low
-- latency           751489672407   #     4.3%
-- bandwidth         62867889261    #     0.4%
backend              15954992298439 # 90.3% (90.3%) high
-- cpu               1423967208298  #     8.1%
-- memory            14531025090141 #    82.3%
speculation          22870782998    #  0.1% ( 0.1%) low
-- branch mispredict 9848240863     #     0.1%
-- pipeline restart  13022542135    #     0.1%
smt-contention       0              #  0.0% ( 0.0%)
cpu-cycles           30406891078350 # 1.27 GHz
instructions         5395127285156  # 0.18 IPC low
l2 access            1894511816359  # 361.071 l2 access per 1000 inst
l2 miss              1005343361487  # 53.07% l2 miss
cpu-cycles           5951947247518  # 91.0% memory latency
load stalls          5414382577033  #  2.8% l1 bound
l1 miss              5248001289215  # 10.8% l2 bound
l2 miss              4606656595480  # 35.0% l3 bound
l3 miss              2523570196776  # 42.4% dram bound
store_stalls         449624468      #  0.0% store bound
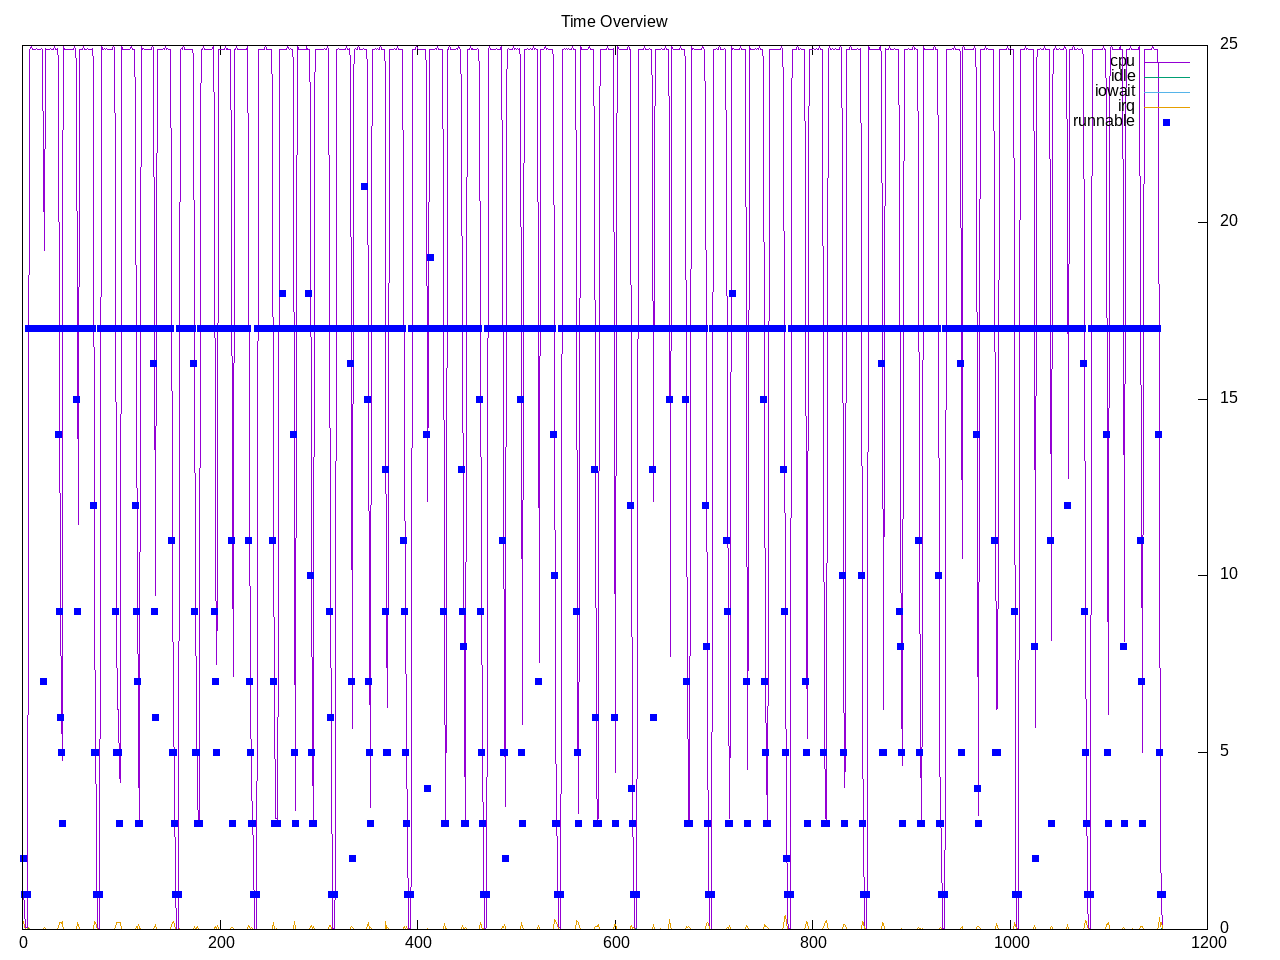
Process overview shows not too many mtdgemm calls
416 processes
	 64 mtdgemm              66452.80    15.04
	 68 clinfo                  16.86     5.99
	 38 vulkaninfo               1.14     1.15
	  4 vulkani:disk$0           0.12     0.13
	  6 php                      0.09     0.10
	  6 glxinfo:gdrv0            0.08     0.10
	  6 glxinfo:gl0              0.08     0.10
	  6 clang                    0.07     0.05
	  2 llvmpipe-0               0.06     0.07
	  2 llvmpipe-1               0.06     0.07
	  2 llvmpipe-10              0.06     0.07
	  2 llvmpipe-11              0.06     0.07
	  2 llvmpipe-12              0.06     0.07
	  2 llvmpipe-13              0.06     0.07
	  2 llvmpipe-14              0.06     0.07
	  2 llvmpipe-15              0.06     0.07
	  2 llvmpipe-2               0.06     0.07
	  2 llvmpipe-3               0.06     0.07
	  2 llvmpipe-4               0.06     0.07
	  2 llvmpipe-5               0.06     0.07
	  2 llvmpipe-6               0.06     0.07
	  2 llvmpipe-7               0.06     0.07
	  2 llvmpipe-8               0.06     0.07
	  2 llvmpipe-9               0.06     0.06
	  2 glxinfo                  0.04     0.04
	  2 glxinfo:cs0              0.04     0.04
	  2 glxinfo:disk$0           0.04     0.04
	  2 glxinfo:sh0              0.04     0.04
	  2 glxinfo:shlo0            0.04     0.04
	  1 lspci                    0.01     0.01
	  3 rocminfo                 0.00     0.01
	  1 ps                       0.00     0.01
	 82 sh                       0.00     0.00
	 13 gcc                      0.00     0.00
	 12 gsettings                0.00     0.00
	  8 stat                     0.00     0.00
	  8 systemd-detect-          0.00     0.00
	  6 llvm-link                0.00     0.00
	  5 phoronix-test-s          0.00     0.00
	  4 mt-dgemm                 0.00     0.00
	  3 gmain                    0.00     0.00
	  2 cc                       0.00     0.00
	  2 lscpu                    0.00     0.00
	  2 uname                    0.00     0.00
	  2 which                    0.00     0.00
	  2 xset                     0.00     0.00
	  1 date                     0.00     0.00
	  1 dconf worker             0.00     0.00
	  1 dirname                  0.00     0.00
	  1 dmesg                    0.00     0.00
	  1 dmidecode                0.00     0.00
	  1 grep                     0.00     0.00
	  1 ifconfig                 0.00     0.00
	  1 ip                       0.00     0.00
	  1 lsmod                    0.00     0.00
	  1 mktemp                   0.00     0.00
	  1 qdbus                    0.00     0.00
	  1 readlink                 0.00     0.00
	  1 realpath                 0.00     0.00
	  1 sed                      0.00     0.00
	  1 sort                     0.00     0.00
	  1 stty                     0.00     0.00
	  1 systemctl                0.00     0.00
	  1 template.sh              0.00     0.00
	  1 wc                       0.00     0.00
	  1 xrandr                   0.00     0.00
0 processes running
47 maximum processes
Computation blocks
      408399) mt-dgemm         cpu=3 start=5.61  finish=77.72
        408400) mtdgemm          cpu=0 start=5.61  finish=77.72
          408401) mtdgemm          cpu=8 start=5.61  finish=77.72
          408402) mtdgemm          cpu=9 start=5.61  finish=77.72
          408403) mtdgemm          cpu=1 start=5.61  finish=77.72
          408404) mtdgemm          cpu=2 start=5.61  finish=77.72
          408405) mtdgemm          cpu=10 start=5.61  finish=77.72
          408406) mtdgemm          cpu=11 start=5.61  finish=77.72
          408407) mtdgemm          cpu=3 start=5.61  finish=77.72
          408408) mtdgemm          cpu=4 start=5.61  finish=77.72
          408409) mtdgemm          cpu=12 start=5.61  finish=77.72
          408410) mtdgemm          cpu=13 start=5.61  finish=77.72
          408411) mtdgemm          cpu=5 start=5.61  finish=77.72
          408412) mtdgemm          cpu=6 start=5.61  finish=77.72
          408413) mtdgemm          cpu=14 start=5.61  finish=77.72
          408414) mtdgemm          cpu=7 start=5.61  finish=77.72
          408415) mtdgemm          cpu=15 start=5.61  finish=77.72