
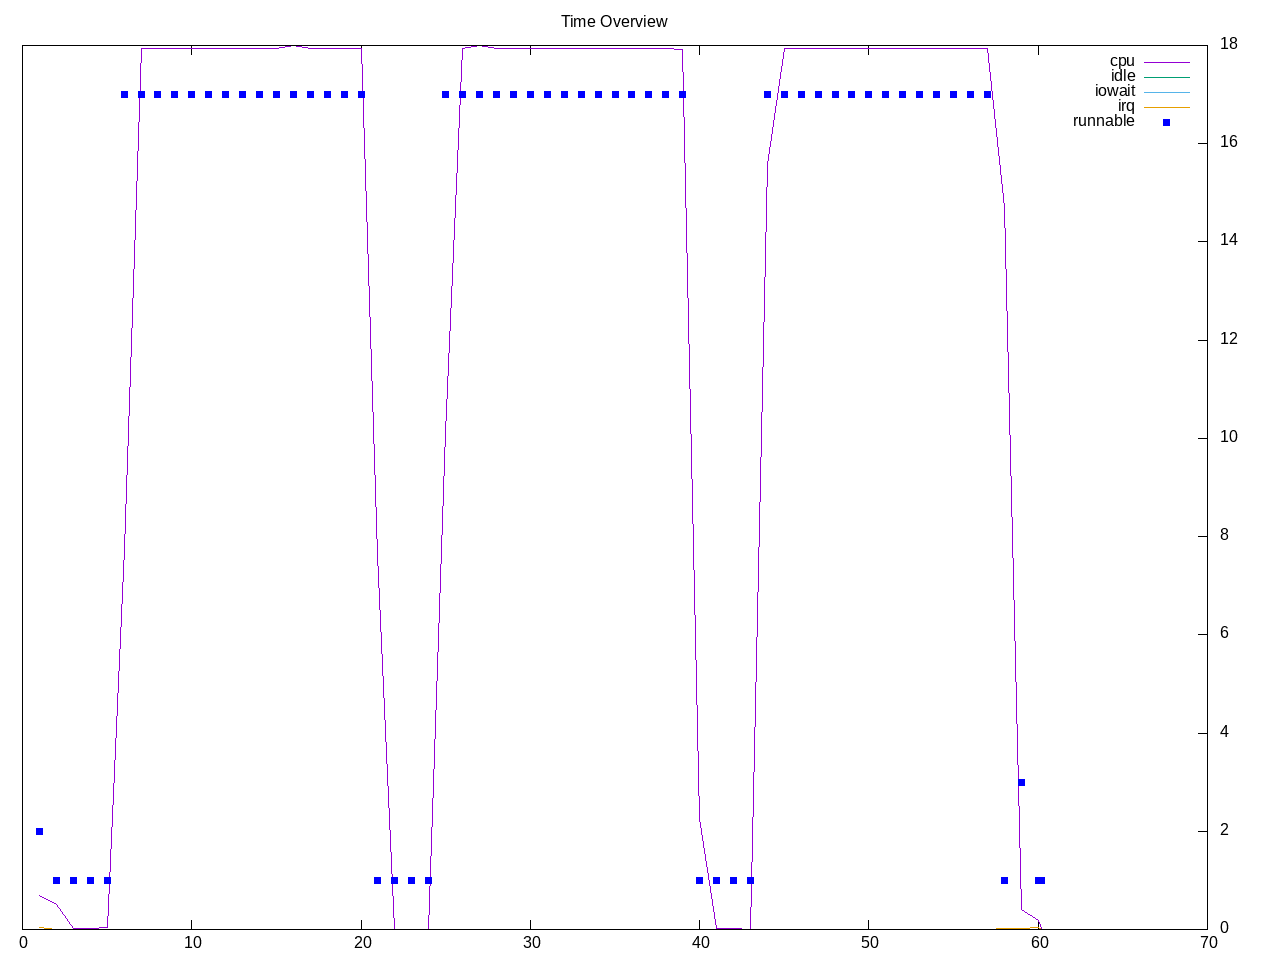
An OpenMP implementation of the n-queens problem. This is also the description of “m-queens” so we can see how they compare. This runs 4x as quick, though the board sizes may be different. This shows processes on each core.
Topdown profile shows a surprisingly high branch mispredict rate. Otherwise frontend stalls and retirement rate are similar.
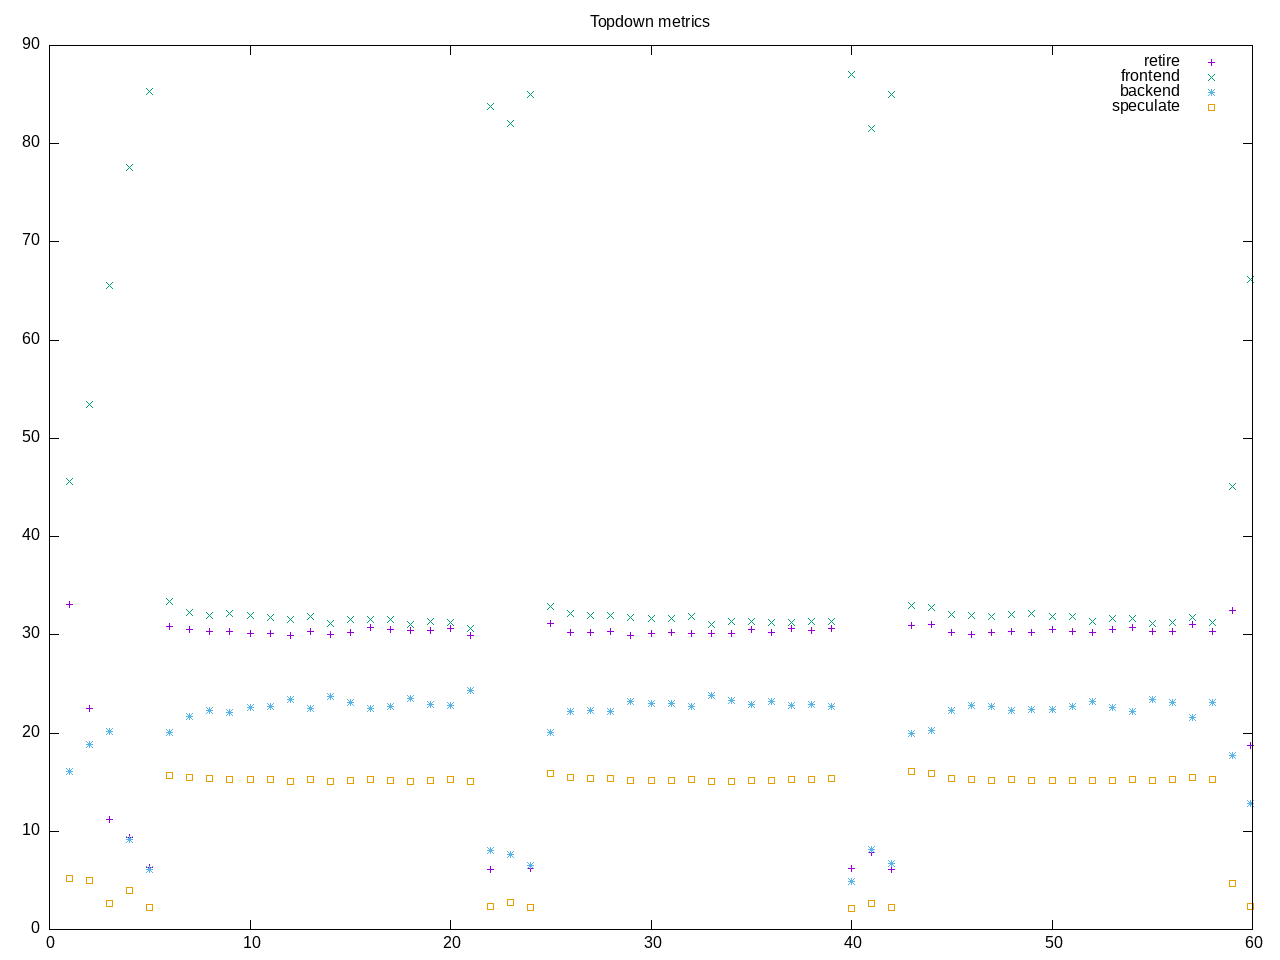
AMD metrics show many floating point instructions and very little L2 access.
elapsed              59.706
on_cpu               0.734          # 11.75 / 16 cores
utime                700.580
stime                0.941
nvcsw                1969           # 20.79%
nivcsw               7502           # 79.21%
inblock              0              # 0.00/sec
onblock              12560          # 210.36/sec
cpu-clock            701577930989   # 701.578 seconds
task-clock           701582852603   # 701.583 seconds
page faults          147260         # 209.897/sec
context switches     9598           # 13.680/sec
cpu migrations       266            # 0.379/sec
major page faults    2              # 0.003/sec
minor page faults    147258         # 209.894/sec
alignment faults     0              # 0.000/sec
emulation faults     0              # 0.000/sec
branches             358274822489   # 105.547 branches per 1000 inst
branch misses        53094091069    # 14.82% branch miss
conditional          268491549572   # 79.097 conditional branches per 1000 inst
indirect             47097724       # 0.014 indirect branches per 1000 inst
cpu-cycles           2910026096341  # 3.02 GHz
instructions         3393651570228  # 1.17 IPC
slots                5826052535754  #
retiring             1150107894282  # 19.7% (30.4%)
-- ucode             16366252       #     0.0%
-- fastpath          1150091528030  #    19.7%
frontend             1205152582022  # 20.7% (31.8%)
-- latency           1044472772652  #    17.9%
-- bandwidth         160679809370   #     2.8%
backend              855912736625   # 14.7% (22.6%)
-- cpu               295050537557   #     5.1%
-- memory            560862199068   #     9.6%
speculation          577782310149   #  9.9% (15.2%) high
-- branch mispredict 577772539962   #     9.9%
-- pipeline restart  9770187        #     0.0%
smt-contention       2037084896785  # 35.0% ( 0.0%)
cpu-cycles           2907871863146  # 3.04 GHz
instructions         3390883633345  # 1.17 IPC
instructions         1133281902047  # 0.121 l2 access per 1000 inst
l2 hit from l1       119341967      # 14.89% l2 miss
l2 miss from l1      11697818       #
l2 hit from l2 pf    8853005        #
l3 hit from l2 pf    4524968        #
l3 miss from l2 pf   4161961        #
instructions         1130949836740  # 209.890 float per 1000 inst
float 512            67             # 0.000 AVX-512 per 1000 inst
float 256            656            # 0.000 AVX-256 per 1000 inst
float 128            237375367252   # 209.890 AVX-128 per 1000 inst
float MMX            0              # 0.000 MMX per 1000 inst
float scalar         0              # 0.000 scalar per 1000 inst
Intel metrics
elapsed              205.379
on_cpu               0.810          # 12.96 / 16 cores
utime                2660.432
stime                0.462
nvcsw                1992           # 8.22%
nivcsw               22250          # 91.78%
inblock              8              # 0.04/sec
onblock              1456           # 7.09/sec
cpu-clock            2661041175202  # 2661.041 seconds
task-clock           2661049045772  # 2661.049 seconds
page faults          140831         # 52.923/sec
context switches     25082          # 9.426/sec
cpu migrations       258            # 0.097/sec
major page faults    0              # 0.000/sec
minor page faults    140831         # 52.923/sec
alignment faults     0              # 0.000/sec
emulation faults     0              # 0.000/sec
branches             803581484498   # 81.202 branches per 1000 inst
branch misses        164085751671   # 20.42% branch miss
conditional          803581501170   # 81.202 conditional branches per 1000 inst
indirect             209212950465   # 21.141 indirect branches per 1000 inst
slots                4783298033636  #
retiring             1671294828132  # 34.9% (34.9%)
-- ucode             94088025026    #     2.0%
-- fastpath          1577206803106  #    33.0%
frontend             560253074951   # 11.7% (11.7%)
-- latency           413909373463   #     8.7%
-- bandwidth         146343701488   #     3.1%
backend              344172623109   #  7.2% ( 7.2%) low
-- cpu               290550559133   #     6.1%
-- memory            53622063976    #     1.1%
speculation          2234265584235  # 46.7% (46.7%) high
-- branch mispredict 2234120655291  #    46.7%
-- pipeline restart  144928944      #     0.0%
smt-contention       0              #  0.0% ( 0.0%)
cpu-cycles           1725231955347  # 1.53 GHz
instructions         1873420941187  # 1.09 IPC
l2 access            271608413      # 0.157 l2 access per 1000 inst
l2 miss              82913103       # 30.53% l2 miss
Process overview
399 processes
	 48 qn24b_openmp         11241.12     0.16
	 68 clinfo                  16.52     5.99
	 38 vulkaninfo               1.13     1.15
	  4 vulkani:disk$0           0.12     0.12
	  6 glxinfo:gdrv0            0.08     0.09
	  6 glxinfo:gl0              0.08     0.09
	  6 php                      0.06     0.07
	  2 llvmpipe-0               0.06     0.06
	  2 llvmpipe-1               0.06     0.06
	  2 llvmpipe-10              0.06     0.06
	  2 llvmpipe-11              0.06     0.06
	  2 llvmpipe-12              0.06     0.06
	  2 llvmpipe-13              0.06     0.06
	  2 llvmpipe-14              0.06     0.06
	  2 llvmpipe-15              0.06     0.06
	  2 llvmpipe-2               0.06     0.06
	  2 llvmpipe-3               0.06     0.06
	  2 llvmpipe-4               0.06     0.06
	  2 llvmpipe-5               0.06     0.06
	  2 llvmpipe-6               0.06     0.06
	  2 llvmpipe-7               0.06     0.06
	  2 llvmpipe-8               0.06     0.06
	  2 llvmpipe-9               0.06     0.06
	  2 glxinfo                  0.05     0.04
	  6 clang                    0.04     0.08
	  2 glxinfo:cs0              0.04     0.03
	  2 glxinfo:disk$0           0.04     0.03
	  2 glxinfo:sh0              0.04     0.03
	  2 glxinfo:shlo0            0.04     0.03
	  3 rocminfo                 0.03     0.00
	  1 lspci                    0.00     0.03
	  1 ps                       0.00     0.01
	 82 sh                       0.00     0.00
	 13 gcc                      0.00     0.00
	 11 gsettings                0.00     0.00
	  8 stat                     0.00     0.00
	  8 systemd-detect-          0.00     0.00
	  6 llvm-link                0.00     0.00
	  5 phoronix-test-s          0.00     0.00
	  4 gmain                    0.00     0.00
	  3 n-queens                 0.00     0.00
	  2 cc                       0.00     0.00
	  2 lscpu                    0.00     0.00
	  2 uname                    0.00     0.00
	  2 which                    0.00     0.00
	  2 xset                     0.00     0.00
	  1 date                     0.00     0.00
	  1 dconf worker             0.00     0.00
	  1 dirname                  0.00     0.00
	  1 dmesg                    0.00     0.00
	  1 dmidecode                0.00     0.00
	  1 grep                     0.00     0.00
	  1 ifconfig                 0.00     0.00
	  1 ip                       0.00     0.00
	  1 lsmod                    0.00     0.00
	  1 mktemp                   0.00     0.00
	  1 qdbus                    0.00     0.00
	  1 readlink                 0.00     0.00
	  1 realpath                 0.00     0.00
	  1 sed                      0.00     0.00
	  1 sort                     0.00     0.00
	  1 stty                     0.00     0.00
	  1 systemctl                0.00     0.00
	  1 template.sh              0.00     0.00
	  1 wc                       0.00     0.00
	  1 xrandr                   0.00     0.00
0 processes running
47 maximum processes
Computation blocks
      112879) n-queens         cpu=4 start=5.65  finish=20.31
        112880) qn24b_openmp     cpu=12 start=5.65  finish=20.31
          112881) qn24b_openmp     cpu=8 start=5.65  finish=20.31
          112882) qn24b_openmp     cpu=15 start=5.65  finish=20.31
          112883) qn24b_openmp     cpu=10 start=5.65  finish=20.31
          112884) qn24b_openmp     cpu=1 start=5.65  finish=20.31
          112885) qn24b_openmp     cpu=3 start=5.65  finish=20.31
          112886) qn24b_openmp     cpu=5 start=5.65  finish=20.31
          112887) qn24b_openmp     cpu=4 start=5.66  finish=20.31
          112888) qn24b_openmp     cpu=6 start=5.66  finish=20.31
          112889) qn24b_openmp     cpu=13 start=5.66  finish=20.31
          112890) qn24b_openmp     cpu=0 start=5.66  finish=20.31
          112891) qn24b_openmp     cpu=2 start=5.66  finish=20.31
          112892) qn24b_openmp     cpu=9 start=5.66  finish=20.31
          112893) qn24b_openmp     cpu=7 start=5.66  finish=20.31
          112894) qn24b_openmp     cpu=11 start=5.66  finish=20.31
          112895) qn24b_openmp     cpu=14 start=5.66  finish=20.31