
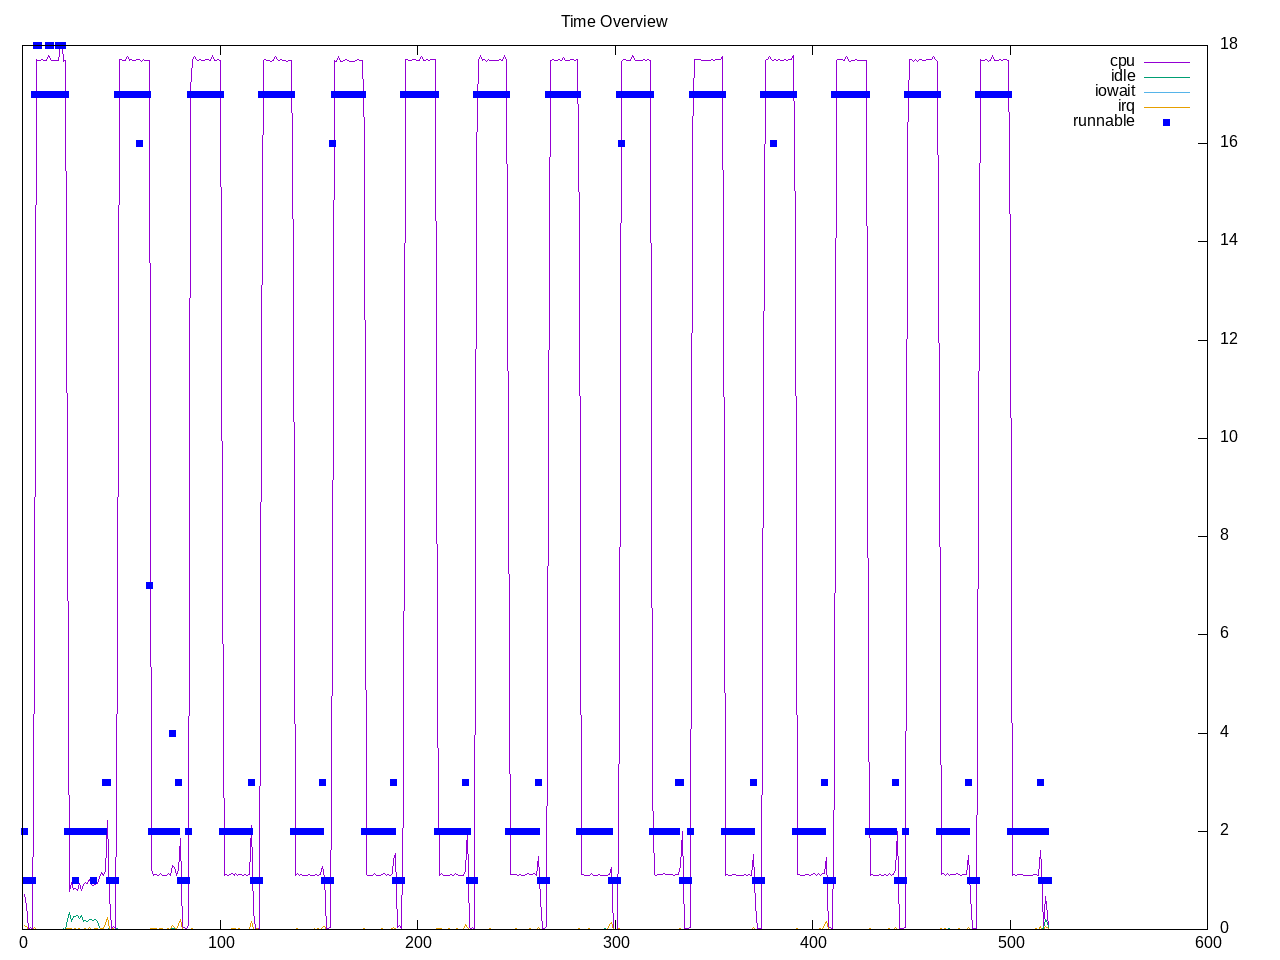
Nebular Empirical Analysis Tool. There is one test which runs in about 30 seconds. Look like it bounces between running single-threaded and on all cores. This fails to run on my Intel box returning in ~10 seconds with a non-zero exit status. Not clear from the test logs though I also notice some out-of-memory (OOM) events in /var/log/syslog.
Topdown profile suggests more backend stalls and low frontend stalls.
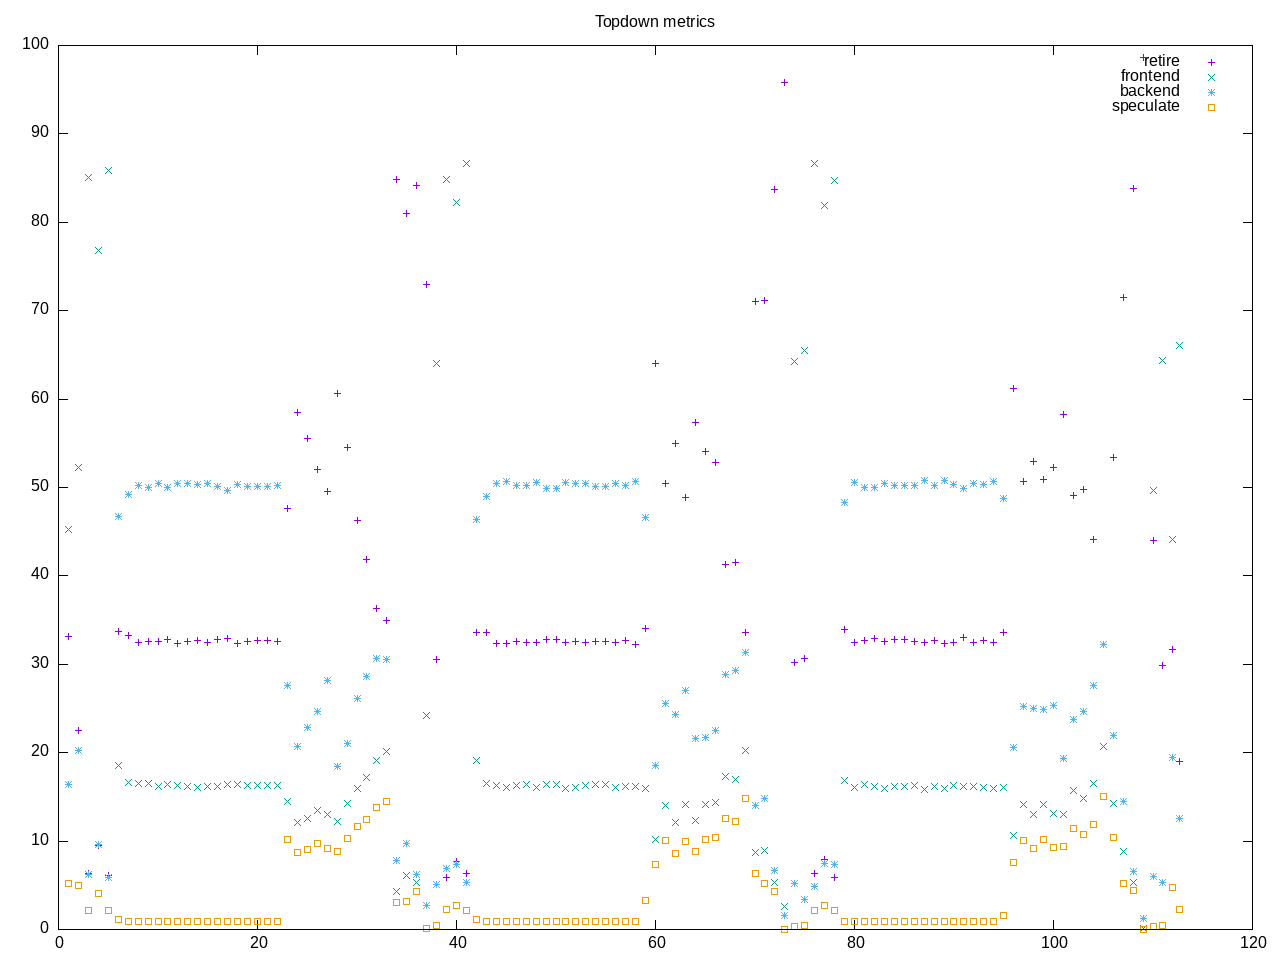
AMD metrics confirm the topdown nature of the workload.
elapsed              112.938
on_cpu               0.461          # 7.37 / 16 cores
utime                787.010
stime                45.727
nvcsw                79016          # 90.55%
nivcsw               8251           # 9.45%
inblock              33008          # 292.27/sec
onblock              13320          # 117.94/sec
cpu-clock            832926827655   # 832.927 seconds
task-clock           832962259010   # 832.962 seconds
page faults          19058360       # 22880.220/sec
context switches     87655          # 105.233/sec
cpu migrations       333            # 0.400/sec
major page faults    296            # 0.355/sec
minor page faults    19058064       # 22879.865/sec
alignment faults     0              # 0.000/sec
emulation faults     0              # 0.000/sec
branches             836781073100   # 157.534 branches per 1000 inst
branch misses        7786272785     # 0.93% branch miss
conditional          731949090194   # 137.798 conditional branches per 1000 inst
indirect             25034090579    # 4.713 indirect branches per 1000 inst
cpu-cycles           3294228431732  # 1.81 GHz
instructions         5301843834321  # 1.61 IPC
slots                6593246373414  #
retiring             1759327788324  # 26.7% (34.7%)
-- ucode             694038870      #     0.0%
-- fastpath          1758633749454  #    26.7%
frontend             827133220959   # 12.5% (16.3%)
-- latency           467093377584   #     7.1%
-- bandwidth         360039843375   #     5.5%
backend              2399471110050  # 36.4% (47.4%)
-- cpu               1671050799446  #    25.3%
-- memory            728420310604   #    11.0%
speculation          77017903018    #  1.2% ( 1.5%)
-- branch mispredict 75839031117    #     1.2%
-- pipeline restart  1178871901     #     0.0%
smt-contention       1530270612228  # 23.2% ( 0.0%)
cpu-cycles           3295802237397  # 1.82 GHz
instructions         5309014725494  # 1.61 IPC
instructions         1766553771091  # 34.525 l2 access per 1000 inst
l2 hit from l1       32425961726    # 11.15% l2 miss
l2 miss from l1      1878534951     #
l2 hit from l2 pf    23639853312    #
l3 hit from l2 pf    4162983178     #
l3 miss from l2 pf   761717911      #
instructions         1766957621853  # 251.625 float per 1000 inst
float 512            66             # 0.000 AVX-512 per 1000 inst
float 256            424            # 0.000 AVX-256 per 1000 inst
float 128            444610768510   # 251.625 AVX-128 per 1000 inst
float MMX            0              # 0.000 MMX per 1000 inst
float scalar         0              # 0.000 scalar per 1000 inst
instructions         5303189358253  #
opcache              743657481583   # 140.228 opcache per 1000 inst
opcache miss         24690402705    #  3.3% opcache miss rate
l1 dTLB miss         72370956534    # 13.647 L1 dTLB per 1000 inst
l2 dTLB miss         828723050      # 0.156 L2 dTLB per 1000 inst
instructions         5302796797585  #
icache               45850945138    # 8.647 icache per 1000 inst
icache miss          4587964436     # 10.0% icache miss rate
l1 iTLB miss         355368054      # 0.067 L1 iTLB per 1000 inst
l2 iTLB miss         0              # 0.000 L2 iTLB per 1000 inst
tlb flush            19286          # 0.000 TLB flush per 1000 inst
Intel metrics
Process overview shows the neat process taking most of the time.
399 processes
	 51 neat                 12603.04   643.04
	 68 clinfo                  18.20     4.57
	 38 vulkaninfo               1.12     1.50
	  4 vulkani:disk$0           0.12     0.15
	  6 glxinfo:gdrv0            0.10     0.08
	  6 glxinfo:gl0              0.10     0.08
	  6 php                      0.07     0.07
	  2 llvmpipe-0               0.06     0.08
	  2 llvmpipe-1               0.06     0.08
	  2 llvmpipe-10              0.06     0.08
	  2 llvmpipe-11              0.06     0.08
	  2 llvmpipe-12              0.06     0.08
	  2 llvmpipe-13              0.06     0.08
	  2 llvmpipe-14              0.06     0.08
	  2 llvmpipe-15              0.06     0.08
	  2 llvmpipe-2               0.06     0.08
	  2 llvmpipe-3               0.06     0.08
	  2 llvmpipe-4               0.06     0.08
	  2 llvmpipe-5               0.06     0.08
	  2 llvmpipe-6               0.06     0.08
	  2 llvmpipe-7               0.06     0.08
	  2 llvmpipe-8               0.06     0.08
	  2 llvmpipe-9               0.06     0.08
	  6 clang                    0.06     0.06
	  2 glxinfo                  0.05     0.04
	  2 glxinfo:cs0              0.05     0.04
	  2 glxinfo:disk$0           0.05     0.04
	  2 glxinfo:sh0              0.05     0.04
	  2 glxinfo:shlo0            0.05     0.04
	  3 rocminfo                 0.03     0.00
	  1 lspci                    0.00     0.02
	  1 ps                       0.00     0.01
	 82 sh                       0.00     0.00
	 13 gcc                      0.00     0.00
	 10 gsettings                0.00     0.00
	  8 stat                     0.00     0.00
	  8 systemd-detect-          0.00     0.00
	  6 llvm-link                0.00     0.00
	  5 phoronix-test-s          0.00     0.00
	  4 gmain                    0.00     0.00
	  2 cc                       0.00     0.00
	  2 dconf worker             0.00     0.00
	  2 lscpu                    0.00     0.00
	  2 uname                    0.00     0.00
	  2 which                    0.00     0.00
	  2 xset                     0.00     0.00
	  1 date                     0.00     0.00
	  1 dirname                  0.00     0.00
	  1 dmesg                    0.00     0.00
	  1 dmidecode                0.00     0.00
	  1 grep                     0.00     0.00
	  1 ifconfig                 0.00     0.00
	  1 ip                       0.00     0.00
	  1 lsmod                    0.00     0.00
	  1 mktemp                   0.00     0.00
	  1 qdbus                    0.00     0.00
	  1 readlink                 0.00     0.00
	  1 realpath                 0.00     0.00
	  1 sed                      0.00     0.00
	  1 sort                     0.00     0.00
	  1 stty                     0.00     0.00
	  1 systemctl                0.00     0.00
	  1 template.sh              0.00     0.00
	  1 wc                       0.00     0.00
	  1 xrandr                   0.00     0.00
0 processes running
47 maximum processes
Computation blocks
      911524) neat             cpu=8 start=5.71  finish=37.89
        911525) neat             cpu=3 start=5.71  finish=36.73
          911526) neat             cpu=4 start=5.82  finish=36.73
          911527) neat             cpu=13 start=5.82  finish=36.73
          911528) neat             cpu=6 start=5.82  finish=36.73
          911529) neat             cpu=2 start=5.82  finish=36.73
          911530) neat             cpu=1 start=5.82  finish=36.73
          911531) neat             cpu=15 start=5.82  finish=36.73
          911532) neat             cpu=0 start=5.82  finish=36.73
          911533) neat             cpu=11 start=5.82  finish=36.73
          911534) neat             cpu=14 start=5.82  finish=36.73
          911535) neat             cpu=9 start=5.82  finish=36.73
          911536) neat             cpu=10 start=5.82  finish=36.73
          911537) neat             cpu=5 start=5.82  finish=36.73
          911538) neat             cpu=12 start=5.82  finish=36.73
          911539) neat             cpu=7 start=5.82  finish=36.73
          911540) neat             cpu=8 start=5.82  finish=36.73