
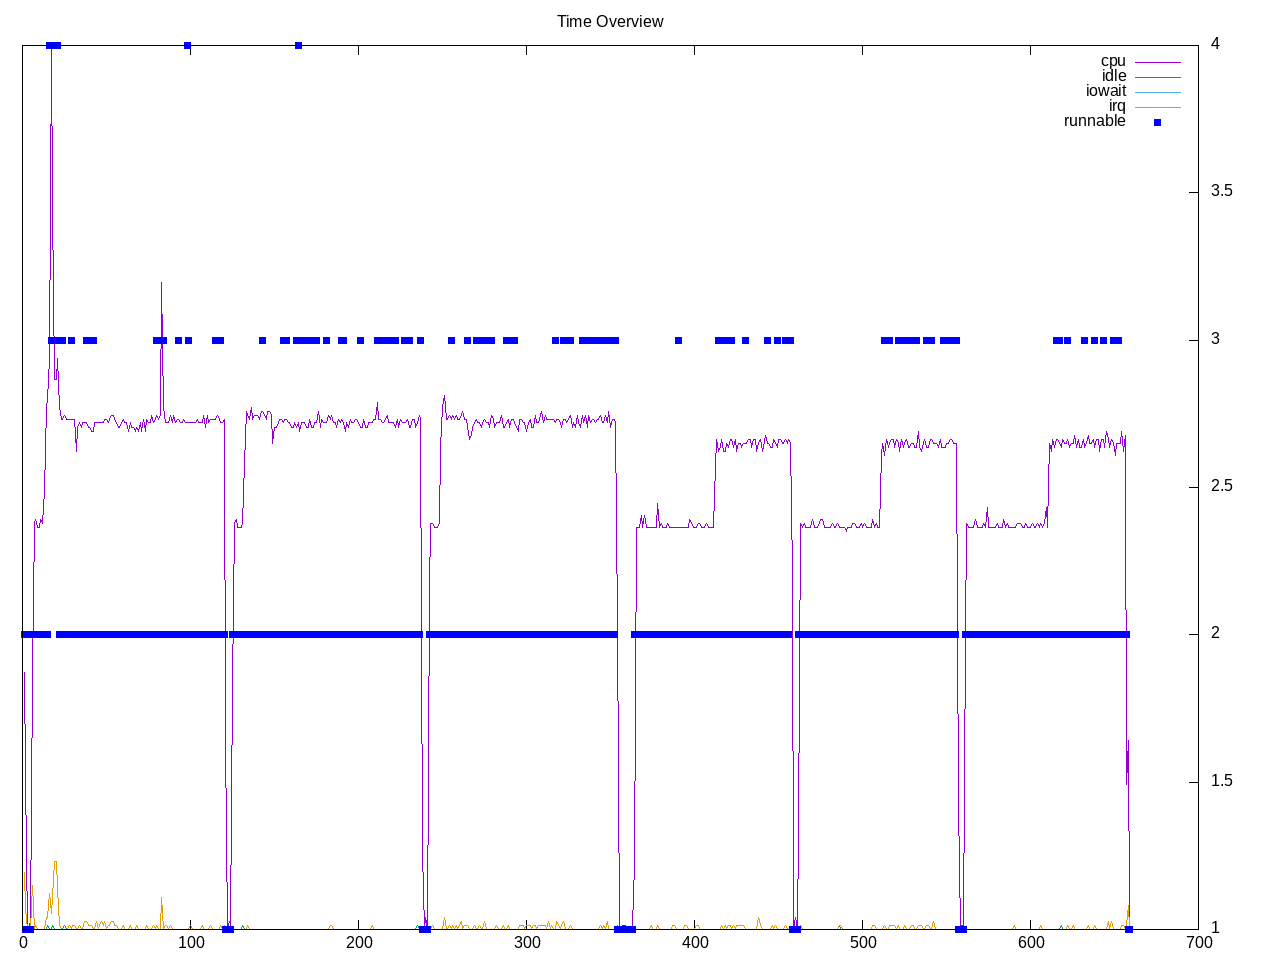
SPICE circuit simulator with two different test cases. The program looks single-threaded with occasional three threads.
Topdown profile shows a large amount of topdown stalls and a low retirement rate
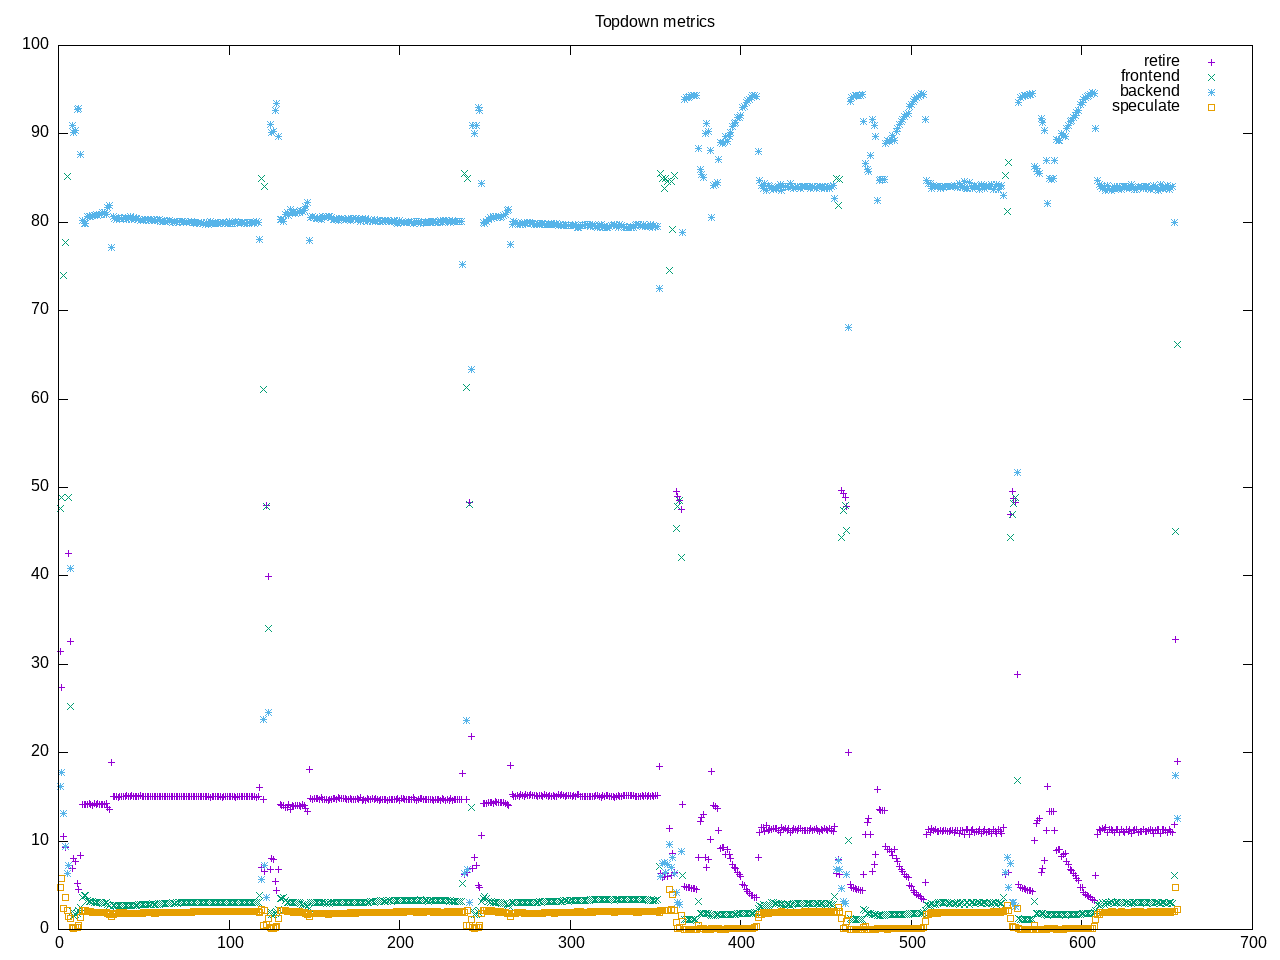
AMD metrics shows floating point code with a moderate L2 access and miss rate. There are not many branches. The on-cpu is barely more than one core.
elapsed              654.274
on_cpu               0.070          # 1.12 / 16 cores
utime                731.620
stime                1.458
nvcsw                13729          # 81.39%
nivcsw               3140           # 18.61%
inblock              0              # 0.00/sec
onblock              56064          # 85.69/sec
cpu-clock            733047101244   # 733.047 seconds
task-clock           733083455448   # 733.083 seconds
page faults          375005         # 511.545/sec
context switches     19961          # 27.229/sec
cpu migrations       315            # 0.430/sec
major page faults    2              # 0.003/sec
minor page faults    375003         # 511.542/sec
alignment faults     0              # 0.000/sec
emulation faults     0              # 0.000/sec
branches             227636710334   # 88.502 branches per 1000 inst
branch misses        1487507273     # 0.65% branch miss
conditional          165221763672   # 64.236 conditional branches per 1000 inst
indirect             10647435856    # 4.140 indirect branches per 1000 inst
cpu-cycles           3379846461857  # 0.32 GHz
instructions         2573410274886  # 0.76 IPC
slots                6764786299656  #
retiring             884507274916   # 13.1% (13.1%) low
-- ucode             1115721355     #     0.0%
-- fastpath          883391553561   #    13.1%
frontend             239339399574   #  3.5% ( 3.5%) low
-- latency           118070306598   #     1.7%
-- bandwidth         121269092976   #     1.8%
backend              5535942344017  # 81.8% (81.9%) high
-- cpu               761174160581   #    11.3%
-- memory            4774768183436  #    70.6%
speculation          103593987406   #  1.5% ( 1.5%)
-- branch mispredict 74106925238    #     1.1%
-- pipeline restart  29487062168    #     0.4%
smt-contention       1402399494     #  0.0% ( 0.0%)
cpu-cycles           3389350813164  # 0.32 GHz
instructions         2570015738058  # 0.76 IPC
instructions         858514957618   # 75.488 l2 access per 1000 inst
l2 hit from l1       48217698572    # 39.31% l2 miss
l2 miss from l1      14973906198    #
l2 hit from l2 pf    6090783709     #
l3 hit from l2 pf    7164595567     #
l3 miss from l2 pf   3334366653     #
instructions         856700215185   # 222.357 float per 1000 inst
float 512            46             # 0.000 AVX-512 per 1000 inst
float 256            910            # 0.000 AVX-256 per 1000 inst
float 128            190493618209   # 222.357 AVX-128 per 1000 inst
float MMX            0              # 0.000 MMX per 1000 inst
float scalar         0              # 0.000 scalar per 1000 inst
Intel metrics
elapsed              650.632
on_cpu               0.083          # 1.32 / 16 cores
utime                857.839
stime                1.072
nvcsw                13716          # 82.68%
nivcsw               2874           # 17.32%
inblock              1840           # 2.83/sec
onblock              44824          # 68.89/sec
cpu-clock            858768871242   # 858.769 seconds
task-clock           858793135960   # 858.793 seconds
page faults          364203         # 424.087/sec
context switches     19661          # 22.894/sec
cpu migrations       607            # 0.707/sec
major page faults    15             # 0.017/sec
minor page faults    364188         # 424.070/sec
alignment faults     0              # 0.000/sec
emulation faults     0              # 0.000/sec
branches             226966574551   # 88.287 branches per 1000 inst
branch misses        1541480071     # 0.68% branch miss
conditional          226966586935   # 88.287 conditional branches per 1000 inst
indirect             10685420053    # 4.156 indirect branches per 1000 inst
slots                17759394818246 #
retiring             2473017644334  # 13.9% (13.9%) low
-- ucode             322404419382   #     1.8%
-- fastpath          2150613224952  #    12.1%
frontend             821427631570   #  4.6% ( 4.6%) low
-- latency           358912915741   #     2.0%
-- bandwidth         462514715829   #     2.6%
backend              14581736945460 # 82.1% (82.1%) high
-- cpu               6516868648695  #    36.7%
-- memory            8064868296765  #    45.4%
speculation          273647358689   #  1.5% ( 1.5%)
-- branch mispredict 216235726103   #     1.2%
-- pipeline restart  57411632586    #     0.3%
smt-contention       0              #  0.0% ( 0.0%)
cpu-cycles           2955502961512  # 0.28 GHz
instructions         2570750857075  # 0.87 IPC
l2 access            306554724965   # 119.256 l2 access per 1000 inst
l2 miss              158681184532   # 51.76% l2 miss
Process overview is simple invocations of ngspice
368 processes
	 18 ngspice               1452.74     1.26
	 68 clinfo                  15.88     6.30
	 38 vulkaninfo               1.49     0.76
	  4 vulkani:disk$0           0.15     0.08
	  6 glxinfo:gdrv0            0.12     0.06
	  6 glxinfo:gl0              0.12     0.06
	  2 llvmpipe-0               0.08     0.04
	  2 llvmpipe-1               0.08     0.04
	  2 llvmpipe-10              0.08     0.04
	  2 llvmpipe-11              0.08     0.04
	  2 llvmpipe-12              0.08     0.04
	  2 llvmpipe-13              0.08     0.04
	  2 llvmpipe-14              0.08     0.04
	  2 llvmpipe-15              0.08     0.04
	  2 llvmpipe-2               0.08     0.04
	  2 llvmpipe-3               0.08     0.04
	  2 llvmpipe-4               0.08     0.04
	  2 llvmpipe-5               0.08     0.04
	  2 llvmpipe-6               0.08     0.04
	  2 llvmpipe-7               0.08     0.04
	  2 llvmpipe-8               0.08     0.04
	  2 llvmpipe-9               0.08     0.04
	  6 clang                    0.07     0.04
	  6 php                      0.06     0.27
	  2 glxinfo                  0.06     0.02
	  2 glxinfo:cs0              0.06     0.02
	  2 glxinfo:disk$0           0.06     0.02
	  2 glxinfo:sh0              0.06     0.02
	  2 glxinfo:shlo0            0.06     0.02
	  3 rocminfo                 0.03     0.00
	  1 lspci                    0.00     0.03
	 84 sh                       0.00     0.00
	 13 gcc                      0.00     0.00
	 12 gsettings                0.00     0.00
	  8 stat                     0.00     0.00
	  8 systemd-detect-          0.00     0.00
	  6 llvm-link                0.00     0.00
	  5 phoronix-test-s          0.00     0.00
	  3 gmain                    0.00     0.00
	  2 cc                       0.00     0.00
	  2 lscpu                    0.00     0.00
	  2 uname                    0.00     0.00
	  2 which                    0.00     0.00
	  2 xset                     0.00     0.00
	  1 date                     0.00     0.00
	  1 dconf worker             0.00     0.00
	  1 dirname                  0.00     0.00
	  1 dmesg                    0.00     0.00
	  1 dmidecode                0.00     0.00
	  1 grep                     0.00     0.00
	  1 ifconfig                 0.00     0.00
	  1 ip                       0.00     0.00
	  1 lsmod                    0.00     0.00
	  1 mktemp                   0.00     0.00
	  1 ps                       0.00     0.00
	  1 qdbus                    0.00     0.00
	  1 readlink                 0.00     0.00
	  1 realpath                 0.00     0.00
	  1 sed                      0.00     0.00
	  1 sort                     0.00     0.00
	  1 stty                     0.00     0.00
	  1 systemctl                0.00     0.00
	  1 template.sh              0.00     0.00
	  1 wc                       0.00     0.00
	  1 xrandr                   0.00     0.00
0 processes running
47 maximum processes
Computation blocks
      158451) ngspice          cpu=7 start=6.70  finish=118.97
        158452) ngspice          cpu=5 start=6.70  finish=118.96
          158453) ngspice          cpu=6 start=8.54  finish=118.96
      158458) ngspice          cpu=7 start=122.98 finish=232.45
        158459) ngspice          cpu=0 start=122.99 finish=232.45
          158460) ngspice          cpu=1 start=124.84 finish=232.45
      158467) ngspice          cpu=7 start=236.47 finish=347.93
        158468) ngspice          cpu=0 start=236.47 finish=347.93
          158469) ngspice          cpu=2 start=238.31 finish=347.93
      158473) sh               cpu=9 start=347.94 finish=347.94
        158474) sh               cpu=2 start=347.94 finish=347.94
      158475) ngspice          cpu=15 start=358.43 finish=452.29
        158476) ngspice          cpu=8 start=358.44 finish=452.27
          158477) ngspice          cpu=10 start=371.73 finish=452.27
      158478) ngspice          cpu=15 start=456.29 finish=551.97
        158479) ngspice          cpu=0 start=456.29 finish=551.95
          158480) ngspice          cpu=9 start=469.75 finish=551.95
      158513) ngspice          cpu=15 start=555.97 finish=649.15
        158514) ngspice          cpu=0 start=555.97 finish=649.14
          158515) ngspice          cpu=1 start=569.14 finish=649.14