
Javascript Octane benchmark with one workload. It is quick running, single threaded.
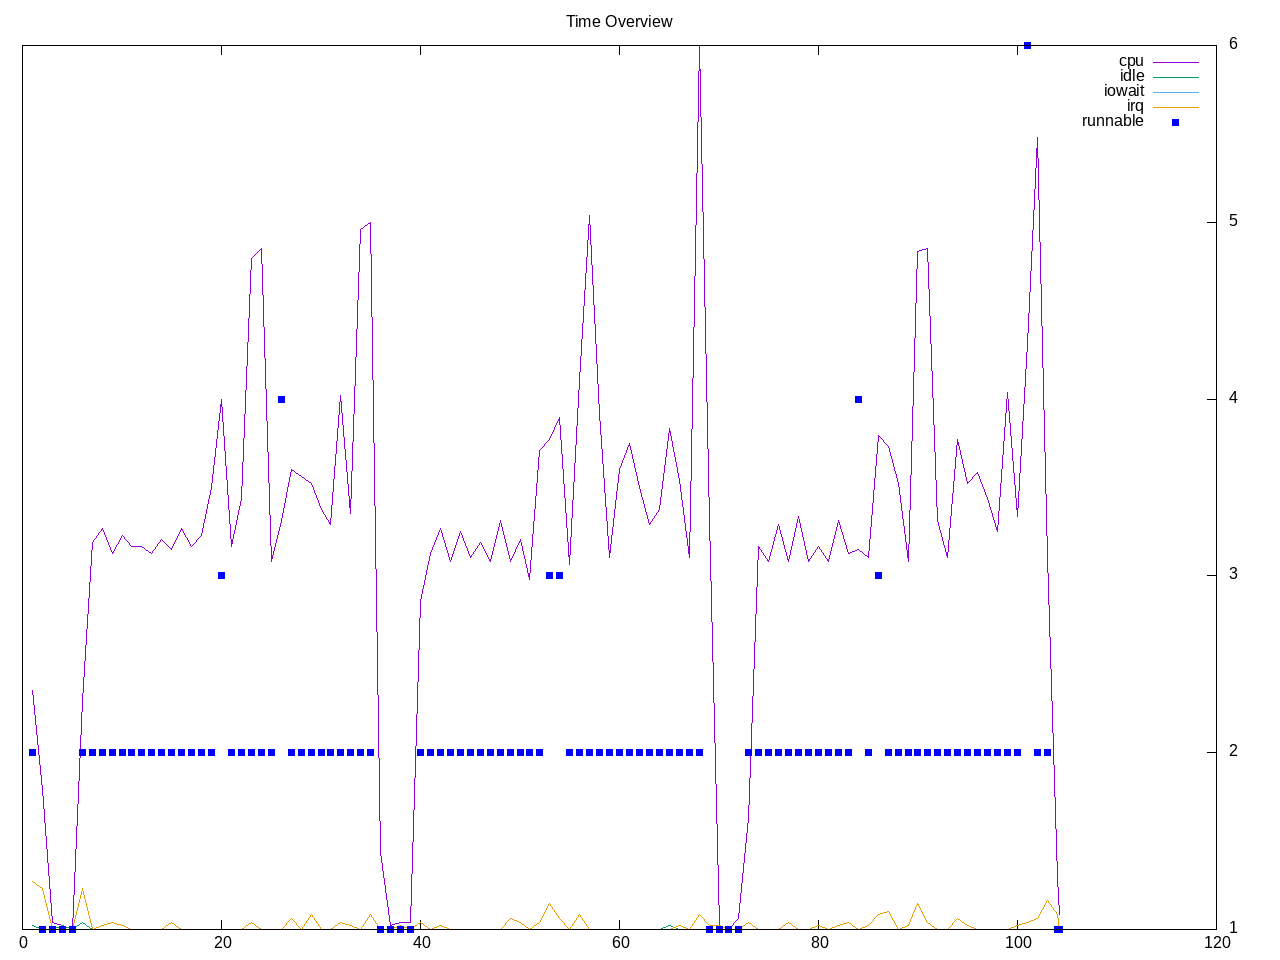
Topdown profile looks a bit scattered on retirement and stalls.
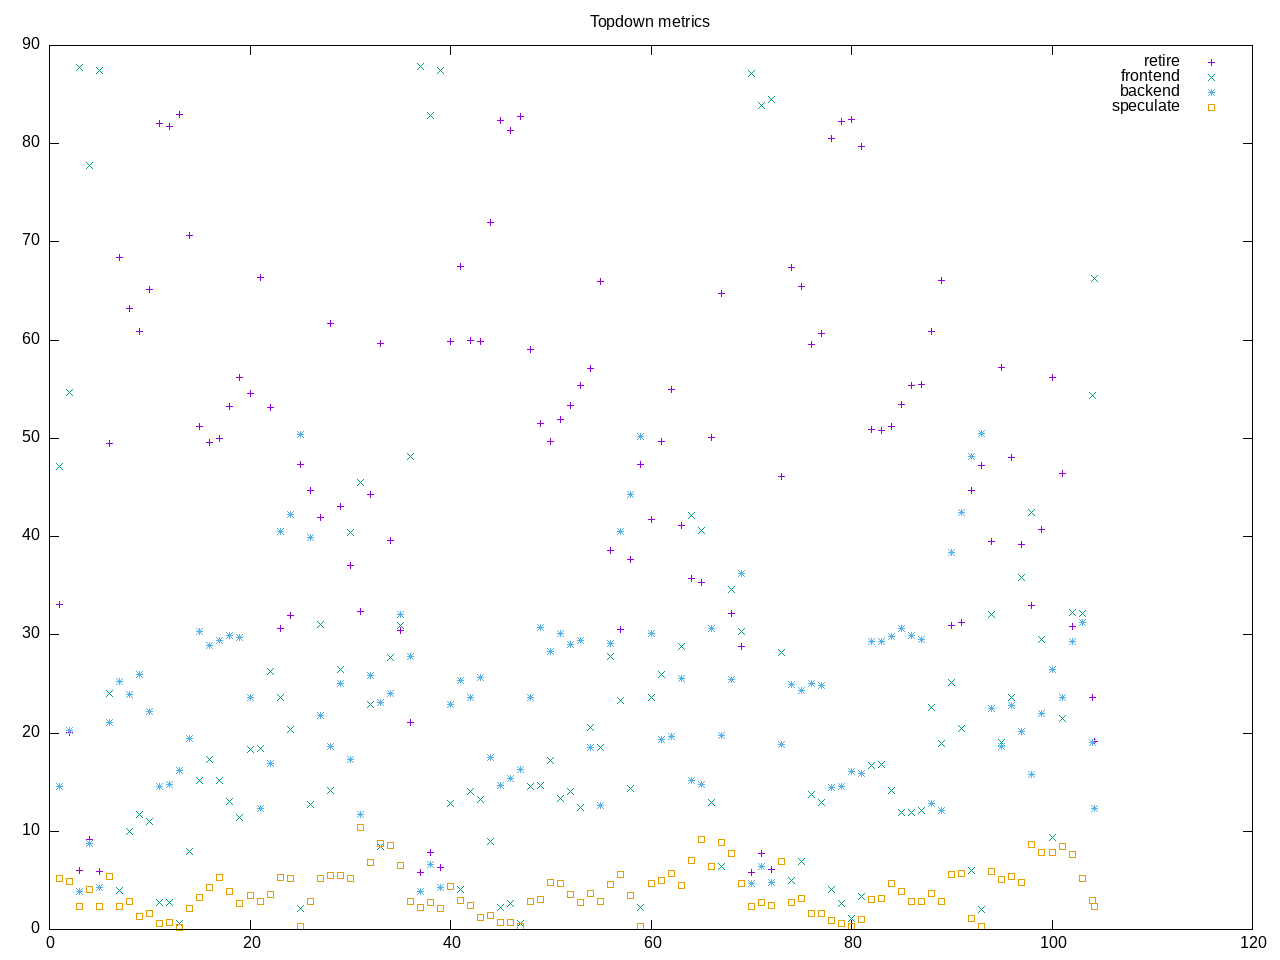
AMD metrics show not much floating point, a high IPC and reasonable retirement rate.
elapsed              104.178
on_cpu               0.067          # 1.07 / 16 cores
utime                106.784
stime                4.829
nvcsw                195263         # 99.61%
nivcsw               764            # 0.39%
inblock              8              # 0.08/sec
onblock              12536          # 120.33/sec
cpu-clock            111094196613   # 111.094 seconds
task-clock           111231388136   # 111.231 seconds
page faults          1122156        # 10088.483/sec
context switches     196368         # 1765.401/sec
cpu migrations       326            # 2.931/sec
major page faults    4              # 0.036/sec
minor page faults    1122152        # 10088.447/sec
alignment faults     0              # 0.000/sec
emulation faults     0              # 0.000/sec
branches             338956254589   # 216.164 branches per 1000 inst
branch misses        1771149942     # 0.52% branch miss
conditional          276845569978   # 176.554 conditional branches per 1000 inst
indirect             13220468194    # 8.431 indirect branches per 1000 inst
cpu-cycles           484061004939   # 0.29 GHz
instructions         1559784642354  # 3.22 IPC high
slots                971703456978   #
retiring             496249861182   # 51.1% (51.3%)
-- ucode             1218928126     #     0.1%
-- fastpath          495030933056   #    50.9%
frontend             177971339405   # 18.3% (18.4%)
-- latency           106594150902   #    11.0%
-- bandwidth         71377188503    #     7.3%
backend              250138346546   # 25.7% (25.9%)
-- cpu               63203304721    #     6.5%
-- memory            186935041825   #    19.2%
speculation          42066752102    #  4.3% ( 4.4%)
-- branch mispredict 40368937288    #     4.2%
-- pipeline restart  1697814814     #     0.2%
smt-contention       5273139832     #  0.5% ( 0.0%)
cpu-cycles           487529093501   # 0.29 GHz
instructions         1569196479319  # 3.22 IPC high
instructions         523496464659   # 15.041 l2 access per 1000 inst
l2 hit from l1       6108036355     # 22.63% l2 miss
l2 miss from l1      667325636      #
l2 hit from l2 pf    651701718      #
l3 hit from l2 pf    460659885      #
l3 miss from l2 pf   653723722      #
instructions         523874216240   # 26.092 float per 1000 inst
float 512            60             # 0.000 AVX-512 per 1000 inst
float 256            644            # 0.000 AVX-256 per 1000 inst
float 128            13669029298    # 26.092 AVX-128 per 1000 inst
float MMX            0              # 0.000 MMX per 1000 inst
float scalar         0              # 0.000 scalar per 1000 inst
instructions         1566071016253  #
opcache              246248600449   # 157.240 opcache per 1000 inst
opcache miss         14375350694    #  5.8% opcache miss rate
l1 dTLB miss         1935602692     # 1.236 L1 dTLB per 1000 inst
l2 dTLB miss         158505658      # 0.101 L2 dTLB per 1000 inst
instructions         1566138815632  #
icache               23805191255    # 15.200 icache per 1000 inst
icache miss          6022286080     # 25.3% icache miss rate
l1 iTLB miss         965276691      # 0.616 L1 iTLB per 1000 inst
l2 iTLB miss         0              # 0.000 L2 iTLB per 1000 inst
tlb flush            191985         # 0.000 TLB flush per 1000 inst
Intel metrics
elapsed              104.844
on_cpu               0.068          # 1.08 / 16 cores
utime                109.421
stime                4.072
nvcsw                176369         # 99.48%
nivcsw               930            # 0.52%
inblock              79480          # 758.08/sec
onblock              1296           # 12.36/sec
cpu-clock            112122082393   # 112.122 seconds
task-clock           112228433866   # 112.228 seconds
page faults          999778         # 8908.420/sec
context switches     177654         # 1582.968/sec
cpu migrations       902            # 8.037/sec
major page faults    396            # 3.529/sec
minor page faults    999382         # 8904.891/sec
alignment faults     0              # 0.000/sec
emulation faults     0              # 0.000/sec
branches             311098773367   # 215.942 branches per 1000 inst
branch misses        1513153923     # 0.49% branch miss
conditional          311098783799   # 215.942 conditional branches per 1000 inst
indirect             14539163236    # 10.092 indirect branches per 1000 inst
slots                2388429927608  #
retiring             1402967208441  # 58.7% (58.7%) high
-- ucode             45194709311    #     1.9%
-- fastpath          1357772499130  #    56.8%
frontend             472431510660   # 19.8% (19.8%)
-- latency           165358888557   #     6.9%
-- bandwidth         307072622103   #    12.9%
backend              339247010658   # 14.2% (14.2%) low
-- cpu               197357121559   #     8.3%
-- memory            141889889099   #     5.9%
speculation          195543874473   #  8.2% ( 8.2%)
-- branch mispredict 185516547666   #     7.8%
-- pipeline restart  10027326807    #     0.4%
smt-contention       0              #  0.0% ( 0.0%)
cpu-cycles           416392267737   # 0.25 GHz
instructions         1474876949895  # 3.54 IPC high
l2 access            19775574302    # 13.988 l2 access per 1000 inst
l2 miss              7092133274     # 35.86% l2 miss
cpu-cycles           400784340244   # 13.4% memory latency
load stalls          43115337904    #  0.0% l1 bound
l1 miss              43919464973    #  6.4% l2 bound
l2 miss              18099082550    #  2.0% l3 bound
l3 miss              9920802371     #  2.5% dram bound
store_stalls         10390568159    #  2.6% store bound
Process summary shows node as the primary process,.
357 processes
	 21 node                   742.28    26.18
	 68 clinfo                  15.19     7.00
	 38 vulkaninfo               1.33     1.14
	  4 vulkani:disk$0           0.14     0.12
	  2 llvmpipe-0               0.07     0.06
	  2 llvmpipe-1               0.07     0.06
	  2 llvmpipe-10              0.07     0.06
	  2 llvmpipe-11              0.07     0.06
	  2 llvmpipe-12              0.07     0.06
	  2 llvmpipe-13              0.07     0.06
	  2 llvmpipe-14              0.07     0.06
	  2 llvmpipe-15              0.07     0.06
	  2 llvmpipe-2               0.07     0.06
	  2 llvmpipe-3               0.07     0.06
	  2 llvmpipe-4               0.07     0.06
	  2 llvmpipe-5               0.07     0.06
	  2 llvmpipe-6               0.07     0.06
	  2 llvmpipe-7               0.07     0.06
	  2 llvmpipe-8               0.07     0.06
	  2 llvmpipe-9               0.07     0.06
	  6 php                      0.06     0.07
	  6 clang                    0.06     0.06
	  3 rocminfo                 0.03     0.00
	  1 lspci                    0.01     0.02
	  3 nodejs                   0.01     0.00
	 83 sh                       0.00     0.00
	 12 gcc                      0.00     0.00
	 10 gsettings                0.00     0.00
	  8 stat                     0.00     0.00
	  8 systemd-detect-          0.00     0.00
	  6 llvm-link                0.00     0.00
	  5 glxinfo                  0.00     0.00
	  5 gmain                    0.00     0.00
	  5 phoronix-test-s          0.00     0.00
	  3 node-octane              0.00     0.00
	  2 grep                     0.00     0.00
	  2 lscpu                    0.00     0.00
	  2 setterm                  0.00     0.00
	  2 uname                    0.00     0.00
	  2 which                    0.00     0.00
	  1 cc                       0.00     0.00
	  1 date                     0.00     0.00
	  1 dconf worker             0.00     0.00
	  1 dirname                  0.00     0.00
	  1 dmesg                    0.00     0.00
	  1 dmidecode                0.00     0.00
	  1 ifconfig                 0.00     0.00
	  1 ip                       0.00     0.00
	  1 lsmod                    0.00     0.00
	  1 mktemp                   0.00     0.00
	  1 ps                       0.00     0.00
	  1 qdbus                    0.00     0.00
	  1 readlink                 0.00     0.00
	  1 realpath                 0.00     0.00
	  1 sed                      0.00     0.00
	  1 sort                     0.00     0.00
	  1 stty                     0.00     0.00
	  1 systemctl                0.00     0.00
	  1 template.sh              0.00     0.00
	  1 wc                       0.00     0.00
0 processes running
47 maximum processes
Computation block
      520810) node-octane      cpu=2 start=5.47  finish=35.14
        520811) node             cpu=4 start=5.47  finish=35.12
          520812) node             cpu=11 start=5.49  finish=35.12
          520813) node             cpu=3 start=5.49  finish=35.12
          520814) node             cpu=8 start=5.49  finish=35.12
          520815) node             cpu=6 start=5.49  finish=35.12
          520816) node             cpu=5 start=5.49  finish=35.12
          520817) node             cpu=15 start=5.50  finish=35.12
        520819) nodejs           cpu=5 start=35.13 finish=35.14