
The NAS parallel benchmarks – link – test a set of computational kernels:
- IS – integer sort
- EP – embarrasingly parallel
- CG – conjugate gradient
- MG – multi-grid
- FT – fourier transform
- BT – block triangle diagonal solver
- SP – scalar-penta diagonal solver
- LU – lower upper gauss seidel solver
With a variety of sizes (S = small, W = workstation, A/B/C = standard tests, D/E/F = large tests) where each letter is larger than the previous one. This test tries 10 configurations: BT.C, CG.C, EP.C, EP.D, FT.C, IS.D, LU.C, MG.C, SP.B and SP.C. The IS.D doesn’t run on Intel but all the others run.Depending on the problem size, different numbers of threads are run.

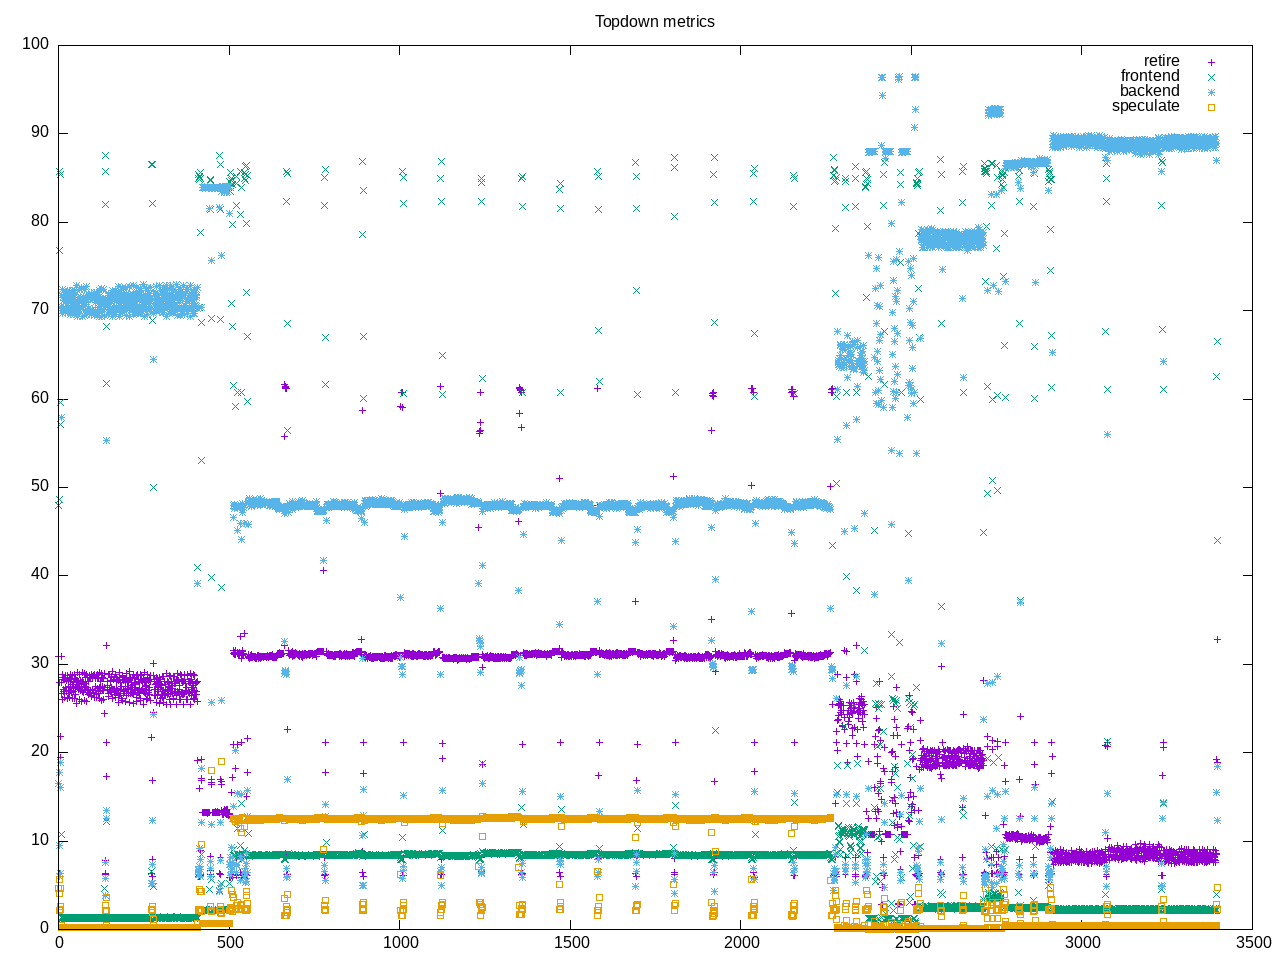
Overall topdown distribution shows about 65% backend bound with both CPU and memory being about equal weight. However, there are some tests approaching 90% backend bound and others closer to 60%
The AMD metrics show 30% of instructions are floating point with some branches and ~5% of time for misprediction. We are about 1/3 on cpu and initial graph suggests this is mostly because the algorithms don’t always run on 16 cores.
elapsed              2283.426
on_cpu               0.329          # 5.26 / 16 cores
utime                11712.085
stime                293.999
nvcsw                418029         # 92.54%
nivcsw               33714          # 7.46%
inblock              24920          # 10.91/sec
onblock              726560         # 318.19/sec
cpu-clock            12006890392461 # 12006.890 seconds
task-clock           12007051116953 # 12007.051 seconds
page faults          32449764       # 2702.559/sec
context switches     462377         # 38.509/sec
cpu migrations       18933          # 1.577/sec
major page faults    3595           # 0.299/sec
minor page faults    32446169       # 2702.260/sec
alignment faults     0              # 0.000/sec
emulation faults     0              # 0.000/sec
branches             5515738653990  # 82.620 branches per 1000 inst
branch misses        108608594762   # 1.97% branch miss
conditional          3742804280329  # 56.063 conditional branches per 1000 inst
indirect             615681271121   # 9.222 indirect branches per 1000 inst
cpu-cycles           60351169928545 # 1.49 GHz
instructions         79670697330954 # 1.32 IPC
slots                120710831646738 #
retiring             27615568683340 # 22.9% (22.9%)
-- ucode             3933717481     #     0.0%
-- fastpath          27611634965859 #    22.9%
frontend             7033153177869  #  5.8% ( 5.8%)
-- latency           3463417792602  #     2.9%
-- bandwidth         3569735385267  #     3.0%
backend              79549840661075 # 65.9% (65.9%)
-- cpu               40042540131536 #    33.2%
-- memory            39507300529539 #    32.7%
speculation          6459137499915  #  5.4% ( 5.4%)
-- branch mispredict 6321715953737  #     5.2%
-- pipeline restart  137421546178   #     0.1%
smt-contention       53098719153    #  0.0% ( 0.0%)
cpu-cycles           80335334077607 # 1.64 GHz
instructions         117089528823367 # 1.46 IPC
instructions         39035071246839 # 28.407 l2 access per 1000 inst
l2 hit from l1       724297829438   # 21.89% l2 miss
l2 miss from l1      50355819375    #
l2 hit from l2 pf    192229686294   #
l3 hit from l2 pf    82702658409    #
l3 miss from l2 pf   109634385230   #
instructions         39021936306273 # 290.912 float per 1000 inst
float 512            197            # 0.000 AVX-512 per 1000 inst
float 256            135099664      # 0.003 AVX-256 per 1000 inst
float 128            11351820981171 # 290.909 AVX-128 per 1000 inst
float MMX            0              # 0.000 MMX per 1000 inst
float scalar         0              # 0.000 scalar per 1000 inst
Intel metrics
elapsed              3395.363
on_cpu               0.498          # 7.97 / 16 cores
utime                26824.162
stime                240.716
nvcsw                571012         # 89.91%
nivcsw               64057          # 10.09%
inblock              1526680        # 449.64/sec
onblock              848720         # 249.96/sec
cpu-clock            27828052765411 # 27828.053 seconds
task-clock           27828221812104 # 27828.222 seconds
page faults          39637056       # 1424.347/sec
context switches     683518         # 24.562/sec
cpu migrations       38996          # 1.401/sec
major page faults    17773          # 0.639/sec
minor page faults    39619248       # 1423.707/sec
alignment faults     0              # 0.000/sec
emulation faults     0              # 0.000/sec
branches             23921316362428 # 146.786 branches per 1000 inst
branch misses        103717613886   # 0.43% branch miss
conditional          23921316438460 # 146.786 conditional branches per 1000 inst
indirect             4336551074975  # 26.610 indirect branches per 1000 inst
slots                328695207828722 #
retiring             171019529525049 # 52.0% (52.0%)
-- ucode             15361044597237 #     4.7%
-- fastpath          155658484927812 #    47.4%
frontend             22635542803013 #  6.9% ( 6.9%)
-- latency           7363451194826  #     2.2%
-- bandwidth         15272091608187 #     4.6%
backend              124024545934012 # 37.7% (37.7%)
-- cpu               50372780801574 #    15.3%
-- memory            73651765132438 #    22.4%
speculation          11136414067764 #  3.4% ( 3.4%)
-- branch mispredict 8681080075941  #     2.6%
-- pipeline restart  2455333991823  #     0.7%
smt-contention       0              #  0.0% ( 0.0%)
cpu-cycles           102330630188559 # 1.55 GHz
instructions         317073908099680 # 3.10 IPC
l2 access            1934847494161  # 12.244 l2 access per 1000 inst
l2 miss              510893459816   # 26.40% l2 miss
The process tree shows this is MPI code with solvers named for the algorithm.
1446 processes
	 96 ep.D.x               10489.55     1.66
	 36 sp.C.x                5617.93    36.90
	 36 bt.C.x                4643.11    18.33
	 72 lu.C.x                4173.60    15.98
	 72 is.D.x                2628.17   434.67
	 72 cg.C.x                1664.50    19.92
	 72 ft.C.x                1461.35   223.01
	 36 sp.B.x                1360.87    14.18
	 72 mg.C.x                 663.37    20.76
	 72 ep.C.x                 493.43     0.98
	 67 clinfo                  16.63     5.57
	186 mpiexec                  8.56    23.04
	 38 vulkaninfo               0.83     1.32
	  6 php                      0.15     0.77
	  6 glxinfo:gdrv0            0.15     0.06
	  4 vulkani:disk$0           0.09     0.14
	  2 glxinfo                  0.07     0.02
	  2 glxinfo:cs0              0.07     0.02
	  2 glxinfo:disk$0           0.07     0.02
	  2 glxinfo:sh0              0.07     0.02
	  2 glxinfo:shlo0            0.07     0.02
	  2 llvmpipe-0               0.05     0.07
	  2 llvmpipe-1               0.05     0.07
	  2 llvmpipe-10              0.05     0.07
	  2 llvmpipe-11              0.05     0.07
	  2 llvmpipe-12              0.05     0.07
	  2 llvmpipe-13              0.05     0.07
	  2 llvmpipe-14              0.05     0.07
	  2 llvmpipe-15              0.05     0.07
	  2 llvmpipe-2               0.05     0.07
	  2 llvmpipe-3               0.05     0.07
	  2 llvmpipe-4               0.05     0.07
	  2 llvmpipe-5               0.05     0.07
	  2 llvmpipe-6               0.05     0.07
	  2 llvmpipe-7               0.05     0.07
	  2 llvmpipe-8               0.05     0.07
	  2 llvmpipe-9               0.05     0.07
	  6 clang                    0.03     0.09
	  3 rocminfo                 0.03     0.00
	  1 lspci                    0.00     0.02
	194 npb                      0.00     0.00
	100 sh                       0.00     0.00
	 31 cut                      0.00     0.00
	 24 bc                       0.00     0.00
	 15 awk                      0.00     0.00
	 13 gcc                      0.00     0.00
	 11 gsettings                0.00     0.00
	  8 stat                     0.00     0.00
	  8 systemd-detect-          0.00     0.00
	  6 llvm-link                0.00     0.00
	  5 phoronix-test-s          0.00     0.00
	  3 gmain                    0.00     0.00
	  2 cc                       0.00     0.00
	  2 dconf worker             0.00     0.00
	  2 lscpu                    0.00     0.00
	  2 uname                    0.00     0.00
	  2 which                    0.00     0.00
	  2 xset                     0.00     0.00
	  1 date                     0.00     0.00
	  1 dirname                  0.00     0.00
	  1 dmesg                    0.00     0.00
	  1 dmidecode                0.00     0.00
	  1 grep                     0.00     0.00
	  1 ifconfig                 0.00     0.00
	  1 ip                       0.00     0.00
	  1 lsmod                    0.00     0.00
	  1 mktemp                   0.00     0.00
	  1 ps                       0.00     0.00
	  1 qdbus                    0.00     0.00
	  1 readlink                 0.00     0.00
	  1 realpath                 0.00     0.00
	  1 sed                      0.00     0.00
	  1 sort                     0.00     0.00
	  1 stty                     0.00     0.00
	  1 systemctl                0.00     0.00
	  1 template.sh              0.00     0.00
	  1 wc                       0.00     0.00
	  1 xrandr                   0.00     0.00
0 processes running
47 maximum processes
Here is an example run of the BT.C workload
      86732) npb              cpu=13 start=5.79  finish=136.63
        86733) npb              cpu=14 start=5.79  finish=5.79
          86734) npb              cpu=15 start=5.79  finish=5.79
          86735) cut              cpu=10 start=5.79  finish=5.79
        86736) npb              cpu=0 start=5.79  finish=5.79
        86737) npb              cpu=1 start=5.79  finish=5.80
          86738) npb              cpu=14 start=5.79  finish=5.79
          86739) bc               cpu=15 start=5.79  finish=5.80
        86740) mpiexec          cpu=4 start=5.80  finish=136.60
          86743) mpiexec          cpu=2 start=6.38  finish=136.60
          86744) mpiexec          cpu=11 start=6.38  finish=6.38
          86745) mpiexec          cpu=15 start=6.40  finish=136.60
          86747) mpiexec          cpu=13 start=6.88  finish=136.60
          86748) mpiexec          cpu=7 start=6.88  finish=136.60
          86749) bt.C.x           cpu=1 start=6.89  finish=136.57
            86751) bt.C.x           cpu=12 start=6.89  finish=136.57
            86754) bt.C.x           cpu=14 start=6.90  finish=136.56
          86750) bt.C.x           cpu=5 start=6.89  finish=136.57
            86753) bt.C.x           cpu=11 start=6.90  finish=136.57
            86757) bt.C.x           cpu=2 start=6.91  finish=136.56
          86752) bt.C.x           cpu=15 start=6.90  finish=136.57
            86756) bt.C.x           cpu=0 start=6.90  finish=136.57
            86759) bt.C.x           cpu=4 start=6.91  finish=136.56
          86755) bt.C.x           cpu=0 start=6.90  finish=136.57
            86758) bt.C.x           cpu=11 start=6.91  finish=136.57
            86760) bt.C.x           cpu=12 start=6.91  finish=136.56