
A single threaded test of the numpy library
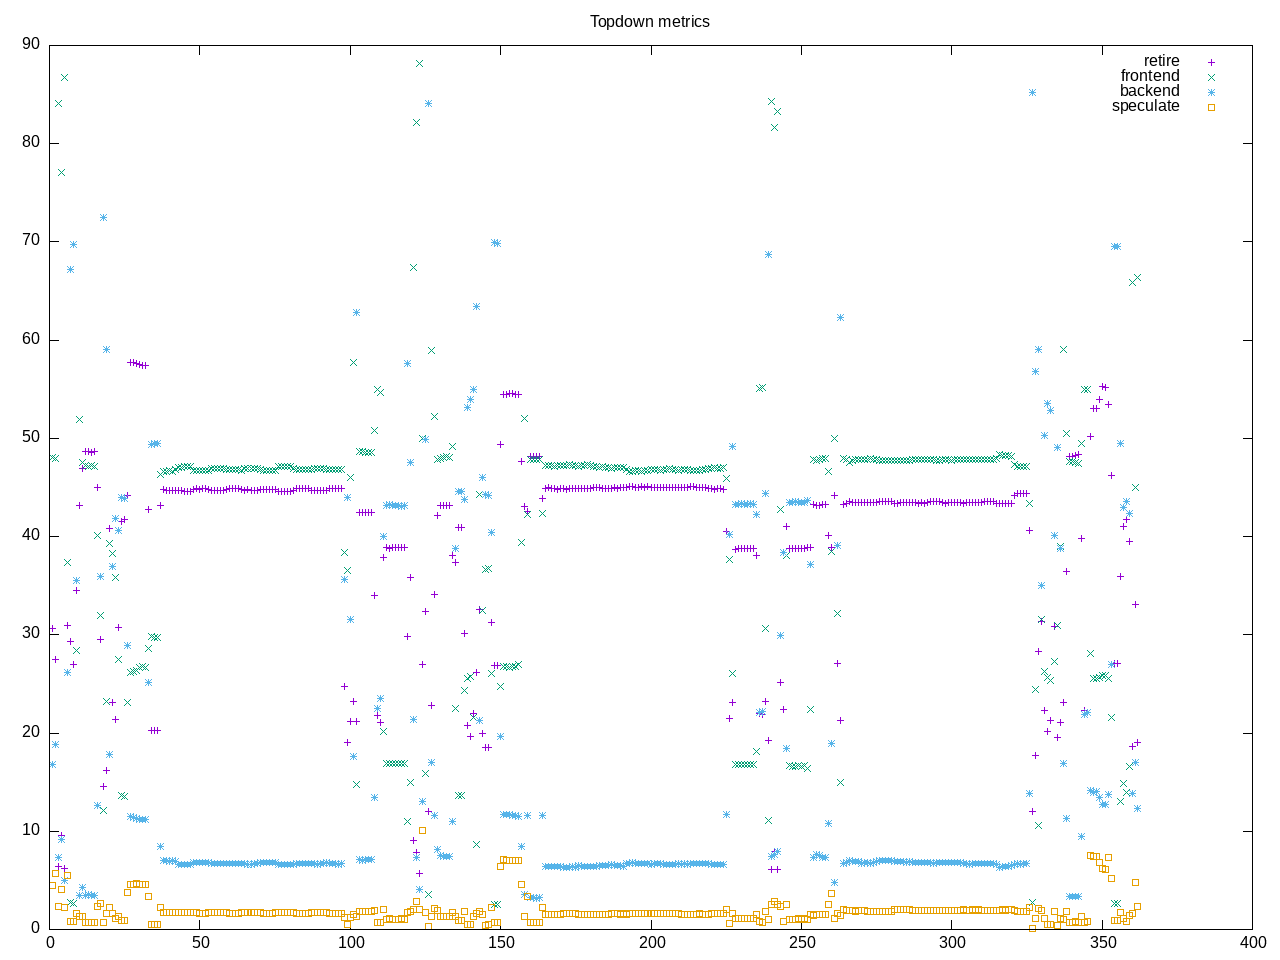
Topdown shows more frontend activity and not much backend. Also looks like the test has a few phases.
AMD metrics show a moderate amount of floating point and some L2 access.
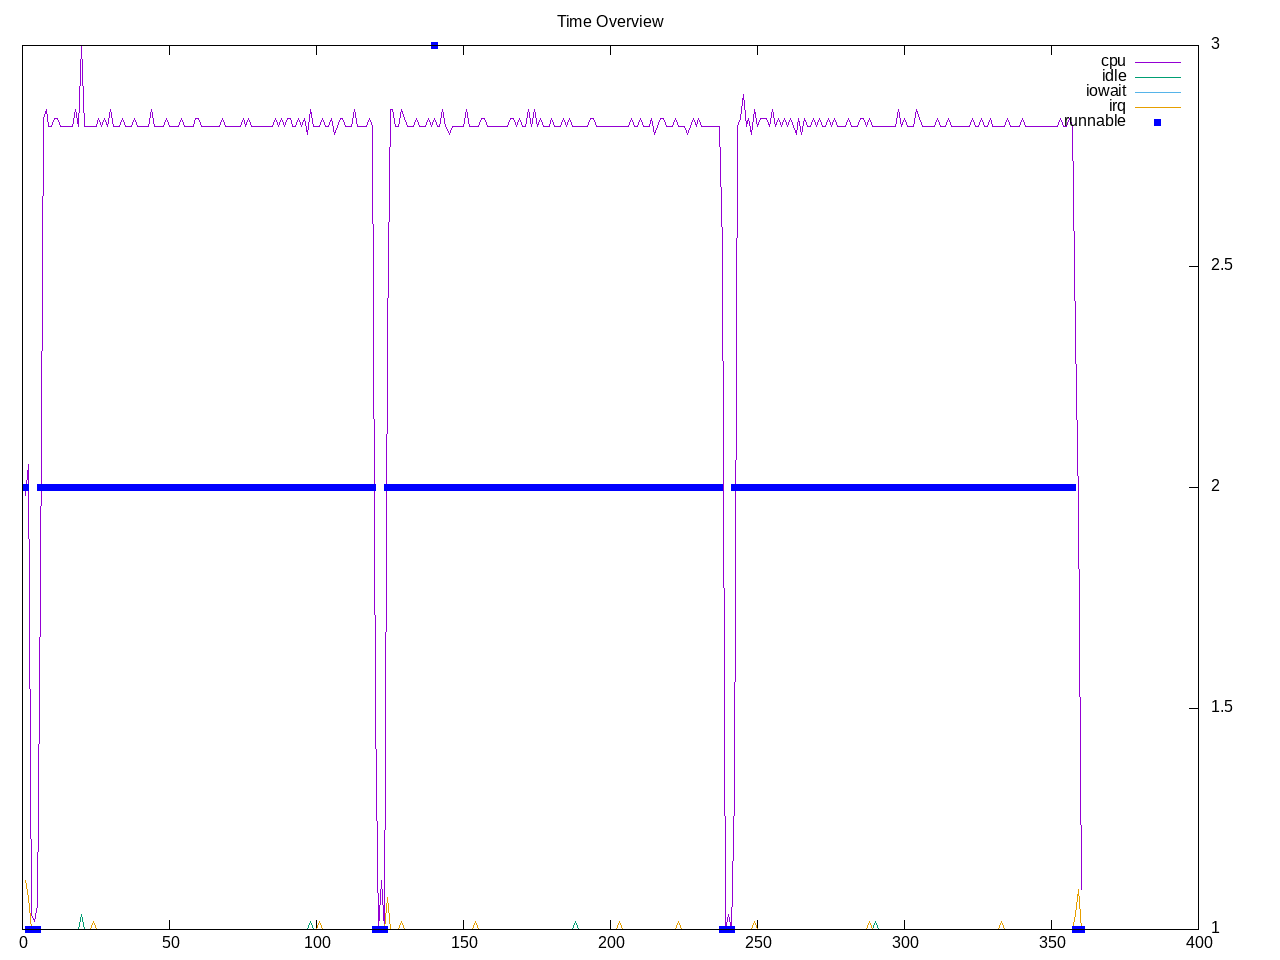
elapsed              361.124
on_cpu               0.060          # 0.96 / 16 cores
utime                323.026
stime                23.631
nvcsw                2254           # 52.37%
nivcsw               2050           # 47.63%
inblock              0              # 0.00/sec
onblock              14272          # 39.52/sec
cpu-clock            346708703424   # 346.709 seconds
task-clock           346714252381   # 346.714 seconds
page faults          13793915       # 39784.678/sec
context switches     5835           # 16.829/sec
cpu migrations       342            # 0.986/sec
major page faults    2              # 0.006/sec
minor page faults    13793913       # 39784.673/sec
alignment faults     0              # 0.000/sec
emulation faults     0              # 0.000/sec
branches             753903919180   # 192.310 branches per 1000 inst
branch misses        3223543724     # 0.43% branch miss
conditional          548538917674   # 139.924 conditional branches per 1000 inst
indirect             50159713959    # 12.795 indirect branches per 1000 inst
cpu-cycles           1631214371880  # 0.28 GHz
instructions         3910901560480  # 2.40 IPC
slots                3270777827046  #
retiring             1318275595981  # 40.3% (40.3%)
-- ucode             4213617091     #     0.1%
-- fastpath          1314061978890  #    40.2%
frontend             1316680239451  # 40.3% (40.3%)
-- latency           692593480368   #    21.2%
-- bandwidth         624086759083   #    19.1%
backend              574041611376   # 17.6% (17.6%)
-- cpu               115146122764   #     3.5%
-- memory            458895488612   #    14.0%
speculation          61567308765    #  1.9% ( 1.9%)
-- branch mispredict 50900498632    #     1.6%
-- pipeline restart  10666810133    #     0.3%
smt-contention       212699336      #  0.0% ( 0.0%)
cpu-cycles           1614316899243  # 0.28 GHz
instructions         3910468849113  # 2.42 IPC
instructions         1305538175558  # 81.788 l2 access per 1000 inst
l2 hit from l1       84691082021    # 8.38% l2 miss
l2 miss from l1      1604500894     #
l2 hit from l2 pf    14740210877    #
l3 hit from l2 pf    5624516569     #
l3 miss from l2 pf   1721642011     #
instructions         1303230480870  # 62.065 float per 1000 inst
float 512            104            # 0.000 AVX-512 per 1000 inst
float 256            118848212      # 0.091 AVX-256 per 1000 inst
float 128            80766728853    # 61.974 AVX-128 per 1000 inst
float MMX            0              # 0.000 MMX per 1000 inst
float scalar         338            # 0.000 scalar per 1000 inst
Intel metrics also show many branches
elapsed              396.775
on_cpu               0.060          # 0.97 / 16 cores
utime                361.739
stime                21.166
nvcsw                2203           # 51.17%
nivcsw               2102           # 48.83%
inblock              1344           # 3.39/sec
onblock              2976           # 7.50/sec
cpu-clock            382925715780   # 382.926 seconds
task-clock           382930356389   # 382.930 seconds
page faults          14274949       # 37278.186/sec
context switches     6020           # 15.721/sec
cpu migrations       430            # 1.123/sec
major page faults    6              # 0.016/sec
minor page faults    14274943       # 37278.170/sec
alignment faults     0              # 0.000/sec
emulation faults     0              # 0.000/sec
branches             759460727990   # 189.477 branches per 1000 inst
branch misses        1094303570     # 0.14% branch miss
conditional          759460743158   # 189.477 conditional branches per 1000 inst
indirect             50988694116    # 12.721 indirect branches per 1000 inst
slots                8587423249148  #
retiring             3904258871034  # 45.5% (45.5%)
-- ucode             352967547446   #     4.1%
-- fastpath          3551291323588  #    41.4%
frontend             2737042962078  # 31.9% (31.9%)
-- latency           611472582951   #     7.1%
-- bandwidth         2125570379127  #    24.8%
backend              1721573209956  # 20.0% (20.0%)
-- cpu               506032738355   #     5.9%
-- memory            1215540471601  #    14.2%
speculation          235846863912   #  2.7% ( 2.7%)
-- branch mispredict 160947414957   #     1.9%
-- pipeline restart  74899448955    #     0.9%
smt-contention       0              #  0.0% ( 0.0%)
cpu-cycles           1433601238554  # 0.23 GHz
instructions         4003580216381  # 2.79 IPC
l2 access            270788452542   # 67.664 l2 access per 1000 inst
l2 miss              34377572620    # 12.70% l2 miss
Process overview shows this is python driven workload
448 processes
	 94 python3                322.40    21.76
	 68 clinfo                  15.91     6.33
	 38 vulkaninfo               1.13     1.14
	  4 vulkani:disk$0           0.12     0.12
	  6 glxinfo:gdrv0            0.12     0.09
	  6 clang                    0.07     0.05
	  6 php                      0.06     0.07
	  2 llvmpipe-0               0.06     0.06
	  2 llvmpipe-1               0.06     0.06
	  2 llvmpipe-10              0.06     0.06
	  2 llvmpipe-11              0.06     0.06
	  2 llvmpipe-12              0.06     0.06
	  2 llvmpipe-13              0.06     0.06
	  2 llvmpipe-14              0.06     0.06
	  2 llvmpipe-15              0.06     0.06
	  2 llvmpipe-2               0.06     0.06
	  2 llvmpipe-3               0.06     0.06
	  2 llvmpipe-4               0.06     0.06
	  2 llvmpipe-5               0.06     0.06
	  2 llvmpipe-6               0.06     0.06
	  2 llvmpipe-7               0.06     0.06
	  2 llvmpipe-8               0.06     0.06
	  2 llvmpipe-9               0.06     0.06
	  2 glxinfo                  0.06     0.04
	  2 glxinfo:cs0              0.06     0.04
	  2 glxinfo:disk$0           0.06     0.04
	  2 glxinfo:sh0              0.06     0.03
	  2 glxinfo:shlo0            0.06     0.03
	  3 run.sh                   0.03     0.03
	  3 rocminfo                 0.00     0.03
	  1 lspci                    0.00     0.02
	  1 ps                       0.00     0.01
	 83 sh                       0.00     0.00
	 12 gcc                      0.00     0.00
	 11 gsettings                0.00     0.00
	  8 stat                     0.00     0.00
	  8 systemd-detect-          0.00     0.00
	  6 llvm-link                0.00     0.00
	  5 phoronix-test-s          0.00     0.00
	  4 dirname                  0.00     0.00
	  4 gmain                    0.00     0.00
	  3 cat                      0.00     0.00
	  3 numpy                    0.00     0.00
	  2 lscpu                    0.00     0.00
	  2 uname                    0.00     0.00
	  2 which                    0.00     0.00
	  2 xset                     0.00     0.00
	  1 cc                       0.00     0.00
	  1 date                     0.00     0.00
	  1 dconf worker             0.00     0.00
	  1 dmesg                    0.00     0.00
	  1 dmidecode                0.00     0.00
	  1 grep                     0.00     0.00
	  1 ifconfig                 0.00     0.00
	  1 ip                       0.00     0.00
	  1 lsmod                    0.00     0.00
	  1 mktemp                   0.00     0.00
	  1 python                   0.00     0.00
	  1 qdbus                    0.00     0.00
	  1 readlink                 0.00     0.00
	  1 realpath                 0.00     0.00
	  1 sed                      0.00     0.00
	  1 sort                     0.00     0.00
	  1 stty                     0.00     0.00
	  1 systemctl                0.00     0.00
	  1 template.sh              0.00     0.00
	  1 wc                       0.00     0.00
	  1 xrandr                   0.00     0.00
0 processes running
47 maximum processes
Looks like a set of small python tests run in sequence.
      2560738) numpy            cpu=9 start=5.76  finish=119.95
        2560739) run.sh           cpu=2 start=5.76  finish=119.94
          2560740) dirname          cpu=12 start=5.79  finish=5.79
          2560741) python3          cpu=3 start=5.79  finish=6.55
          2560742) python3          cpu=5 start=6.55  finish=7.90
          2560743) python3          cpu=11 start=7.90  finish=8.75
          2560744) python3          cpu=11 start=8.75  finish=11.64
          2560745) python3          cpu=4 start=11.65 finish=11.80
          2560746) python3          cpu=6 start=11.80 finish=15.29
          2560748) python3          cpu=3 start=15.30 finish=15.64
          2560749) python3          cpu=4 start=15.65 finish=16.14
          2560750) python3          cpu=3 start=16.14 finish=16.39
          2560751) python3          cpu=4 start=16.39 finish=16.66
          2560752) python3          cpu=3 start=16.66 finish=18.28
          2560753) python3          cpu=4 start=18.28 finish=25.17
          2560754) python3          cpu=5 start=25.17 finish=30.43
          2560755) python3          cpu=3 start=30.43 finish=32.69
          2560756) python3          cpu=4 start=32.69 finish=40.84
          2560757) python3          cpu=5 start=40.85 finish=43.38
          2560758) python3          cpu=11 start=43.38 finish=44.33
          2560759) python3          cpu=4 start=44.33 finish=45.02
          2560760) python3          cpu=5 start=45.02 finish=46.48
          2560761) python3          cpu=3 start=46.49 finish=47.16
          2560762) python3          cpu=4 start=47.16 finish=49.62
          2560763) python3          cpu=11 start=49.62 finish=49.70
          2560764) python3          cpu=4 start=49.70 finish=50.16
          2560765) python3          cpu=11 start=50.16 finish=50.22
          2560766) python3          cpu=4 start=50.22 finish=50.44
          2560767) python3          cpu=11 start=50.45 finish=56.22
          2560768) python3          cpu=4 start=56.22 finish=116.88
          2560769) python3          cpu=11 start=116.89 finish=117.22
          2560770) python3          cpu=4 start=117.22 finish=118.51
          2560771) python3          cpu=3 start=118.52 finish=119.94
        2560772) cat              cpu=2 start=119.94 finish=119.94
        2560773) python3          cpu=3 start=119.94 finish=119.95