
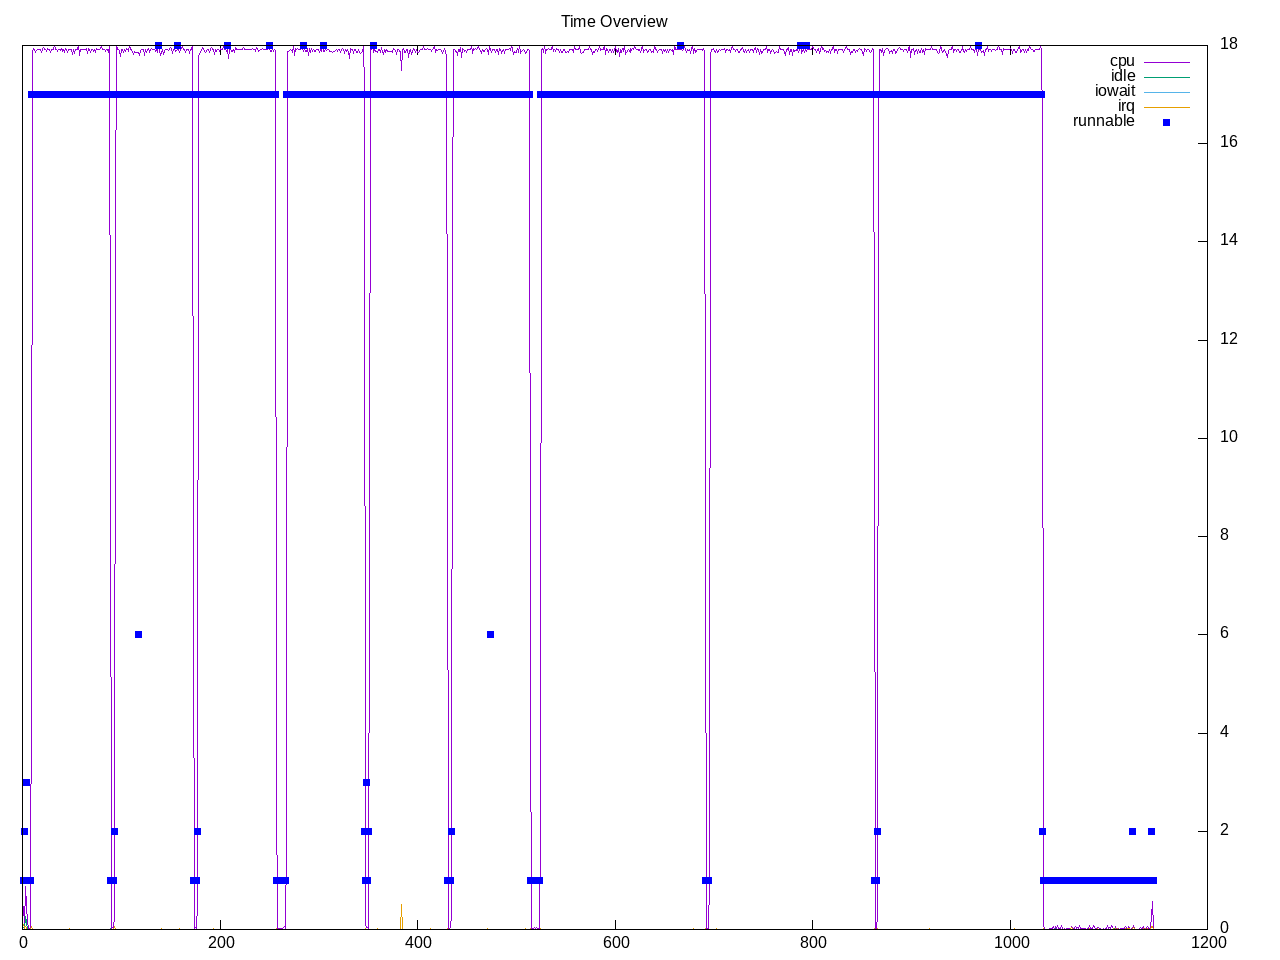
Open Image Denoise library for ray-tracing and part of the oneAPI rendering toolkit. There are three tests that run on the CPU. On AMD the hip and SYCL tests fail. Looks like the six failures may be that single-threaded segment at the end.
Topdown profile is dominated by backend stalls.
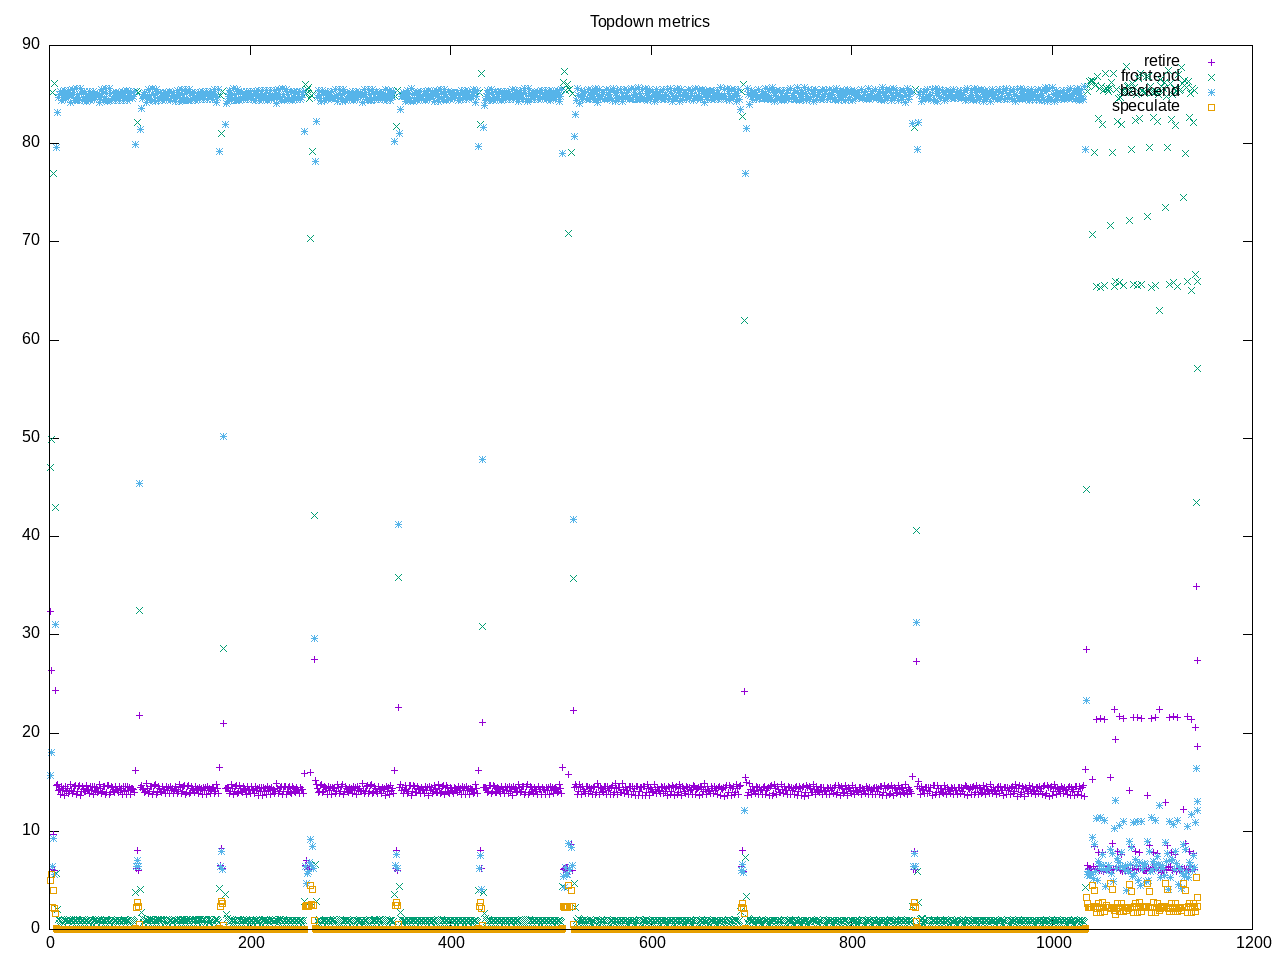
AMD metrics show little floating point. Backend stalls are cpu-bound not memory bound. Frontend stalls are very low.
elapsed              1143.453
on_cpu               0.852          # 13.64 / 16 cores
utime                15569.790
stime                24.394
nvcsw                137174         # 47.97%
nivcsw               148800         # 52.03%
inblock              8              # 0.01/sec
onblock              13656          # 11.94/sec
cpu-clock            15595849921789 # 15595.850 seconds
task-clock           15596082503631 # 15596.083 seconds
page faults          7315810        # 469.080/sec
context switches     291471         # 18.689/sec
cpu migrations       931            # 0.060/sec
major page faults    57             # 0.004/sec
minor page faults    7315753        # 469.076/sec
alignment faults     0              # 0.000/sec
emulation faults     0              # 0.000/sec
branches             202447109427   # 4.901 branches per 1000 inst
branch misses        2965059032     # 1.46% branch miss
conditional          185803354842   # 4.498 conditional branches per 1000 inst
indirect             786178808      # 0.019 indirect branches per 1000 inst
cpu-cycles           62242756524025 # 3.39 GHz
instructions         41309080431827 # 0.66 IPC low
slots                124479064490070 #
retiring             14028040556278 # 11.3% (14.2%)
-- ucode             4540852651     #     0.0%
-- fastpath          14023499703627 #    11.3%
frontend             903299780714   #  0.7% ( 0.9%) low
-- latency           805847673036   #     0.6%
-- bandwidth         97452107678    #     0.1%
backend              83506378748576 # 67.1% (84.8%) high
-- cpu               72430204392186 #    58.2%
-- memory            11076174356390 #     8.9%
speculation          23559215421    #  0.0% ( 0.0%) low
-- branch mispredict 19678376604    #     0.0%
-- pipeline restart  3880838817     #     0.0%
smt-contention       26017722604434 # 20.9% ( 0.0%)
cpu-cycles           62237080562275 # 3.38 GHz
instructions         41309704710978 # 0.66 IPC low
instructions         13768582732070 # 125.298 l2 access per 1000 inst
l2 hit from l1       1477657932786  # 4.28% l2 miss
l2 miss from l1      13861287643    #
l2 hit from l2 pf    187554180525   #
l3 hit from l2 pf    20200972860    #
l3 miss from l2 pf   39763266084    #
instructions         13770331503339 # 6.083 float per 1000 inst
float 512            108            # 0.000 AVX-512 per 1000 inst
float 256            1120053095     # 0.081 AVX-256 per 1000 inst
float 128            82649393722    # 6.002 AVX-128 per 1000 inst
float MMX            0              # 0.000 MMX per 1000 inst
float scalar         0              # 0.000 scalar per 1000 inst
instructions         2655157        #
opcache              985914         # 371.320 opcache per 1000 inst
opcache miss         525657         # 53.3% opcache miss rate
l1 dTLB miss         5852           # 2.204 L1 dTLB per 1000 inst
l2 dTLB miss         1012           # 0.381 L2 dTLB per 1000 inst
instructions         2809369        #
icache               1346399        # 479.253 icache per 1000 inst
icache miss          118242         #  8.8% icache miss rate
l1 iTLB miss         13             # 0.005 L1 iTLB per 1000 inst
l2 iTLB miss         0              # 0.000 L2 iTLB per 1000 inst
tlb flush            19             # 0.007 TLB flush per 1000 inst
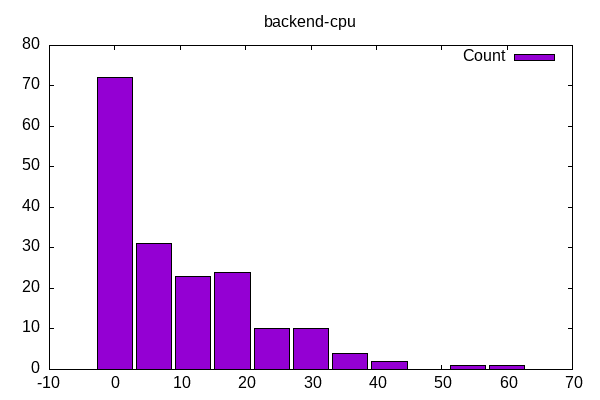
CPU stalls of 58% are almost as high as minibude (64%) and much above the mean with both showing up as outliers on the distribution.
Intel metrics show most memory is L1 with only 2.4% dram.
elapsed              1784.190
on_cpu               0.919          # 14.71 / 16 cores
utime                26221.932
stime                21.883
nvcsw                228045         # 48.75%
nivcsw               239714         # 51.25%
inblock              18752          # 10.51/sec
onblock              1800           # 1.01/sec
cpu-clock            26244075480642 # 26244.075 seconds
task-clock           26244333593954 # 26244.334 seconds
page faults          8712850        # 331.990/sec
context switches     476473         # 18.155/sec
cpu migrations       30947          # 1.179/sec
major page faults    161            # 0.006/sec
minor page faults    8712689        # 331.984/sec
alignment faults     0              # 0.000/sec
emulation faults     0              # 0.000/sec
branches             1321680383971  # 12.574 branches per 1000 inst
branch misses        2731388696     # 0.21% branch miss
conditional          1321680401059  # 12.574 conditional branches per 1000 inst
indirect             358569107192   # 3.411 indirect branches per 1000 inst
slots                98943282613106 #
retiring             49432693869376 # 50.0% (50.0%)
-- ucode             563001550256   #     0.6%
-- fastpath          48869692319120 #    49.4%
frontend             22964816174943 # 23.2% (23.2%)
-- latency           22183147237452 #    22.4%
-- bandwidth         781668937491   #     0.8%
backend              25631568005899 # 25.9% (25.9%)
-- cpu               13970973300638 #    14.1%
-- memory            11660594705261 #    11.8%
speculation          398396612737   #  0.4% ( 0.4%) low
-- branch mispredict 281168117116   #     0.3%
-- pipeline restart  117228495621   #     0.1%
smt-contention       0              #  0.0% ( 0.0%)
cpu-cycles           64601012956599 # 2.60 GHz
instructions         103400515861605 # 1.60 IPC
l2 access            803899147867   # 15.693 l2 access per 1000 inst
l2 miss              186431498354   # 23.19% l2 miss
cpu-cycles           32018963882436 # 26.2% memory latency
load stalls          8267191766134  # 20.3% l1 bound
l1 miss              1767537943547  #  1.8% l2 bound
l2 miss              1198804839203  #  1.4% l3 bound
l3 miss              759185998010   #  2.4% dram bound
store_stalls         128410516875   #  0.4% store bound
Process summary shows time spent in the benchmark application.
592 processes
	200 oidnBenchmark        236248.38   341.85
	 68 clinfo                  19.50     6.32
	 38 vulkaninfo               1.34     1.35
	  4 vulkani:disk$0           0.15     0.15
	  6 glxinfo:gdrv0            0.15     0.07
	  6 glxinfo:gl0              0.15     0.07
	  6 php                      0.13     0.28
	  2 llvmpipe-0               0.08     0.07
	  2 llvmpipe-1               0.08     0.07
	  2 llvmpipe-10              0.08     0.07
	  2 llvmpipe-11              0.08     0.07
	  2 llvmpipe-12              0.08     0.07
	  2 llvmpipe-13              0.08     0.07
	  2 llvmpipe-14              0.08     0.07
	  2 llvmpipe-15              0.08     0.07
	  2 llvmpipe-2               0.08     0.07
	  2 llvmpipe-3               0.08     0.07
	  2 llvmpipe-4               0.08     0.07
	  2 llvmpipe-5               0.08     0.07
	  2 llvmpipe-6               0.08     0.07
	  2 llvmpipe-7               0.08     0.07
	  2 llvmpipe-8               0.08     0.07
	  2 llvmpipe-9               0.08     0.07
	  2 glxinfo                  0.07     0.03
	  2 glxinfo:cs0              0.07     0.03
	  2 glxinfo:disk$0           0.07     0.03
	  2 glxinfo:sh0              0.07     0.03
	  2 glxinfo:shlo0            0.07     0.03
	  6 clang                    0.06     0.05
	  3 rocminfo                 0.03     0.03
	  1 lspci                    0.01     0.02
	 85 sh                       0.00     0.00
	 27 oidn                     0.00     0.00
	 12 gcc                      0.00     0.00
	 10 gsettings                0.00     0.00
	  8 stat                     0.00     0.00
	  8 systemd-detect-          0.00     0.00
	  6 llvm-link                0.00     0.00
	  5 phoronix-test-s          0.00     0.00
	  4 gmain                    0.00     0.00
	  2 dconf worker             0.00     0.00
	  2 lscpu                    0.00     0.00
	  2 uname                    0.00     0.00
	  2 which                    0.00     0.00
	  2 xset                     0.00     0.00
	  1 cc                       0.00     0.00
	  1 date                     0.00     0.00
	  1 dirname                  0.00     0.00
	  1 dmesg                    0.00     0.00
	  1 dmidecode                0.00     0.00
	  1 grep                     0.00     0.00
	  1 ifconfig                 0.00     0.00
	  1 ip                       0.00     0.00
	  1 lsmod                    0.00     0.00
	  1 mktemp                   0.00     0.00
	  1 ps                       0.00     0.00
	  1 qdbus                    0.00     0.00
	  1 readlink                 0.00     0.00
	  1 realpath                 0.00     0.00
	  1 sed                      0.00     0.00
	  1 sort                     0.00     0.00
	  1 stty                     0.00     0.00
	  1 systemctl                0.00     0.00
	  1 template.sh              0.00     0.00
	  1 wc                       0.00     0.00
	  1 xrandr                   0.00     0.00
16 processes running
63 maximum processes
Computation blocks show a similar pattern
      8061) oidn             cpu=1 start=89.65 finish=169.60
        8062) oidnBenchmark    cpu=10 start=89.65 finish=169.58
          8065) oidnBenchmark    cpu=12 start=89.68 finish=169.58
          8066) oidnBenchmark    cpu=5 start=89.68 finish=89.68
          8067) oidnBenchmark    cpu=15 start=90.14 finish=169.58
            8068) oidnBenchmark    cpu=5 start=90.14 finish=169.58
              8070) oidnBenchmark    cpu=3 start=90.14 finish=169.58
                8075) ?? cpu=0 start=90.14 finish=0.00
                  8078) ?? cpu=0 start=90.14 finish=0.00
                8077) oidnBenchmark    cpu=14 start=90.14 finish=169.58
              8074) oidnBenchmark    cpu=11 start=90.14 finish=169.58
            8072) oidnBenchmark    cpu=1 start=90.14 finish=169.58
              8076) oidnBenchmark    cpu=13 start=90.14 finish=169.58
              8079) oidnBenchmark    cpu=8 start=90.14 finish=169.58
          8069) oidnBenchmark    cpu=10 start=90.14 finish=169.58
            8071) oidnBenchmark    cpu=9 start=90.14 finish=169.58
              8080) oidnBenchmark    cpu=6 start=90.14 finish=169.58
              8081) oidnBenchmark    cpu=7 start=90.14 finish=169.58
            8073) oidnBenchmark    cpu=0 start=90.14 finish=169.58