
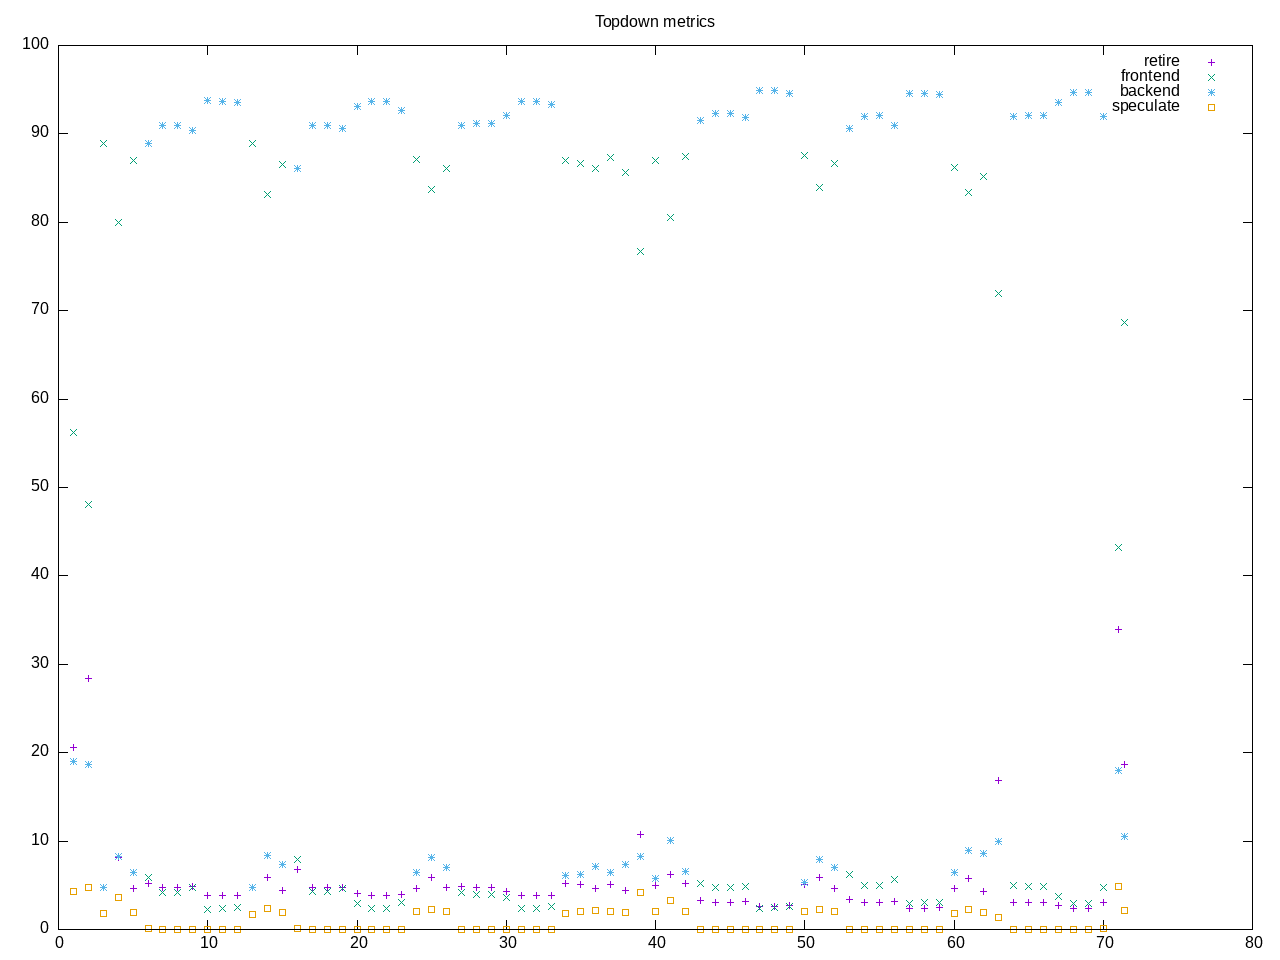
onednn is a neural network library, in this test convolution. Except for Stream, this is the most memory-bound application I observe. There are a few data points of front-end misses but overall frontend is low.
AMD metrics show only 50% on cpu. Not much floating point (despite this being listed as f32 and u8/i8 test. Very low IPC and high L2 misses.
elapsed              71.340
on_cpu               0.508          # 8.13 / 16 cores
utime                577.606
stime                2.283
nvcsw                2933           # 21.82%
nivcsw               10507          # 78.18%
inblock              7824           # 109.67/sec
onblock              1808           # 25.34/sec
cpu-clock            580267448241   # 580.267 seconds
task-clock           580293281735   # 580.293 seconds
page faults          917435         # 1580.985/sec
context switches     13603          # 23.442/sec
cpu migrations       355            # 0.612/sec
major page faults    101            # 0.174/sec
minor page faults    917334         # 1580.811/sec
alignment faults     0              # 0.000/sec
emulation faults     0              # 0.000/sec
branches             14973262484    # 27.616 branches per 1000 inst
branch misses        247963050      # 1.66% branch miss
conditional          12771157805    # 23.555 conditional branches per 1000 inst
indirect             148342180      # 0.274 indirect branches per 1000 inst
cpu-cycles           2780469655011  # 2.44 GHz
instructions         543789492995   # 0.20 IPC
slots                5553310978572  #
retiring             189704440465   #  3.4% ( 3.6%)
-- ucode             965399781      #     0.0%
-- fastpath          188739040684   #     3.4%
frontend             200601330078   #  3.6% ( 3.8%)
-- latency           172522010298   #     3.1%
-- bandwidth         28079319780    #     0.5%
backend              4904067730753  # 88.3% (92.6%)
-- cpu               843972890978   #    15.2%
-- memory            4060094839775  #    73.1%
speculation          1460554868     #  0.0% ( 0.0%)
-- branch mispredict 1317644471     #     0.0%
-- pipeline restart  142910397      #     0.0%
smt-contention       257472348837   #  4.6% ( 0.0%)
cpu-cycles           2780748578640  # 2.29 GHz
instructions         542814219642   # 0.20 IPC
instructions         181076126057   # 50.266 l2 access per 1000 inst
l2 hit from l1       6471351931     # 44.79% l2 miss
l2 miss from l1      2012992425     #
l2 hit from l2 pf    566893824      #
l3 hit from l2 pf    538088144      #
l3 miss from l2 pf   1525658477     #
instructions         181285666295   # 4.541 float per 1000 inst
float 512            62             # 0.000 AVX-512 per 1000 inst
float 256            314            # 0.000 AVX-256 per 1000 inst
float 128            823292867      # 4.541 AVX-128 per 1000 inst
float MMX            0              # 0.000 MMX per 1000 inst
float scalar         0              # 0.000 scalar per 1000 inst
Intel metrics also confirm this is a short-running workload.
elapsed              70.776
on_cpu               0.515          # 8.24 / 16 cores
utime                581.506
stime                1.509
nvcsw                2728           # 29.18%
nivcsw               6621           # 70.82%
inblock              35816          # 506.05/sec
onblock              1888           # 26.68/sec
cpu-clock            583151242836   # 583.151 seconds
task-clock           583163697663   # 583.164 seconds
page faults          913034         # 1565.656/sec
context switches     9520           # 16.325/sec
cpu migrations       476            # 0.816/sec
major page faults    197            # 0.338/sec
minor page faults    912837         # 1565.319/sec
alignment faults     0              # 0.000/sec
emulation faults     0              # 0.000/sec
branches             24742585163    # 27.518 branches per 1000 inst
branch misses        55106113       # 0.22% branch miss
conditional          24742600267    # 27.518 conditional branches per 1000 inst
indirect             8415132396     # 9.359 indirect branches per 1000 inst
slots                3324114012128  #
retiring             466162249004   # 14.0% (14.0%)
-- ucode             10119389453    #     0.3%
-- fastpath          456042859551   #    13.7%
frontend             180764613017   #  5.4% ( 5.4%)
-- latency           156300290055   #     4.7%
-- bandwidth         24464322962    #     0.7%
backend              2669530026167  # 80.3% (80.3%)
-- cpu               436293792636   #    13.1%
-- memory            2233236233531  #    67.2%
speculation          5291484831     #  0.2% ( 0.2%)
-- branch mispredict 3942250602     #     0.1%
-- pipeline restart  1349234229     #     0.0%
smt-contention       0              #  0.0% ( 0.0%)
cpu-cycles           1100899965042  # 0.97 GHz
instructions         454783623331   # 0.41 IPC
l2 access            10699740373    # 23.529 l2 access per 1000 inst
l2 miss              6241519885     # 58.33% l2 miss
Process shows time spent in benchdnn
454 processes
	 96 benchdnn              9231.20    22.88
	 64 clinfo                  10.88     3.96
	 38 vulkaninfo               0.76     1.14
	  6 glxinfo:gdrv0            0.11     0.09
	  4 vulkani:disk$0           0.08     0.12
	  6 php                      0.06     0.09
	  6 clang                    0.05     0.03
	  2 glxinfo                  0.05     0.03
	  2 glxinfo:cs0              0.05     0.03
	  2 glxinfo:disk$0           0.05     0.03
	  2 glxinfo:sh0              0.05     0.03
	  2 glxinfo:shlo0            0.05     0.03
	  2 llvmpipe-0               0.04     0.06
	  2 llvmpipe-1               0.04     0.06
	  2 llvmpipe-10              0.04     0.06
	  2 llvmpipe-11              0.04     0.06
	  2 llvmpipe-12              0.04     0.06
	  2 llvmpipe-13              0.04     0.06
	  2 llvmpipe-14              0.04     0.06
	  2 llvmpipe-15              0.04     0.06
	  2 llvmpipe-2               0.04     0.06
	  2 llvmpipe-3               0.04     0.06
	  2 llvmpipe-4               0.04     0.06
	  2 llvmpipe-5               0.04     0.06
	  2 llvmpipe-6               0.04     0.06
	  2 llvmpipe-7               0.04     0.06
	  2 llvmpipe-8               0.04     0.06
	  2 llvmpipe-9               0.04     0.06
	  1 lspci                    0.01     0.03
	 90 sh                       0.00     0.00
	 13 gcc                      0.00     0.00
	 10 gsettings                0.00     0.00
	  9 stty                     0.00     0.00
	  8 stat                     0.00     0.00
	  8 systemd-detect-          0.00     0.00
	  6 llvm-link                0.00     0.00
	  6 onednn                   0.00     0.00
	  5 phoronix-test-s          0.00     0.00
	  4 gmain                    0.00     0.00
	  2 cc                       0.00     0.00
	  2 dconf worker             0.00     0.00
	  2 lscpu                    0.00     0.00
	  2 uname                    0.00     0.00
	  2 which                    0.00     0.00
	  2 xset                     0.00     0.00
	  1 date                     0.00     0.00
	  1 dirname                  0.00     0.00
	  1 dmesg                    0.00     0.00
	  1 dmidecode                0.00     0.00
	  1 grep                     0.00     0.00
	  1 ifconfig                 0.00     0.00
	  1 ip                       0.00     0.00
	  1 lsmod                    0.00     0.00
	  1 mktemp                   0.00     0.00
	  1 ps                       0.00     0.00
	  1 qdbus                    0.00     0.00
	  1 readlink                 0.00     0.00
	  1 realpath                 0.00     0.00
	  1 sed                      0.00     0.00
	  1 sort                     0.00     0.00
	  1 systemctl                0.00     0.00
	  1 template.sh              0.00     0.00
	  1 wc                       0.00     0.00
	  1 xrandr                   0.00     0.00
1 processes running
48 maximum processes
Computation core starts benchmark threads on all cpus.
      454702) onednn           cpu=0 start=15.52 finish=21.76
        454703) benchdnn         cpu=8 start=15.53 finish=21.75
          454704) benchdnn         cpu=0 start=15.56 finish=21.75
          454705) benchdnn         cpu=9 start=15.56 finish=21.75
          454706) benchdnn         cpu=1 start=15.56 finish=21.75
          454707) benchdnn         cpu=10 start=15.56 finish=21.75
          454708) benchdnn         cpu=2 start=15.56 finish=21.75
          454709) benchdnn         cpu=11 start=15.56 finish=21.75
          454710) benchdnn         cpu=3 start=15.56 finish=21.75
          454711) benchdnn         cpu=12 start=15.56 finish=21.75
          454712) benchdnn         cpu=4 start=15.56 finish=21.75
          454713) benchdnn         cpu=13 start=15.56 finish=21.75
          454714) benchdnn         cpu=5 start=15.56 finish=21.75
          454715) benchdnn         cpu=14 start=15.56 finish=21.75
          454716) benchdnn         cpu=6 start=15.56 finish=21.75
          454717) benchdnn         cpu=15 start=15.56 finish=21.75
          454718) benchdnn         cpu=7 start=15.56 finish=21.75