
Eight different built-in benchmarks for opencv operations. Looks like a mixture of single-threaded and multi-core tests. Some of them take some time to stabilize so get run more than three times.

Topdown shows a mixture of profiles depending on the test.
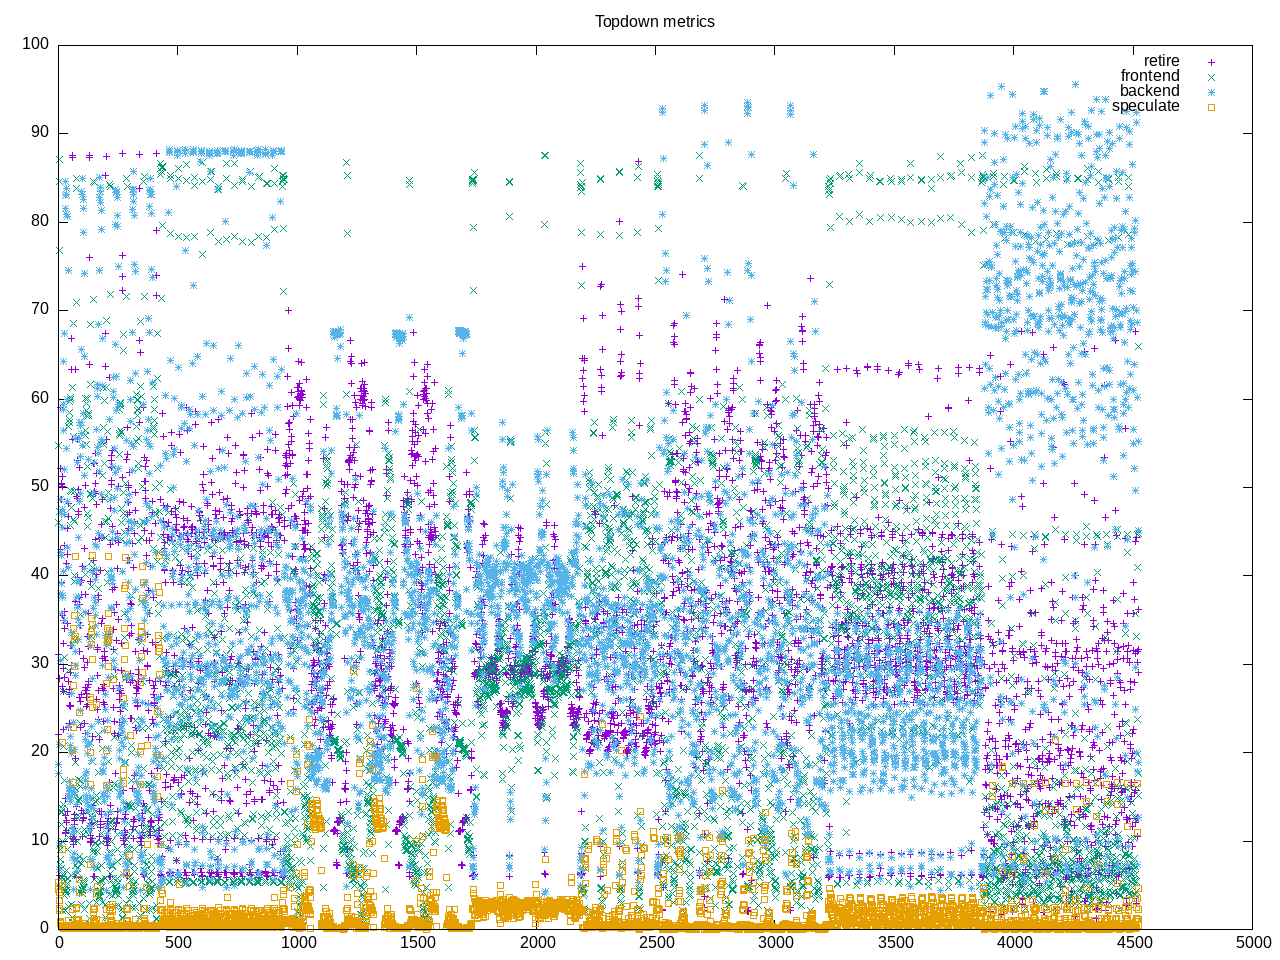
AMD metrics reflect mixture of on-core behavior. Generally floating point code with a small amount of L2 access and moderate branches.
elapsed              4652.674
on_cpu               0.387          # 6.20 / 16 cores
utime                22478.001
stime                6365.386
nvcsw                4855478        # 73.46%
nivcsw               1753786        # 26.54%
inblock              8              # 0.00/sec
onblock              117920         # 25.34/sec
cpu-clock            28815667699825 # 28815.668 seconds
task-clock           28821382684850 # 28821.383 seconds
page faults          307497285      # 10669.068/sec
context switches     6632219        # 230.115/sec
cpu migrations       37169          # 1.290/sec
major page faults    294            # 0.010/sec
minor page faults    307496991      # 10669.058/sec
alignment faults     0              # 0.000/sec
emulation faults     0              # 0.000/sec
branches             16403069524758 # 106.832 branches per 1000 inst
branch misses        828455317656   # 5.05% branch miss
conditional          11923539266664 # 77.657 conditional branches per 1000 inst
indirect             422732816500   # 2.753 indirect branches per 1000 inst
cpu-cycles           134335559445133 # 1.71 GHz
instructions         177139632100759 # 1.32 IPC
slots                268758248314950 #
retiring             61647781137976 # 22.9% (29.1%)
-- ucode             124149216346   #     0.0%
-- fastpath          61523631921630 #    22.9%
frontend             54787629853380 # 20.4% (25.9%)
-- latency           41293315615422 #    15.4%
-- bandwidth         13494314237958 #     5.0%
backend              91911217413741 # 34.2% (43.4%)
-- cpu               34999936609993 #    13.0%
-- memory            56911280803748 #    21.2%
speculation          3311643758552  #  1.2% ( 1.6%)
-- branch mispredict 3291586145649  #     1.2%
-- pipeline restart  20057612903    #     0.0%
smt-contention       57099414604412 # 21.2% ( 0.0%)
cpu-cycles           91565832999745 # 1.60 GHz
instructions         125015233884237 # 1.37 IPC
instructions         41670344100784 # 34.699 l2 access per 1000 inst
l2 hit from l1       886460797566   # 20.52% l2 miss
l2 miss from l1      64299878440    #
l2 hit from l2 pf    327036437902   #
l3 hit from l2 pf    175255051987   #
l3 miss from l2 pf   57158618370    #
instructions         41599072769052 # 265.827 float per 1000 inst
float 512            93             # 0.000 AVX-512 per 1000 inst
float 256            4009590064     # 0.096 AVX-256 per 1000 inst
float 128            11054155455194 # 265.731 AVX-128 per 1000 inst
float MMX            0              # 0.000 MMX per 1000 inst
float scalar         0              # 0.000 scalar per 1000 inst
Intel metrics
elapsed              8929.748
on_cpu               0.302          # 4.83 / 16 cores
utime                35037.226
stime                8114.568
nvcsw                16144279       # 65.79%
nivcsw               8396621        # 34.21%
inblock              92520          # 10.36/sec
onblock              84432          # 9.46/sec
cpu-clock            42918505907879 # 42918.506 seconds
task-clock           42933876988368 # 42933.877 seconds
page faults          789930954      # 18398.780/sec
context switches     24585261       # 572.631/sec
cpu migrations       714157         # 16.634/sec
major page faults    810            # 0.019/sec
minor page faults    789930144      # 18398.761/sec
alignment faults     0              # 0.000/sec
emulation faults     0              # 0.000/sec
branches             26769265019370 # 123.191 branches per 1000 inst
branch misses        171790003420   # 0.64% branch miss
conditional          26769265226570 # 123.191 conditional branches per 1000 inst
indirect             6811153187756  # 31.345 indirect branches per 1000 inst
slots                316190860328552 #
retiring             152939542929502 # 48.4% (48.4%)
-- ucode             15947069922576 #     5.0%
-- fastpath          136992473006926 #    43.3%
frontend             41215234315610 # 13.0% (13.0%)
-- latency           23077500486912 #     7.3%
-- bandwidth         18137733828698 #     5.7%
backend              105108579100965 # 33.2% (33.2%)
-- cpu               48161090633115 #    15.2%
-- memory            56947488467850 #    18.0%
speculation          20264503084589 #  6.4% ( 6.4%)
-- branch mispredict 19084866553039 #     6.0%
-- pipeline restart  1179636531550  #     0.4%
smt-contention       0              #  0.0% ( 0.0%)
cpu-cycles           169947932831273 # 0.98 GHz
instructions         307478565821240 # 1.81 IPC
l2 access            4221508301051  # 24.988 l2 access per 1000 inst
l2 miss              1732467749070  # 41.04% l2 miss
Process summary, this crashed partway through so not a full reflection. From the names, looks like a different executable for each test.
5843 processes
	1200 opencv_perf_gap      1427508.34 348263.04
	3840 opencv_perf_vid      348468.47 88338.60
	 48 opencv_perf_img      67596.32 17327.20
	240 opencv_perf_obj      27428.01 12202.04
	 48 opencv_perf_dnn      18839.04  1405.28
	 48 opencv_perf_fea      18809.28  9131.84
	 48 opencv_perf_sti      14596.96  8618.88
	 64 opencv_perf_cor       8730.40  6199.36
	 34 clinfo                   9.59     3.66
	 19 vulkaninfo               0.95     0.38
	  2 vulkani:disk$0           0.10     0.04
	  6 clang                    0.09     0.03
	  3 glxinfo:gdrv0            0.07     0.06
	  1 llvmpipe-0               0.05     0.02
	  1 llvmpipe-1               0.05     0.02
	  1 llvmpipe-10              0.05     0.02
	  1 llvmpipe-11              0.05     0.02
	  1 llvmpipe-12              0.05     0.02
	  1 llvmpipe-13              0.05     0.02
	  1 llvmpipe-14              0.05     0.02
	  1 llvmpipe-15              0.05     0.02
	  1 llvmpipe-2               0.05     0.02
	  1 llvmpipe-3               0.05     0.02
	  1 llvmpipe-4               0.05     0.02
	  1 llvmpipe-5               0.05     0.02
	  1 llvmpipe-6               0.05     0.02
	  1 llvmpipe-7               0.05     0.02
	  1 llvmpipe-8               0.05     0.02
	  1 llvmpipe-9               0.05     0.02
	  1 glxinfo                  0.03     0.02
	  1 glxinfo:cs0              0.03     0.02
	  1 glxinfo:disk$0           0.03     0.02
	  1 glxinfo:sh0              0.03     0.02
	  1 glxinfo:shlo0            0.03     0.02
	  1 ps                       0.00     0.01
	 72 sh                       0.00     0.00
	 49 opencv                   0.00     0.00
	 13 gcc                      0.00     0.00
	  8 systemd-detect-          0.00     0.00
	  7 stat                     0.00     0.00
	  6 gsettings                0.00     0.00
	  6 llvm-link                0.00     0.00
	  5 gmain                    0.00     0.00
	  4 dconf worker             0.00     0.00
	  4 phoronix-test-s          0.00     0.00
	  2 which                    0.00     0.00
	  1 cc                       0.00     0.00
	  1 date                     0.00     0.00
	  1 dirname                  0.00     0.00
	  1 grep                     0.00     0.00
	  1 ifconfig                 0.00     0.00
	  1 ip                       0.00     0.00
	  1 lscpu                    0.00     0.00
	  1 mktemp                   0.00     0.00
	  1 qdbus                    0.00     0.00
	  1 readlink                 0.00     0.00
	  1 realpath                 0.00     0.00
	  1 sed                      0.00     0.00
	  1 sort                     0.00     0.00
	  1 stty                     0.00     0.00
	  1 systemctl                0.00     0.00
	  1 template.sh              0.00     0.00
	  1 wc                       0.00     0.00
	  1 xrandr                   0.00     0.00
	  1 xset                     0.00     0.00
26 processes running
47 maximum processes
A typical launch pattern with one process per core.
      1945253) opencv           cpu=0 start=142.15 finish=208.66
        1945254) opencv_perf_cor  cpu=9 start=142.15 finish=208.65
          1945255) opencv_perf_cor  cpu=11 start=142.17 finish=208.65
          1945256) opencv_perf_cor  cpu=12 start=142.17 finish=208.65
          1945257) opencv_perf_cor  cpu=4 start=142.17 finish=208.65
          1945258) opencv_perf_cor  cpu=5 start=142.17 finish=208.65
          1945259) opencv_perf_cor  cpu=8 start=142.17 finish=208.65
          1945260) opencv_perf_cor  cpu=14 start=142.17 finish=208.65
          1945261) opencv_perf_cor  cpu=10 start=142.17 finish=208.65
          1945262) opencv_perf_cor  cpu=0 start=142.17 finish=208.65
          1945263) opencv_perf_cor  cpu=13 start=142.17 finish=208.65
          1945264) opencv_perf_cor  cpu=6 start=142.17 finish=208.65
          1945265) opencv_perf_cor  cpu=15 start=142.17 finish=208.65
          1945266) opencv_perf_cor  cpu=7 start=142.17 finish=208.65
          1945267) opencv_perf_cor  cpu=2 start=142.17 finish=208.65
          1945268) opencv_perf_cor  cpu=3 start=142.17 finish=208.65
          1945269) opencv_perf_cor  cpu=1 start=142.17 finish=208.65