
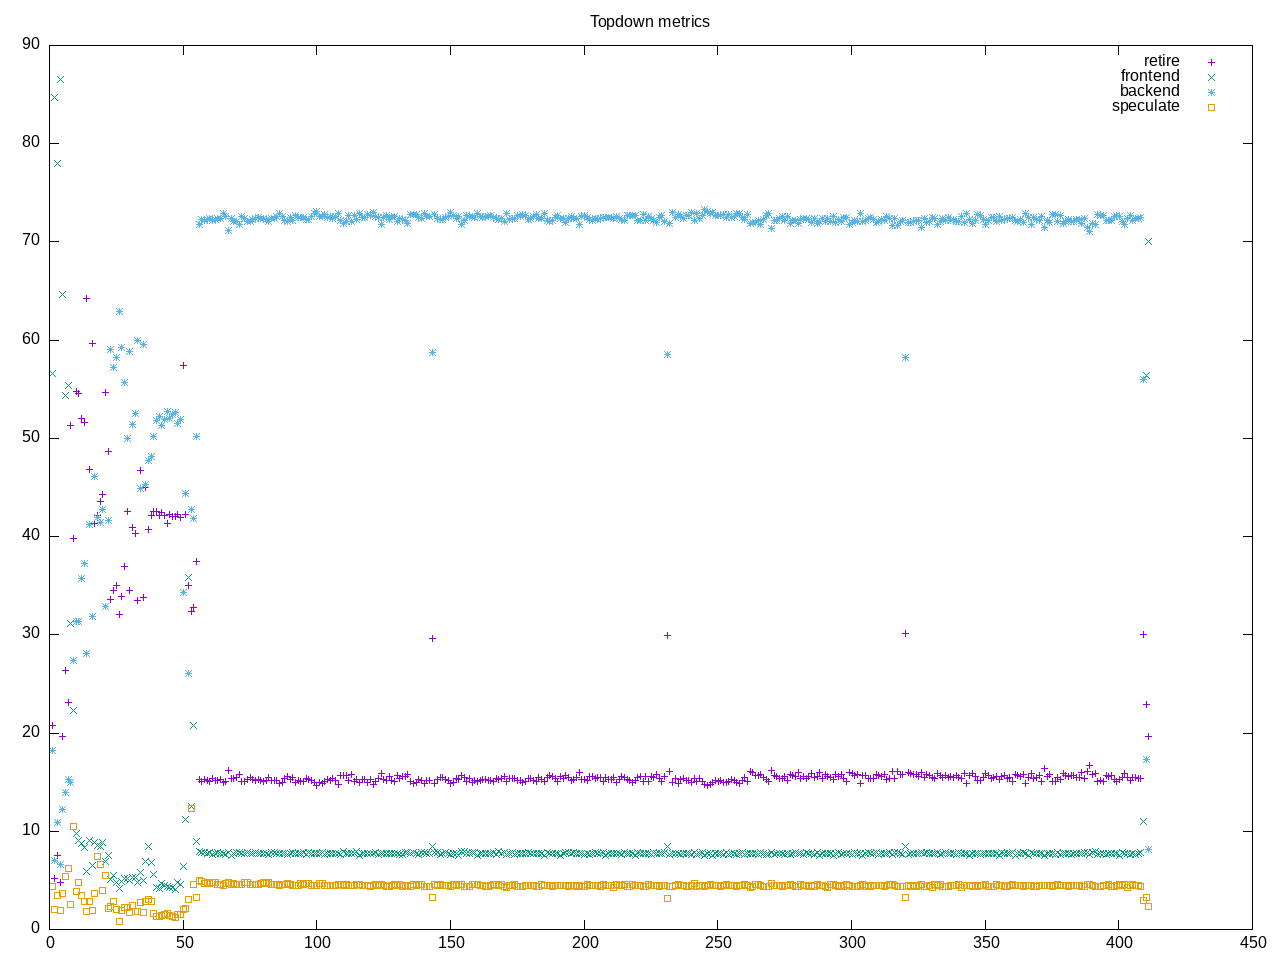
OpenFoam CFD program has several different sized models. I picked the second smallest but it would be interesting to see what happens are we scale to larger models. After a startup period, the overall running time is dominated by backend activity with memory being ~2x that of cpu.
The AMD metrics below. We seem to use only 1/2 of the cores. This is somewhat branchy code and branch mis-predicts are slightly higher than normal. It is also floating point code.
elapsed              411.853
on_cpu               0.485          # 7.77 / 16 cores
utime                3116.981
stime                81.863
nvcsw                55573          # 85.56%
nivcsw               9381           # 14.44%
inblock              274000         # 665.29/sec
onblock              771784         # 1873.93/sec
cpu-clock            3198390654945  # 3198.391 seconds
task-clock           3198522379496  # 3198.522 seconds
page faults          28886234       # 9031.118/sec
context switches     66207          # 20.699/sec
cpu migrations       5928           # 1.853/sec
major page faults    5779           # 1.807/sec
minor page faults    28880455       # 9029.312/sec
alignment faults     0              # 0.000/sec
emulation faults     0              # 0.000/sec
branches             1953073862036  # 123.095 branches per 1000 inst
branch misses        36594044022    # 1.87% branch miss
conditional          1498320940542  # 94.434 conditional branches per 1000 inst
indirect             81449302162    # 5.133 indirect branches per 1000 inst
cpu-cycles           14728766760104 # 2.24 GHz
instructions         15750869300593 # 1.07 IPC
slots                29456694670128 #
retiring             5325501761058  # 18.1% (18.1%)
-- ucode             3259869641     #     0.0%
-- fastpath          5322241891417  #    18.1%
frontend             2275208597330  #  7.7% ( 7.7%)
-- latency           1559401842588  #     5.3%
-- bandwidth         715806754742   #     2.4%
backend              20565968541167 # 69.8% (69.9%)
-- cpu               3818610930354  #    13.0%
-- memory            16747357610813 #    56.9%
speculation          1274324683572  #  4.3% ( 4.3%)
-- branch mispredict 1237491238390  #     4.2%
-- pipeline restart  36833445182    #     0.1%
smt-contention       15678849842    #  0.1% ( 0.0%)
cpu-cycles           14762307677757 # 2.25 GHz
instructions         15592330738951 # 1.06 IPC
instructions         5196681087432  # 43.719 l2 access per 1000 inst
l2 hit from l1       130413856989   # 35.89% l2 miss
l2 miss from l1      14515875294    #
l2 hit from l2 pf    29748688315    #
l3 hit from l2 pf    18730462115    #
l3 miss from l2 pf   48299527102    #
instructions         5199921049632  # 247.898 float per 1000 inst
float 512            196            # 0.000 AVX-512 per 1000 inst
float 256            2623           # 0.000 AVX-256 per 1000 inst
float 128            1289049778180  # 247.898 AVX-128 per 1000 inst
float MMX            0              # 0.000 MMX per 1000 inst
float scalar         806            # 0.000 scalar per 1000 inst
The corresponding Intel metrics
elapsed              630.059
on_cpu               0.733          # 11.72 / 16 cores
utime                7274.138
stime                110.304
nvcsw                75730          # 77.59%
nivcsw               21868          # 22.41%
inblock              225432         # 357.79/sec
onblock              779616         # 1237.37/sec
cpu-clock            7384424152013  # 7384.424 seconds
task-clock           7384521885456  # 7384.522 seconds
page faults          27008298       # 3657.420/sec
context switches     99959          # 13.536/sec
cpu migrations       12795          # 1.733/sec
major page faults    7665           # 1.038/sec
minor page faults    27000632       # 3656.382/sec
alignment faults     0              # 0.000/sec
emulation faults     0              # 0.000/sec
branches             4920084801682  # 147.418 branches per 1000 inst
branch misses        42207040760    # 0.86% branch miss
conditional          4920084833266  # 147.418 conditional branches per 1000 inst
indirect             1009320119672  # 30.242 indirect branches per 1000 inst
slots                48575631182720 #
retiring             23167973123611 # 47.7% (47.7%)
-- ucode             1531906094319  #     3.2%
-- fastpath          21636067029292 #    44.5%
frontend             3810435128963  #  7.8% ( 7.8%)
-- latency           1596180788057  #     3.3%
-- bandwidth         2214254340906  #     4.6%
backend              18854956683996 # 38.8% (38.8%)
-- cpu               5664129591282  #    11.7%
-- memory            13190827092714 #    27.2%
speculation          3100904740821  #  6.4% ( 6.4%)
-- branch mispredict 2878415958491  #     5.9%
-- pipeline restart  222488782330   #     0.5%
smt-contention       0              #  0.0% ( 0.0%)
cpu-cycles           24196271950931 # 2.35 GHz
instructions         72440581264655 # 2.99 IPC
l2 access            193922593948   # 8.019 l2 access per 1000 inst
l2 miss              96198280028    # 49.61% l2 miss
A small number of processes dominate on where the time is spent. It looks like we don’t get a full profile, this is just the initial 50 seconds before we have a hang, so need to get better structure after that.
821 processes
	 24 snappyHexMesh         1019.83    10.26
	  2 cc1plus                  0.39     0.07
	 19 vulkaninfo               0.19     0.76
	  2 ld.bfd                   0.05     0.04
	  3 glxinfo:gdrv0            0.04     0.06
	  6 clang                    0.04     0.03
	  1 decomposePar             0.03     0.03
	  2 vulkani:disk$0           0.02     0.08
	  1 glxinfo                  0.02     0.02
	  1 glxinfo:cs0              0.02     0.02
	  1 glxinfo:disk$0           0.02     0.02
	  1 glxinfo:sh0              0.02     0.02
	  1 glxinfo:shlo0            0.02     0.02
	  1 blockMesh                0.02     0.00
	  1 llvmpipe-0               0.01     0.04
	  1 llvmpipe-1               0.01     0.04
	  1 llvmpipe-10              0.01     0.04
	  1 llvmpipe-11              0.01     0.04
	  1 llvmpipe-12              0.01     0.04
	  1 llvmpipe-13              0.01     0.04
	  1 llvmpipe-14              0.01     0.04
	  1 llvmpipe-15              0.01     0.04
	  1 llvmpipe-2               0.01     0.04
	  1 llvmpipe-3               0.01     0.04
	  1 llvmpipe-4               0.01     0.04
	  1 llvmpipe-5               0.01     0.04
	  1 llvmpipe-6               0.01     0.04
	  1 llvmpipe-7               0.01     0.04
	  1 llvmpipe-8               0.01     0.04
	  1 llvmpipe-9               0.01     0.04
	  6 make                     0.01     0.02
	271 sh                       0.00     0.00
	108 foamCleanPath            0.00     0.00
	 96 tr                       0.00     0.00
	 57 sed                      0.00     0.00
	 22 rm                       0.00     0.00
	 13 gcc                      0.00     0.00
	 12 foamEtcFile              0.00     0.00
	 10 grep                     0.00     0.00
	  9 gsettings                0.00     0.00
	  9 stty                     0.00     0.00
	  8 dirname                  0.00     0.00
	  8 systemd-detect-          0.00     0.00
	  8 wmakeLnIncludeA          0.00     0.00
	  7 stat                     0.00     0.00
	  6 llvm-link                0.00     0.00
	  6 openfoam                 0.00     0.00
	  5 find                     0.00     0.00
	  5 mkdir                    0.00     0.00
	  4 g++                      0.00     0.00
	  4 makeTargetDir            0.00     0.00
	  4 phoronix-test-s          0.00     0.00
	  4 wmake                    0.00     0.00
	  3 dconf worker             0.00     0.00
	  3 gmain                    0.00     0.00
	  2 as                       0.00     0.00
	  2 collect2                 0.00     0.00