
Test of OpenVino with Intel internal tests. There is a sequence of 18 different tests with different profiles as show below but overall high amounts of backend memory waiting.
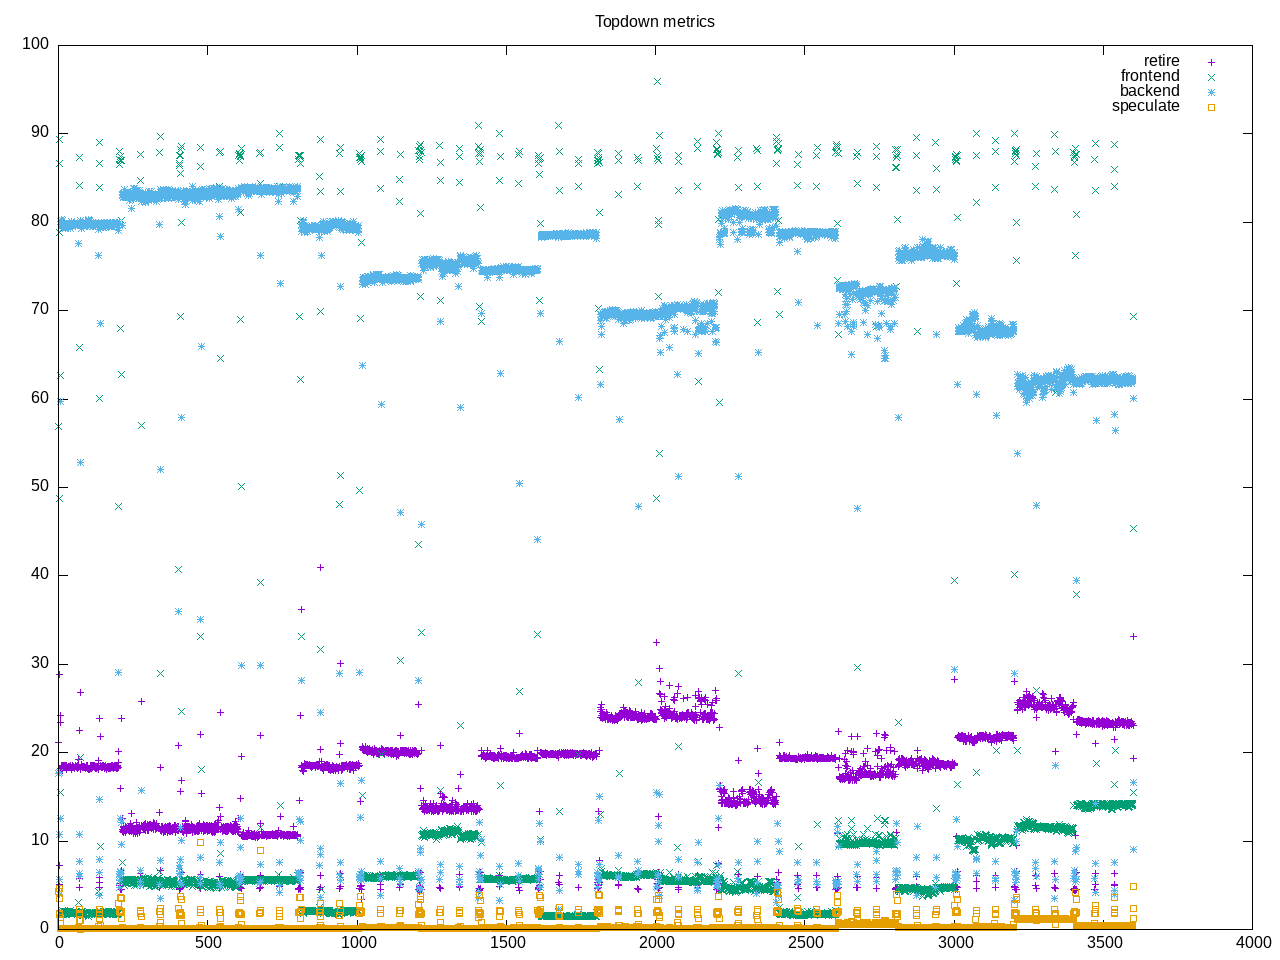
AMD metrics. One thing that surprises me is not as much floating point code as I might expect. Also not many branches.
elapsed              3666.089
on_cpu               0.887          # 14.20 / 16 cores
utime                50536.802
stime                1508.811
nvcsw                25564303       # 63.91%
nivcsw               14438697       # 36.09%
inblock              647168         # 176.53/sec
onblock              450208         # 122.80/sec
cpu-clock            52059503721702 # 52059.504 seconds
task-clock           52065965279085 # 52065.965 seconds
page faults          4182456        # 80.330/sec
context switches     40020993       # 768.659/sec
cpu migrations       3345690        # 64.259/sec
major page faults    3308           # 0.064/sec
minor page faults    4179147        # 80.266/sec
alignment faults     0              # 0.000/sec
emulation faults     0              # 0.000/sec
branches             6104425916302  # 35.074 branches per 1000 inst
branch misses        146139238875   # 2.39% branch miss
conditional          4259728336297  # 24.475 conditional branches per 1000 inst
indirect             335057737990   # 1.925 indirect branches per 1000 inst
cpu-cycles           210012994377891 # 3.64 GHz
instructions         170500080670606 # 0.81 IPC
slots                419981201012916 #
retiring             59508125166069 # 14.2% (18.2%)
-- ucode             162907627794   #     0.0%
-- fastpath          59345217538275 #    14.1%
frontend             20743298000928 #  4.9% ( 6.3%)
-- latency           16183935494766 #     3.9%
-- bandwidth         4559362506162  #     1.1%
backend              246776556780422 # 58.8% (75.3%)
-- cpu               167073230539072 #    39.8%
-- memory            79703326241350 #    19.0%
speculation          774774235160   #  0.2% ( 0.2%)
-- branch mispredict 732884814485   #     0.2%
-- pipeline restart  41889420675    #     0.0%
smt-contention       92175643332376 # 21.9% ( 0.0%)
cpu-cycles           209906778717120 # 3.64 GHz
instructions         170496426937503 # 0.81 IPC
instructions         56819543515048 # 105.906 l2 access per 1000 inst
l2 hit from l1       4611962526922  # 11.12% l2 miss
l2 miss from l1      247542205697   #
l2 hit from l2 pf    984103822417   #
l3 hit from l2 pf    329461554612   #
l3 miss from l2 pf   91984854375    #
instructions         56801900395044 # 36.633 float per 1000 inst
float 512            139            # 0.000 AVX-512 per 1000 inst
float 256            388543342299   # 6.840 AVX-256 per 1000 inst
float 128            1692275011173  # 29.793 AVX-128 per 1000 inst
float MMX            0              # 0.000 MMX per 1000 inst
float scalar         0              # 0.000 scalar per 1000 inst
Corresponding Intel metrics
elapsed              4364.999
on_cpu               0.888          # 14.20 / 16 cores
utime                61143.155
stime                844.689
nvcsw                15956416       # 71.35%
nivcsw               6406167        # 28.65%
inblock              1066104        # 244.24/sec
onblock              450688         # 103.25/sec
cpu-clock            61996971778983 # 61996.972 seconds
task-clock           62000399512424 # 62000.400 seconds
page faults          7556280        # 121.875/sec
context switches     22384091       # 361.031/sec
cpu migrations       5449898        # 87.901/sec
major page faults    5233           # 0.084/sec
minor page faults    7551047        # 121.790/sec
alignment faults     0              # 0.000/sec
emulation faults     0              # 0.000/sec
branches             5124546089326  # 22.836 branches per 1000 inst
branch misses        19662667907    # 0.38% branch miss
conditional          5124546172878  # 22.836 conditional branches per 1000 inst
indirect             1443260482309  # 6.432 indirect branches per 1000 inst
slots                238516915623770 #
retiring             117670618634802 # 49.3% (49.3%)
-- ucode             5510128010357  #     2.3%
-- fastpath          112160490624445 #    47.0%
frontend             53552026560725 # 22.5% (22.5%)
-- latency           46173376494573 #    19.4%
-- bandwidth         7378650066152  #     3.1%
backend              65661215027393 # 27.5% (27.5%)
-- cpu               31552095091589 #    13.2%
-- memory            34109119935804 #    14.3%
speculation          3334009366321  #  1.4% ( 1.4%)
-- branch mispredict 2300226126067  #     1.0%
-- pipeline restart  1033783240254  #     0.4%
smt-contention       0              #  0.0% ( 0.0%)
cpu-cycles           154893255896222 # 2.54 GHz
instructions         231596341850754 # 1.50 IPC
l2 access            6182143166384  # 51.532 l2 access per 1000 inst
l2 miss              1297190616085  # 20.98% l2 miss
Most the time all in the benchmark_app. There was still some mix op processes hanging so don’t have all the processes here, though it is close in elapsed time.
2111 processes
	1757 benchmark_app        1624694.47 39658.01
	 32 clinfo                   5.12     1.92
	 19 vulkaninfo               0.38     0.39
	  3 glxinfo:gdrv0            0.05     0.03
	  2 vulkani:disk$0           0.04     0.05
	  6 clang                    0.03     0.03
	  1 glxinfo                  0.03     0.01
	  1 glxinfo:cs0              0.03     0.01
	  1 glxinfo:disk$0           0.03     0.01
	  1 glxinfo:sh0              0.03     0.01
	  1 glxinfo:shlo0            0.03     0.01
	  1 llvmpipe-0               0.02     0.02
	  1 llvmpipe-1               0.02     0.02
	  1 llvmpipe-10              0.02     0.02
	  1 llvmpipe-11              0.02     0.02
	  1 llvmpipe-12              0.02     0.02
	  1 llvmpipe-13              0.02     0.02
	  1 llvmpipe-14              0.02     0.02
	  1 llvmpipe-15              0.02     0.02
	  1 llvmpipe-2               0.02     0.02
	  1 llvmpipe-3               0.02     0.02
	  1 llvmpipe-4               0.02     0.02
	  1 llvmpipe-5               0.02     0.02
	  1 llvmpipe-6               0.02     0.02
	  1 llvmpipe-7               0.02     0.02
	  1 llvmpipe-8               0.02     0.02
	  1 llvmpipe-9               0.02     0.02
	 99 sh                       0.00     0.00
	 54 openvino                 0.00     0.00
	 13 gcc                      0.00     0.00
	  9 stty                     0.00     0.00
	  8 systemd-detect-          0.00     0.00
	  7 gsettings                0.00     0.00
	  7 stat                     0.00     0.00
	  6 llvm-link                0.00     0.00
	  5 gmain                    0.00     0.00
	  4 phoronix-test-s          0.00     0.00
	  3 dconf worker             0.00     0.00
	  2 which                    0.00     0.00
	  1 cc                       0.00     0.00
	  1 date                     0.00     0.00
	  1 dirname                  0.00     0.00
	  1 grep                     0.00     0.00
	  1 ifconfig                 0.00     0.00
	  1 ip                       0.00     0.00
	  1 lscpu                    0.00     0.00
	  1 mktemp                   0.00     0.00
	  1 ps                       0.00     0.00
	  1 python3                  0.00     0.00
	  1 qdbus                    0.00     0.00
	  1 readlink                 0.00     0.00
	  1 realpath                 0.00     0.00
	  1 sed                      0.00     0.00
	  1 sort                     0.00     0.00
	  1 systemctl                0.00     0.00
	  1 template.sh              0.00     0.00
	  1 wc                       0.00     0.00
	  1 xrandr                   0.00     0.00
	  1 xset                     0.00     0.00
34 processes running
68 maximum processes
Relatively straightforward block when the benchmark runs.
      59339) openvino         cpu=3 start=5.96  finish=68.21
        59340) benchmark_app    cpu=2 start=5.96  finish=68.17
          59341) benchmark_app    cpu=12 start=5.99  finish=68.17
          59342) benchmark_app    cpu=13 start=5.99  finish=68.17
          59343) benchmark_app    cpu=14 start=5.99  finish=68.17
          59344) benchmark_app    cpu=10 start=5.99  finish=68.17
          59345) benchmark_app    cpu=9 start=5.99  finish=68.17
          59346) benchmark_app    cpu=8 start=5.99  finish=68.17
          59347) benchmark_app    cpu=11 start=5.99  finish=68.17
          59348) benchmark_app    cpu=7 start=5.99  finish=68.17
          59349) benchmark_app    cpu=0 start=5.99  finish=68.17
          59350) benchmark_app    cpu=4 start=5.99  finish=68.17
          59351) benchmark_app    cpu=5 start=5.99  finish=68.17
          59352) benchmark_app    cpu=6 start=5.99  finish=68.17
          59353) benchmark_app    cpu=2 start=5.99  finish=68.17
          59354) benchmark_app    cpu=3 start=5.99  finish=68.17
          59355) benchmark_app    cpu=15 start=5.99  finish=68.17
          59356) benchmark_app    cpu=12 start=6.38  finish=68.16
            59369) benchmark_app    cpu=6 start=7.21  finish=68.17
            59372) benchmark_app    cpu=10 start=7.21  finish=68.17
          59357) benchmark_app    cpu=8 start=6.38  finish=68.16
            59364) benchmark_app    cpu=7 start=6.79  finish=68.17
            59365) benchmark_app    cpu=9 start=6.79  finish=68.17
              59368) benchmark_app    cpu=15 start=7.21  finish=68.17
          59358) benchmark_app    cpu=0 start=6.38  finish=68.16
            59361) benchmark_app    cpu=5 start=6.78  finish=68.17
              59363) benchmark_app    cpu=0 start=6.78  finish=68.17
              59366) benchmark_app    cpu=11 start=6.79  finish=68.17
              59367) benchmark_app    cpu=3 start=7.21  finish=68.17
              59371) benchmark_app    cpu=14 start=7.21  finish=68.17
            59362) benchmark_app    cpu=13 start=6.78  finish=68.17
          59359) benchmark_app    cpu=4 start=6.38  finish=68.16
            59370) benchmark_app    cpu=4 start=7.21  finish=68.17
          59360) benchmark_app    cpu=0 start=6.39  finish=68.16