
OpenVKL does “volume computational kernels” as part of Intel’s rendering toolkit. There are two workloads (and a third that does SYCL that didn’t run). Overall metrics are more middle of the road with some backend memory stalls but also ok retirement rate. Pattern below suggests multiple phases through the code.
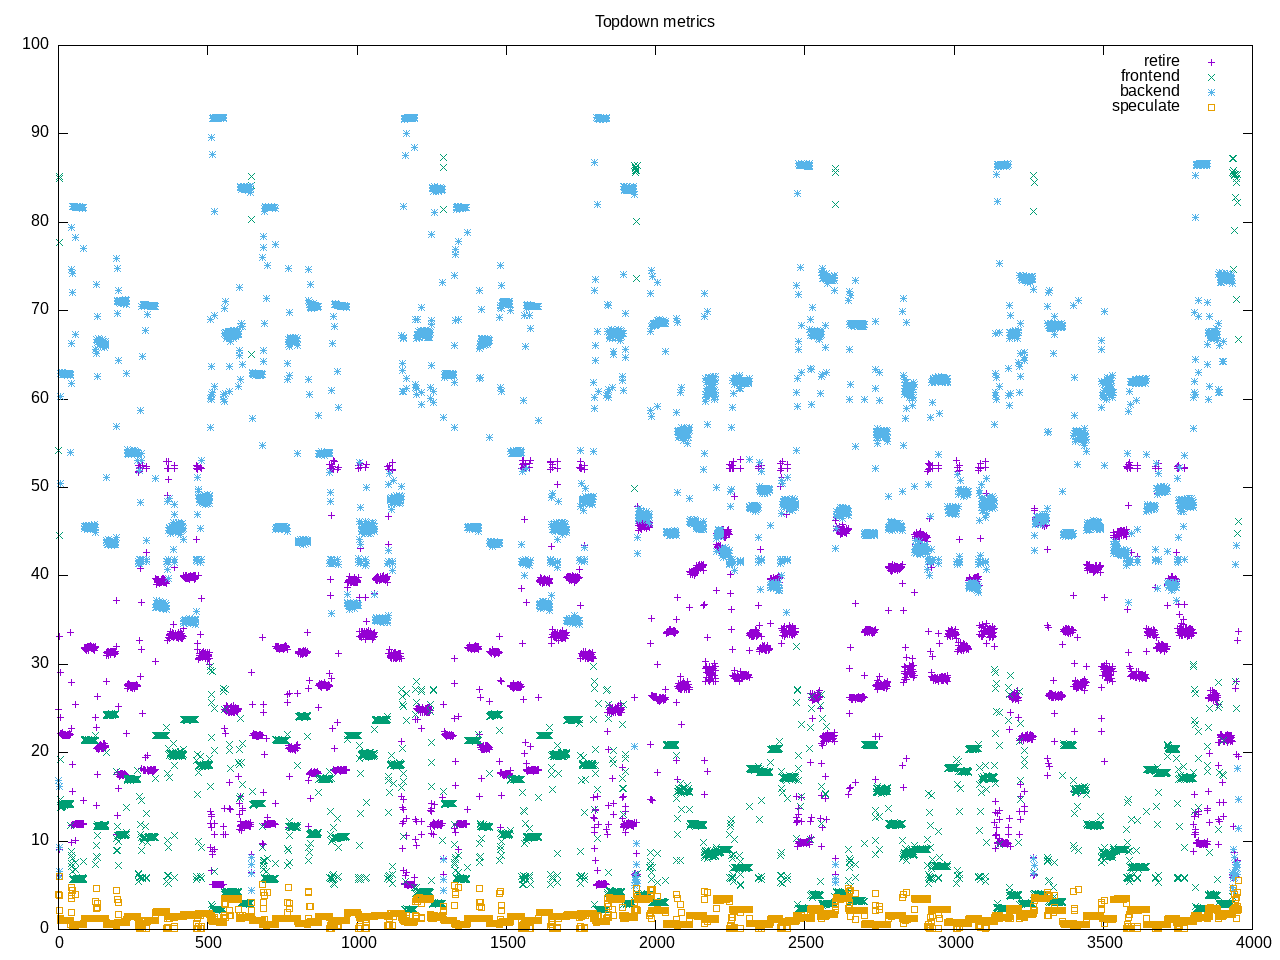
AMD metrics show floating point intensive codes with smaller amount of branches.
elapsed              3971.149
on_cpu               0.896          # 14.34 / 16 cores
utime                56359.739
stime                584.664
nvcsw                33937687       # 98.60%
nivcsw               480386         # 1.40%
inblock              1002920        # 252.55/sec
onblock              8052352        # 2027.71/sec
cpu-clock            56931734359547 # 56931.734 seconds
task-clock           56941310564491 # 56941.311 seconds
page faults          47461092       # 833.509/sec
context switches     34437705       # 604.793/sec
cpu migrations       20220          # 0.355/sec
major page faults    5466           # 0.096/sec
minor page faults    47455626       # 833.413/sec
alignment faults     0              # 0.000/sec
emulation faults     0              # 0.000/sec
branches             19400954559475 # 97.035 branches per 1000 inst
branch misses        201690377818   # 1.04% branch miss
conditional          12895106123407 # 64.496 conditional branches per 1000 inst
indirect             1374941034553  # 6.877 indirect branches per 1000 inst
cpu-cycles           235999440720760 # 3.72 GHz
instructions         199532654165200 # 0.85 IPC
slots                471738528929274 #
retiring             103684313307317 # 22.0% (27.1%)
-- ucode             587326337589   #     0.1%
-- fastpath          103096986969728 #    21.9%
frontend             46597727613920 #  9.9% (12.2%)
-- latency           41563283533494 #     8.8%
-- bandwidth         5034444080426  #     1.1%
backend              226997644094787 # 48.1% (59.2%)
-- cpu               88712172916793 #    18.8%
-- memory            138285471177994 #    29.3%
speculation          5850505760480  #  1.2% ( 1.5%)
-- branch mispredict 4911986409490  #     1.0%
-- pipeline restart  938519350990   #     0.2%
smt-contention       88602923627941 # 18.8% ( 0.0%)
cpu-cycles           234813534923853 # 3.71 GHz
instructions         199261913372212 # 0.85 IPC
instructions         66407166959113 # 17.629 l2 access per 1000 inst
l2 hit from l1       905877907882   # 24.18% l2 miss
l2 miss from l1      164919857111   #
l2 hit from l2 pf    146645173962   #
l3 hit from l2 pf    48609945732    #
l3 miss from l2 pf   69549635740    #
instructions         66387630998801 # 375.847 float per 1000 inst
float 512            93             # 0.000 AVX-512 per 1000 inst
float 256            27363772230    # 0.412 AVX-256 per 1000 inst
float 128            24924227430959 # 375.435 AVX-128 per 1000 inst
float MMX            0              # 0.000 MMX per 1000 inst
float scalar         3              # 0.000 scalar per 1000 inst
Intel metrics
elapsed              4136.591
on_cpu               0.896          # 14.33 / 16 cores
utime                57965.710
stime                1331.660
nvcsw                76665884       # 99.28%
nivcsw               555305         # 0.72%
inblock              816520         # 197.39/sec
onblock              7819888        # 1890.42/sec
cpu-clock            59247135542528 # 59247.136 seconds
task-clock           59259522665649 # 59259.523 seconds
page faults          43320780       # 731.035/sec
context switches     77241651       # 1303.447/sec
cpu migrations       46304          # 0.781/sec
major page faults    4528           # 0.076/sec
minor page faults    43316252       # 730.959/sec
alignment faults     0              # 0.000/sec
emulation faults     0              # 0.000/sec
branches             19225950316371 # 91.942 branches per 1000 inst
branch misses        198690011214   # 1.03% branch miss
conditional          19225950333715 # 91.942 conditional branches per 1000 inst
indirect             4849736895446  # 23.192 indirect branches per 1000 inst
slots                282541754736980 #
retiring             146147493214299 # 51.7% (51.7%)
-- ucode             14751838264754 #     5.2%
-- fastpath          131395654949545 #    46.5%
frontend             55659811470922 # 19.7% (19.7%)
-- latency           42073001368270 #    14.9%
-- bandwidth         13586810102652 #     4.8%
backend              69719964764269 # 24.7% (24.7%)
-- cpu               36329134258130 #    12.9%
-- memory            33390830506139 #    11.8%
speculation          14637555457175 #  5.2% ( 5.2%)
-- branch mispredict 14202906582505 #     5.0%
-- pipeline restart  434648874670   #     0.2%
smt-contention       0              #  0.0% ( 0.0%)
cpu-cycles           182201387562091 # 2.77 GHz
instructions         253179753855479 # 1.39 IPC
l2 access            1615030149531  # 12.736 l2 access per 1000 inst
l2 miss              684417918973   # 42.38% l2 miss
Process information crashed part way through so was incomplete but pieces shown below.
328 processes
	 80 vklBenchmarkCPU      743574.56  8707.04
	 34 clinfo                   9.58     3.34
	 19 vulkaninfo               0.19     0.96
	  3 glxinfo:gdrv0            0.11     0.01
	  6 clang                    0.06     0.06
	  1 glxinfo                  0.05     0.01
	  1 glxinfo:cs0              0.05     0.01
	  1 glxinfo:disk$0           0.05     0.01
	  1 glxinfo:sh0              0.05     0.01
	  1 glxinfo:shlo0            0.05     0.01
	  2 vulkani:disk$0           0.02     0.11
	  1 llvmpipe-1               0.01     0.06
	  1 llvmpipe-10              0.01     0.06
	  1 llvmpipe-11              0.01     0.06
	  1 llvmpipe-12              0.01     0.06
	  1 llvmpipe-13              0.01     0.06
	  1 llvmpipe-14              0.01     0.06
	  1 llvmpipe-15              0.01     0.06
	  1 llvmpipe-2               0.01     0.06
	  1 llvmpipe-3               0.01     0.06
	  1 llvmpipe-4               0.01     0.06
	  1 llvmpipe-5               0.01     0.06
	  1 llvmpipe-6               0.01     0.06
	  1 llvmpipe-7               0.01     0.06
	  1 llvmpipe-8               0.01     0.06
	  1 llvmpipe-9               0.01     0.06
	  1 llvmpipe-0               0.01     0.05
	  1 ps                       0.00     0.01
	 59 sh                       0.00     0.00
	 13 gsettings                0.00     0.00
	 12 gcc                      0.00     0.00
	  8 systemd-detect-          0.00     0.00
	  7 stat                     0.00     0.00
	  6 llvm-link                0.00     0.00
	  5 openvkl                  0.00     0.00
	  4 phoronix-test-s          0.00     0.00
	  2 gmain                    0.00     0.00
	  2 which                    0.00     0.00
	  1 date                     0.00     0.00
	  1 dirname                  0.00     0.00
	  1 grep                     0.00     0.00
	  1 ifconfig                 0.00     0.00
	  1 ip                       0.00     0.00
	  1 lscpu                    0.00     0.00
	  1 mktemp                   0.00     0.00
	  1 qdbus                    0.00     0.00
	  1 readlink                 0.00     0.00
	  1 realpath                 0.00     0.00
	  1 sed                      0.00     0.00
	  1 sort                     0.00     0.00
	  1 stty                     0.00     0.00
	  1 systemctl                0.00     0.00
	  1 template.sh              0.00     0.00
	  1 wc                       0.00     0.00
	  1 xrandr                   0.00     0.00
	  1 xset                     0.00     0.00
26 processes running
47 maximum processes
Core computation blocks look as follows
      6550) openvkl          cpu=0 start=648.38 finish=1286.06
        6551) vklBenchmarkCPU  cpu=12 start=648.38 finish=1286.01
          6552) vklBenchmarkCPU  cpu=7 start=648.42 finish=1286.01
            6554) vklBenchmarkCPU  cpu=6 start=648.42 finish=1286.01
              6557) vklBenchmarkCPU  cpu=3 start=648.42 finish=1286.01
                6565) vklBenchmarkCPU  cpu=9 start=648.42 finish=1286.01
                6566) vklBenchmarkCPU  cpu=15 start=648.42 finish=1286.01
              6558) vklBenchmarkCPU  cpu=14 start=648.42 finish=1286.01
            6556) vklBenchmarkCPU  cpu=11 start=648.42 finish=1286.01
              6561) vklBenchmarkCPU  cpu=2 start=648.42 finish=1286.01
              6563) vklBenchmarkCPU  cpu=5 start=648.42 finish=1286.01
          6553) vklBenchmarkCPU  cpu=4 start=648.42 finish=1286.01
            6555) vklBenchmarkCPU  cpu=1 start=648.42 finish=1286.01
              6560) vklBenchmarkCPU  cpu=8 start=648.42 finish=1286.01
                6562) vklBenchmarkCPU  cpu=0 start=648.42 finish=1286.01
              6564) vklBenchmarkCPU  cpu=13 start=648.42 finish=1286.01
            6559) vklBenchmarkCPU  cpu=10 start=648.42 finish=1286.01