
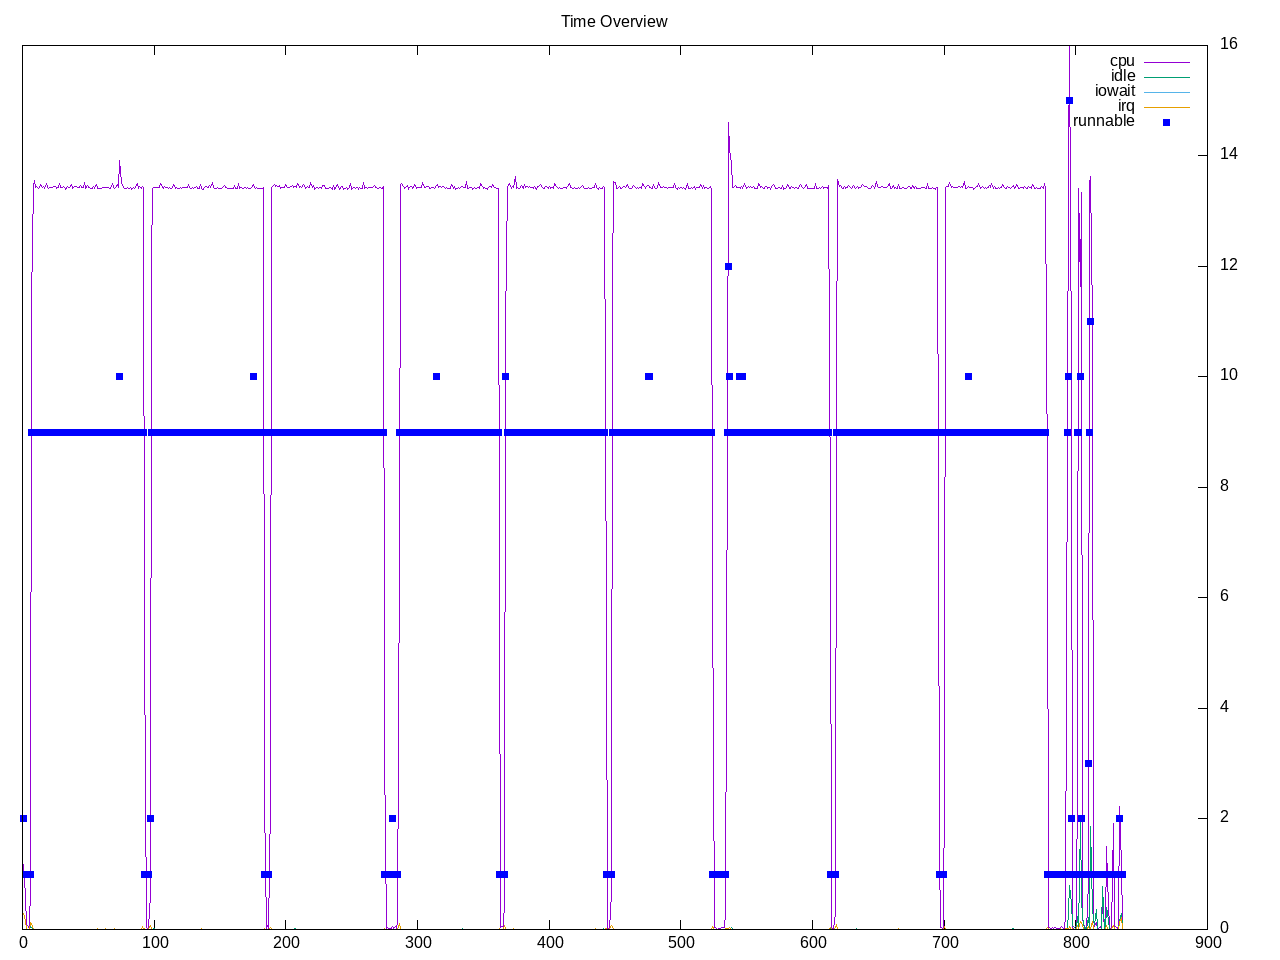
A framework for general purpose Computational Fluid Dynamics (CFD). This has five workload of the Cavity3d benchmark with different sizes. The first three work on AMD system and first two work on Intel system. The other larger ones fail. Looks like these run on the physical (not hyperthreaded) cores, perhaps with MPI.
Topdown profile shows a workload with increasing backend stalls and lower retirement rate.
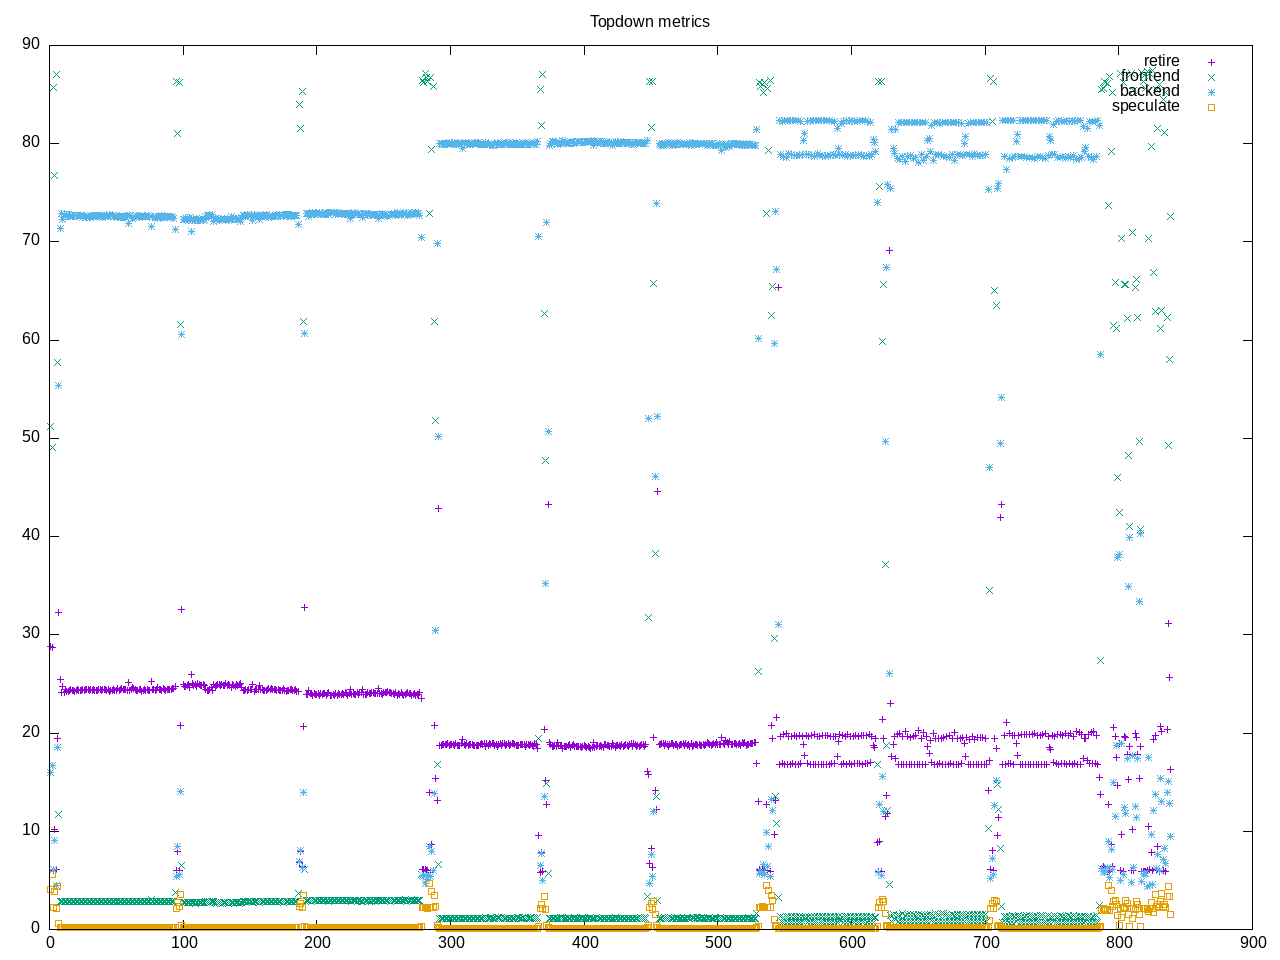
AMD metrics show this as floating point code with a low level of frontend stalls or speculation stalls.
elapsed              836.698
on_cpu               0.435          # 6.96 / 16 cores
utime                5702.901
stime                123.549
nvcsw                123143         # 87.25%
nivcsw               17988          # 12.75%
inblock              2196096        # 2624.72/sec
onblock              265480         # 317.29/sec
cpu-clock            5887597402841  # 5887.597 seconds
task-clock           5887670199615  # 5887.670 seconds
page faults          53493667       # 9085.711/sec
context switches     226140         # 38.409/sec
cpu migrations       12308          # 2.090/sec
major page faults    17874          # 3.036/sec
minor page faults    53475762       # 9082.669/sec
alignment faults     0              # 0.000/sec
emulation faults     0              # 0.000/sec
branches             1869589369583  # 59.480 branches per 1000 inst
branch misses        10705318795    # 0.57% branch miss
conditional          1042825476361  # 33.177 conditional branches per 1000 inst
indirect             129681340683   # 4.126 indirect branches per 1000 inst
cpu-cycles           26305189422647 # 1.94 GHz
instructions         31441737916631 # 1.20 IPC
slots                52622345068602 #
retiring             10889011000500 # 20.7% (20.7%)
-- ucode             30457782863    #     0.1%
-- fastpath          10858553217637 #    20.6%
frontend             1557951220896  #  3.0% ( 3.0%) low
-- latency           979774237896   #     1.9%
-- bandwidth         578176983000   #     1.1%
backend              40040356750516 # 76.1% (76.1%) high
-- cpu               6363537379963  #    12.1%
-- memory            33676819370553 #    64.0%
speculation          100408613268   #  0.2% ( 0.2%) low
-- branch mispredict 91032876463    #     0.2%
-- pipeline restart  9375736805     #     0.0%
smt-contention       34598398476    #  0.1% ( 0.0%)
cpu-cycles           26161990460125 # 1.94 GHz
instructions         31564444349673 # 1.21 IPC
instructions         10526717004116 # 17.343 l2 access per 1000 inst
l2 hit from l1       128701953755   # 39.78% l2 miss
l2 miss from l1      37747882576    #
l2 hit from l2 pf    18980760670    #
l3 hit from l2 pf    4459996432     #
l3 miss from l2 pf   30423851490    #
instructions         10525823050089 # 357.908 float per 1000 inst
float 512            126            # 0.000 AVX-512 per 1000 inst
float 256            1080           # 0.000 AVX-256 per 1000 inst
float 128            3767274378333  # 357.908 AVX-128 per 1000 inst
float MMX            0              # 0.000 MMX per 1000 inst
float scalar         0              # 0.000 scalar per 1000 inst
instructions         31499731796006 #
opcache              3728490971511  # 118.366 opcache per 1000 inst
opcache miss         92748095595    #  2.5% opcache miss rate
l1 dTLB miss         12301153494    # 0.391 L1 dTLB per 1000 inst
l2 dTLB miss         4858292548     # 0.154 L2 dTLB per 1000 inst
instructions         31580053403705 #
icache               191823644658   # 6.074 icache per 1000 inst
icache miss          6594453889     #  3.4% icache miss rate
l1 iTLB miss         36650924       # 0.001 L1 iTLB per 1000 inst
l2 iTLB miss         0              # 0.000 L2 iTLB per 1000 inst
tlb flush            510515         # 0.000 TLB flush per 1000 inst
Intel metrics show a 30% dram bound aspect to the backend stalls.
elapsed              1048.526
on_cpu               0.668          # 10.69 / 16 cores
utime                10973.031
stime                231.736
nvcsw                139902         # 82.38%
nivcsw               29919          # 17.62%
inblock              719856         # 686.54/sec
onblock              254096         # 242.34/sec
cpu-clock            11324229583345 # 11324.230 seconds
task-clock           11324321973368 # 11324.322 seconds
page faults          38708439       # 3418.168/sec
context switches     339854         # 30.011/sec
cpu migrations       45994          # 4.062/sec
major page faults    19561          # 1.727/sec
minor page faults    38688804       # 3416.434/sec
alignment faults     0              # 0.000/sec
emulation faults     0              # 0.000/sec
branches             5415329661932  # 102.842 branches per 1000 inst
branch misses        13712134509    # 0.25% branch miss
conditional          5415329691340  # 102.842 conditional branches per 1000 inst
indirect             1101290966057  # 20.914 indirect branches per 1000 inst
slots                75572942608994 #
retiring             30196634336577 # 40.0% (40.0%)
-- ucode             2181580200259  #     2.9%
-- fastpath          28015054136318 #    37.1%
frontend             2905024145432  #  3.8% ( 3.8%) low
-- latency           1591010362308  #     2.1%
-- bandwidth         1314013783124  #     1.7%
backend              40975150606718 # 54.2% (54.2%)
-- cpu               10926288753421 #    14.5%
-- memory            30048861853297 #    39.8%
speculation          2197782267550  #  2.9% ( 2.9%)
-- branch mispredict 1871529610415  #     2.5%
-- pipeline restart  326252657135   #     0.4%
smt-contention       0              #  0.0% ( 0.0%)
cpu-cycles           33605195706463 # 2.00 GHz
instructions         80442309203356 # 2.39 IPC
l2 access            208504898413   # 6.909 l2 access per 1000 inst
l2 miss              113006068651   # 54.20% l2 miss
cpu-cycles           12599040970847 # 41.5% memory latency
load stalls          5100446679052  #  0.6% l1 bound
l1 miss              5028041939034  #  4.0% l2 bound
l2 miss              4528516333239  #  5.3% l3 bound
l3 miss              3866423296808  # 30.7% dram bound
store_stalls         123166211851   #  1.0% store bound