
A benchmark of PostgresSQL operations. There are many different test configurations, I picked two that are closest to what Phoronix used in their benchmark article. scaling factor of 100 with 1000 clients. The read operation followed by read/write. Looks like there are mostly a small number of runnable processes through up to 800 appear at one point.

Topdown overview shows a front-end bound process. The timing looks slightly different in this case than previous one and stretching longer. Perhap additional runs to get stability.
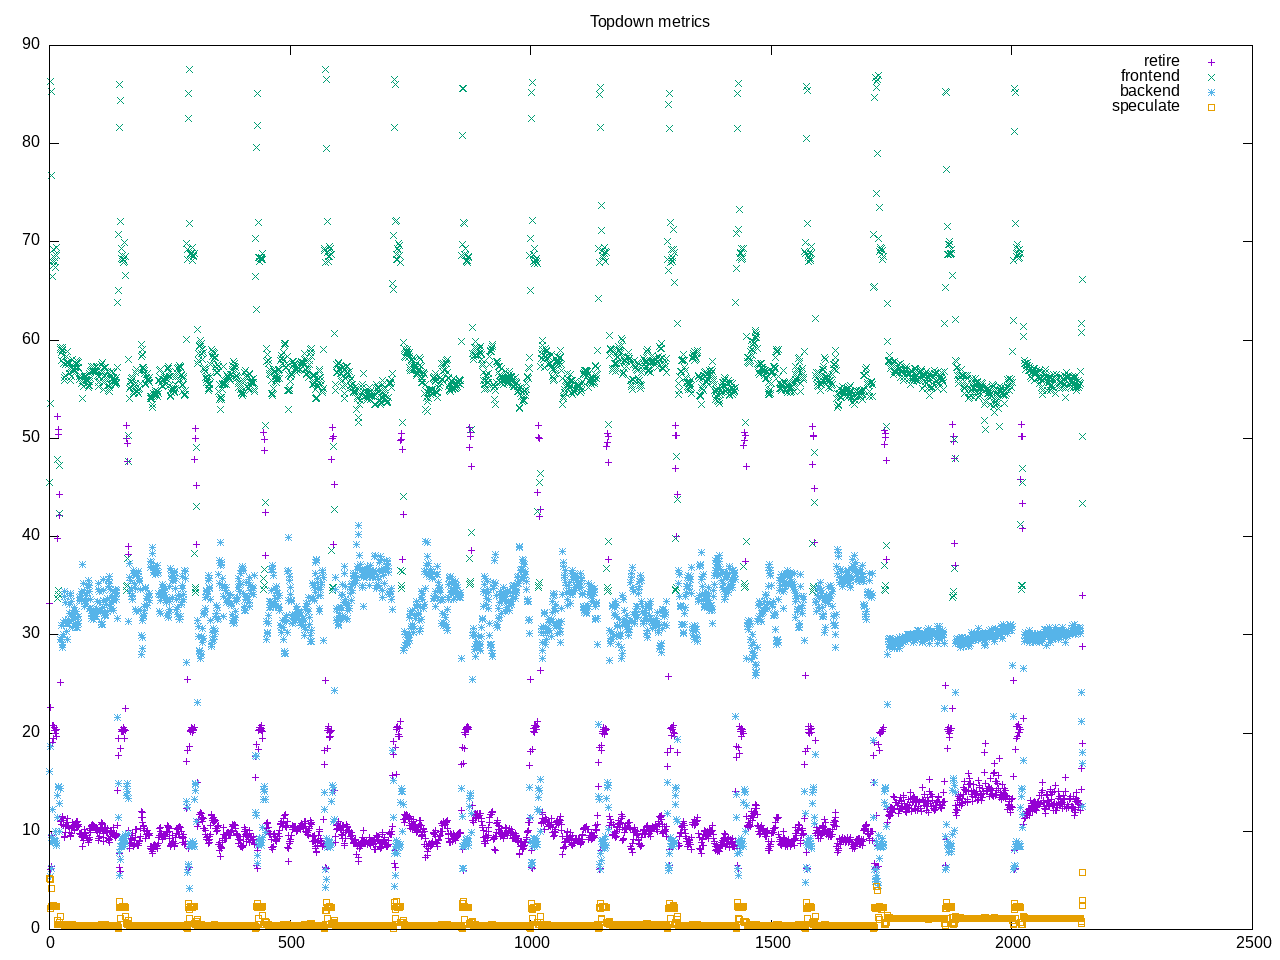
AMD metrics show average on-cpu of only 2.5. Some floating point code and many branches. Frontend latency appears to dominate and this would be a good benchmark to dig deeper on latency.
elapsed              863.433
on_cpu               0.157          # 2.52 / 16 cores
utime                459.890
stime                1713.587
nvcsw                12451489       # 8.45%
nivcsw               134887770      # 91.55%
inblock              8              # 0.01/sec
onblock              16504          # 19.11/sec
cpu-clock            11390349332903 # 11390.349 seconds
task-clock           11403070781759 # 11403.071 seconds
page faults          91224025       # 7999.953/sec
context switches     397659971      # 34873.060/sec
cpu migrations       38233072       # 3352.875/sec
major page faults    799            # 0.070/sec
minor page faults    91223226       # 7999.882/sec
alignment faults     0              # 0.000/sec
emulation faults     0              # 0.000/sec
branches             5355467484433  # 205.853 branches per 1000 inst
branch misses        292739782623   # 5.47% branch miss
conditional          3407698242743  # 130.985 conditional branches per 1000 inst
indirect             117052096702   # 4.499 indirect branches per 1000 inst
cpu-cycles           45652716363402 # 3.31 GHz
instructions         27213399658895 # 0.60 IPC
slots                90040636490742 #
retiring             9410107725001  # 10.5% (11.7%)
-- ucode             44883771195    #     0.0%
-- fastpath          9365223953806  #    10.4%
frontend             45468404154306 # 50.5% (56.6%)
-- latency           37635521319684 #    41.8%
-- bandwidth         7832882834622  #     8.7%
backend              24909401939477 # 27.7% (31.0%)
-- cpu               2220898318464  #     2.5%
-- memory            22688503621013 #    25.2%
speculation          605948968091   #  0.7% ( 0.8%)
-- branch mispredict 602767658468   #     0.7%
-- pipeline restart  3181309623     #     0.0%
smt-contention       9643199770382  # 10.7% ( 0.0%)
cpu-cycles           45879696338268 # 3.32 GHz
instructions         26657314107701 # 0.58 IPC
instructions         8759583463590  # 79.491 l2 access per 1000 inst
l2 hit from l1       611600487555   # 22.86% l2 miss
l2 miss from l1      107286230319   #
l2 hit from l2 pf    32790526002    #
l3 hit from l2 pf    23400169289    #
l3 miss from l2 pf   28515861814    #
instructions         8759544138410  # 80.986 float per 1000 inst
float 512            70             # 0.000 AVX-512 per 1000 inst
float 256            586            # 0.000 AVX-256 per 1000 inst
float 128            709400728133   # 80.986 AVX-128 per 1000 inst
float MMX            0              # 0.000 MMX per 1000 inst
float scalar         0              # 0.000 scalar per 1000 inst
Intel metrics
elapsed              2291.272
on_cpu               0.139          # 2.22 / 16 cores
utime                1836.851
stime                3255.948
nvcsw                7011767        # 1.36%
nivcsw               507821164      # 98.64%
inblock              7648           # 3.34/sec
onblock              5576           # 2.43/sec
cpu-clock            27441549967843 # 27441.550 seconds
task-clock           27449294125546 # 27449.294 seconds
page faults          237069157      # 8636.621/sec
context switches     1078148357     # 39277.817/sec
cpu migrations       23548431       # 857.888/sec
major page faults    2234           # 0.081/sec
minor page faults    237066923      # 8636.540/sec
alignment faults     0              # 0.000/sec
emulation faults     0              # 0.000/sec
branches             9692774844607  # 191.453 branches per 1000 inst
branch misses        57955491662    # 0.60% branch miss
conditional          9692775358495  # 191.453 conditional branches per 1000 inst
indirect             2345563682863  # 46.330 indirect branches per 1000 inst
slots                124996051720466 #
retiring             32187185782664 # 25.8% (25.8%)
-- ucode             4181245792684  #     3.3%
-- fastpath          28005939989980 #    22.4%
frontend             62982740884535 # 50.4% (50.4%)
-- latency           43903284077682 #    35.1%
-- bandwidth         19079456806853 #    15.3%
backend              26797147178785 # 21.4% (21.4%)
-- cpu               4765353392012  #     3.8%
-- memory            22031793786773 #    17.6%
speculation          3176735760047  #  2.5% ( 2.5%)
-- branch mispredict 2355089638929  #     1.9%
-- pipeline restart  821646121118   #     0.7%
smt-contention       0              #  0.0% ( 0.0%)
cpu-cycles           59299293721852 # 1.62 GHz
instructions         45253336959405 # 0.76 IPC
l2 access            2944393364322  # 93.519 l2 access per 1000 inst
l2 miss              859430772105   # 29.19% l2 miss
Process overview shows the many processes launched as clients to run pgbench along with the postgres benchmark. Here would also be useful to separate out topdown metrics for either.
6595 processes
	120 pgbench               7466.61 25775.90
	6086 postgres              6313.98  2805.83
	 68 clinfo                  18.19     5.99
	 38 vulkaninfo               1.32     0.96
	  6 glxinfo:gdrv0            0.15     0.08
	  4 vulkani:disk$0           0.14     0.10
	  6 php                      0.07     0.17
	  2 llvmpipe-0               0.07     0.05
	  2 llvmpipe-1               0.07     0.05
	  2 llvmpipe-10              0.07     0.05
	  2 llvmpipe-11              0.07     0.05
	  2 llvmpipe-12              0.07     0.05
	  2 llvmpipe-13              0.07     0.05
	  2 llvmpipe-14              0.07     0.05
	  2 llvmpipe-15              0.07     0.05
	  2 llvmpipe-2               0.07     0.05
	  2 llvmpipe-3               0.07     0.05
	  2 llvmpipe-4               0.07     0.05
	  2 llvmpipe-5               0.07     0.05
	  2 llvmpipe-6               0.07     0.05
	  2 llvmpipe-7               0.07     0.05
	  2 llvmpipe-8               0.07     0.05
	  2 llvmpipe-9               0.07     0.05
	  2 glxinfo                  0.07     0.04
	  2 glxinfo:cs0              0.07     0.04
	  2 glxinfo:disk$0           0.07     0.04
	  2 glxinfo:sh0              0.07     0.04
	  2 glxinfo:shlo0            0.07     0.04
	  6 clang                    0.04     0.08
	  3 rocminfo                 0.03     0.00
	  1 lspci                    0.00     0.03
	  1 ps                       0.00     0.01
	 90 sh                       0.00     0.00
	 13 gcc                      0.00     0.00
	 12 pg_ctl                   0.00     0.00
	 10 gsettings                0.00     0.00
	  8 stat                     0.00     0.00
	  8 systemd-detect-          0.00     0.00
	  6 bc                       0.00     0.00
	  6 createdb                 0.00     0.00
	  6 llvm-link                0.00     0.00
	  6 sleep                    0.00     0.00
	  5 phoronix-test-s          0.00     0.00
	  4 dropdb                   0.00     0.00
	  4 gmain                    0.00     0.00
	  2 cc                       0.00     0.00
	  2 dconf worker             0.00     0.00
	  2 lscpu                    0.00     0.00
	  2 uname                    0.00     0.00
	  2 which                    0.00     0.00
	  2 xset                     0.00     0.00
	  1 date                     0.00     0.00
	  1 dirname                  0.00     0.00
	  1 dmesg                    0.00     0.00
	  1 dmidecode                0.00     0.00
	  1 grep                     0.00     0.00
	  1 ifconfig                 0.00     0.00
	  1 ip                       0.00     0.00
	  1 lsmod                    0.00     0.00
	  1 mktemp                   0.00     0.00
	  1 qdbus                    0.00     0.00
	  1 readlink                 0.00     0.00
	  1 realpath                 0.00     0.00
	  1 sed                      0.00     0.00
	  1 sort                     0.00     0.00
	  1 stty                     0.00     0.00
	  1 systemctl                0.00     0.00
	  1 template.sh              0.00     0.00
	  1 wc                       0.00     0.00
	  1 xrandr                   0.00     0.00
5 processes running
1037 maximum processes