
A benchmark suite for php. This is a single-threaded benchmark with high IPC and high retirement rate. It also has a quick runtime.
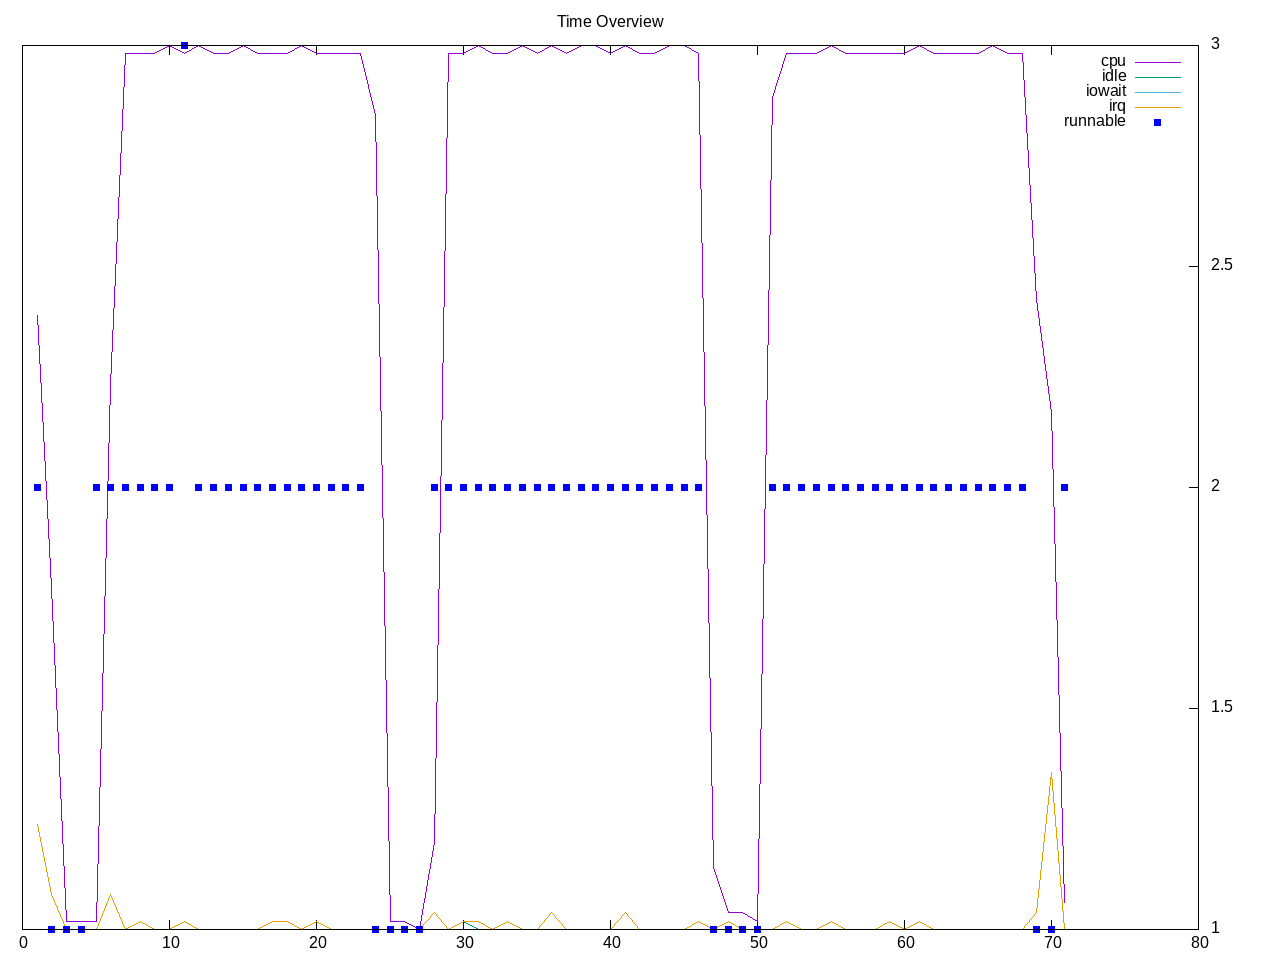
Topdown profile has a mix reflecting both a composite of test cases and a quick run time.
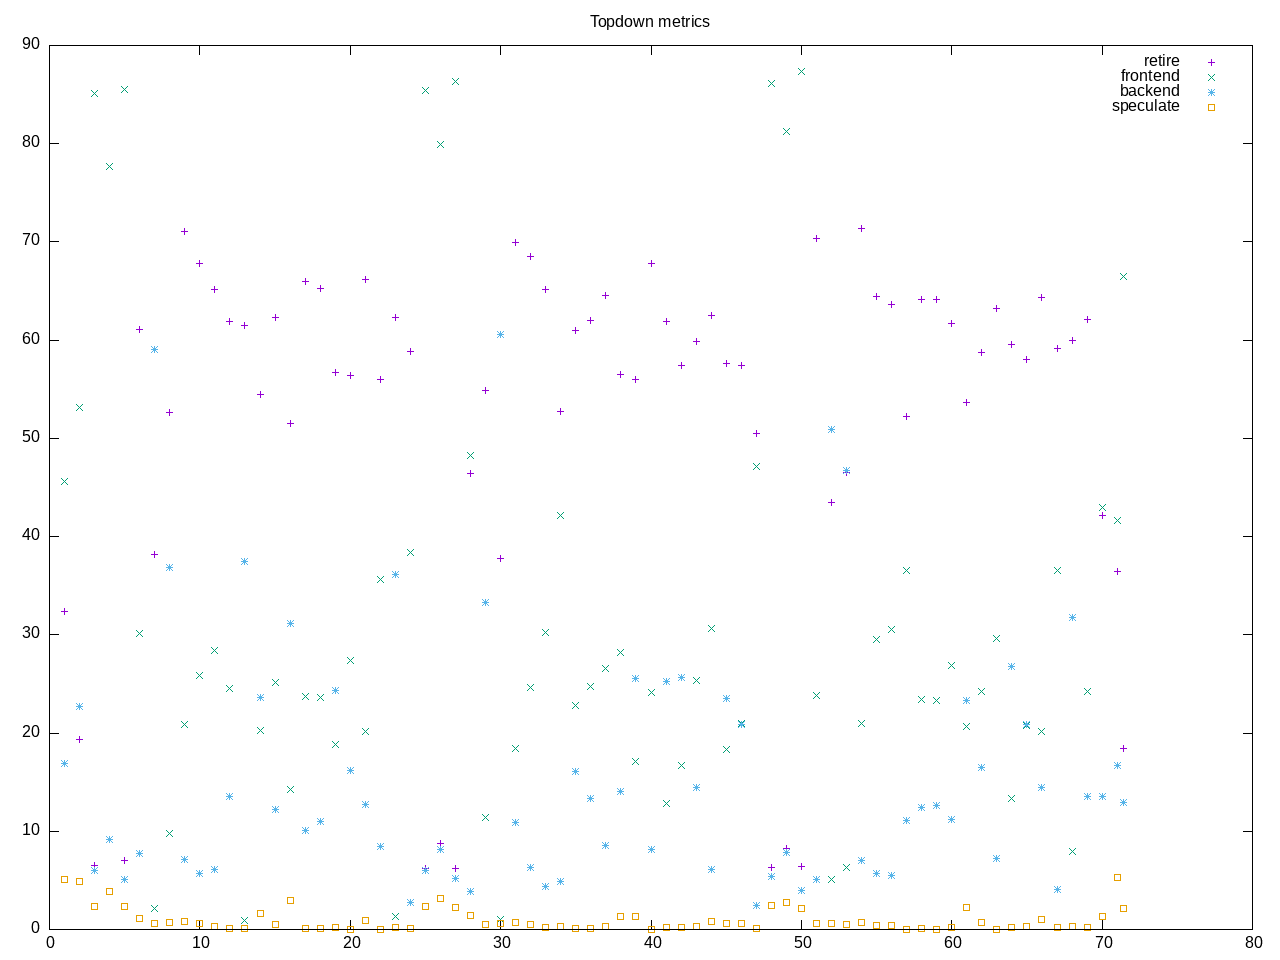
AMD metrics pull the composite together. The backend stalls are low and retirement rate is high. There is little floating point and very little L2 activity.
elapsed              71.058
on_cpu               0.050          # 0.80 / 16 cores
utime                56.344
stime                0.783
nvcsw                1911           # 79.53%
nivcsw               492            # 20.47%
inblock              0              # 0.00/sec
onblock              12664          # 178.22/sec
cpu-clock            57153546668    # 57.154 seconds
task-clock           57156008472    # 57.156 seconds
page faults          152146         # 2661.942/sec
context switches     2589           # 45.297/sec
cpu migrations       259            # 4.531/sec
major page faults    2              # 0.035/sec
minor page faults    152144         # 2661.907/sec
alignment faults     0              # 0.000/sec
emulation faults     0              # 0.000/sec
branches             210271913729   # 233.593 branches per 1000 inst
branch misses        129614926      # 0.06% branch miss
conditional          138843502982   # 154.243 conditional branches per 1000 inst
indirect             24408622773    # 27.116 indirect branches per 1000 inst
cpu-cycles           263799618154   # 0.23 GHz
instructions         897798589716   # 3.40 IPC high
slots                530592307308   #
retiring             310571931604   # 58.5% (58.5%) high
-- ucode             613571138      #     0.1%
-- fastpath          309958360466   #    58.4%
frontend             124268320822   # 23.4% (23.4%)
-- latency           47912796564    #     9.0%
-- bandwidth         76355524258    #    14.4%
backend              92399776108    # 17.4% (17.4%) low
-- cpu               29006832602    #     5.5%
-- memory            63392943506    #    11.9%
speculation          3324389886     #  0.6% ( 0.6%) low
-- branch mispredict 2738626655     #     0.5%
-- pipeline restart  585763231      #     0.1%
smt-contention       27626792       #  0.0% ( 0.0%)
cpu-cycles           262509222435   # 0.23 GHz
instructions         897889576573   # 3.42 IPC high
instructions         300467635471   # 0.605 l2 access per 1000 inst
l2 hit from l1       165756174      # 11.90% l2 miss
l2 miss from l1      12538980       #
l2 hit from l2 pf    6994982        #
l3 hit from l2 pf    3800174        #
l3 miss from l2 pf   5293291        #
instructions         299818977094   # 10.487 float per 1000 inst
float 512            60             # 0.000 AVX-512 per 1000 inst
float 256            598            # 0.000 AVX-256 per 1000 inst
float 128            3144180834     # 10.487 AVX-128 per 1000 inst
float MMX            0              # 0.000 MMX per 1000 inst
float scalar         0              # 0.000 scalar per 1000 inst
Intel metrics
elapsed              70.915
on_cpu               0.050          # 0.81 / 16 cores
utime                56.850
stime                0.390
nvcsw                1923           # 86.54%
nivcsw               299            # 13.46%
inblock              528            # 7.45/sec
onblock              1320           # 18.61/sec
cpu-clock            57246343179    # 57.246 seconds
task-clock           57248725490    # 57.249 seconds
page faults          140758         # 2458.710/sec
context switches     2407           # 42.045/sec
cpu migrations       234            # 4.087/sec
major page faults    1              # 0.017/sec
minor page faults    140757         # 2458.692/sec
alignment faults     0              # 0.000/sec
emulation faults     0              # 0.000/sec
branches             209215212501   # 233.093 branches per 1000 inst
branch misses        162111365      # 0.08% branch miss
conditional          209215224373   # 233.093 conditional branches per 1000 inst
indirect             24410487087    # 27.196 indirect branches per 1000 inst
slots                1300410734558  #
retiring             855226039903   # 65.8% (65.8%) high
-- ucode             34148079744    #     2.6%
-- fastpath          821077960159   #    63.1%
frontend             205397653770   # 15.8% (15.8%)
-- latency           33351327421    #     2.6%
-- bandwidth         172046326349   #    13.2%
backend              191999086162   # 14.8% (14.8%) low
-- cpu               136406269561   #    10.5%
-- memory            55592816601    #     4.3%
speculation          50305389684    #  3.9% ( 3.9%)
-- branch mispredict 39658080026    #     3.0%
-- pipeline restart  10647309658    #     0.8%
smt-contention       0              #  0.0% ( 0.0%)
cpu-cycles           217229804759   # 0.19 GHz
instructions         897737088274   # 4.13 IPC high
l2 access            276376768      # 0.308 l2 access per 1000 inst
l2 miss              86888248       # 31.44% l2 miss
Process overview is straightforward with several invocations of php
351 processes
	  9 php                     56.09     0.09
	 68 clinfo                  17.20     5.99
	 38 vulkaninfo               1.33     0.95
	  6 glxinfo:gdrv0            0.15     0.01
	  6 glxinfo:gl0              0.15     0.01
	  4 vulkani:disk$0           0.14     0.10
	  2 llvmpipe-0               0.07     0.05
	  2 llvmpipe-1               0.07     0.05
	  2 llvmpipe-10              0.07     0.05
	  2 llvmpipe-11              0.07     0.05
	  2 llvmpipe-12              0.07     0.05
	  2 llvmpipe-13              0.07     0.05
	  2 llvmpipe-14              0.07     0.05
	  2 llvmpipe-15              0.07     0.05
	  2 llvmpipe-2               0.07     0.05
	  2 llvmpipe-3               0.07     0.05
	  2 llvmpipe-4               0.07     0.05
	  2 llvmpipe-5               0.07     0.05
	  2 llvmpipe-6               0.07     0.05
	  2 llvmpipe-7               0.07     0.05
	  2 llvmpipe-8               0.07     0.05
	  2 llvmpipe-9               0.07     0.05
	  2 glxinfo                  0.07     0.01
	  2 glxinfo:cs0              0.07     0.01
	  2 glxinfo:disk$0           0.07     0.01
	  2 glxinfo:sh0              0.07     0.01
	  2 glxinfo:shlo0            0.07     0.01
	  6 clang                    0.04     0.08
	  3 rocminfo                 0.03     0.00
	  1 lspci                    0.00     0.02
	  1 ps                       0.00     0.01
	 81 sh                       0.00     0.00
	 12 gcc                      0.00     0.00
	 10 gsettings                0.00     0.00
	  8 stat                     0.00     0.00
	  8 systemd-detect-          0.00     0.00
	  6 llvm-link                0.00     0.00
	  5 phoronix-test-s          0.00     0.00
	  4 gmain                    0.00     0.00
	  3 phpbench                 0.00     0.00
	  2 dconf worker             0.00     0.00
	  2 lscpu                    0.00     0.00
	  2 uname                    0.00     0.00
	  2 which                    0.00     0.00
	  2 xset                     0.00     0.00
	  1 cc                       0.00     0.00
	  1 date                     0.00     0.00
	  1 dirname                  0.00     0.00
	  1 dmesg                    0.00     0.00
	  1 dmidecode                0.00     0.00
	  1 grep                     0.00     0.00
	  1 ifconfig                 0.00     0.00
	  1 ip                       0.00     0.00
	  1 lsmod                    0.00     0.00
	  1 mktemp                   0.00     0.00
	  1 qdbus                    0.00     0.00
	  1 readlink                 0.00     0.00
	  1 realpath                 0.00     0.00
	  1 sed                      0.00     0.00
	  1 sort                     0.00     0.00
	  1 stty                     0.00     0.00
	  1 systemctl                0.00     0.00
	  1 template.sh              0.00     0.00
	  1 wc                       0.00     0.00
	  1 xrandr                   0.00     0.00
0 processes running
47 maximum processes
The computation pieces
      1620429) phpbench         cpu=8 start=5.73  finish=24.44
        1620430) php              cpu=2 start=5.74  finish=24.44
      1620433) phpbench         cpu=13 start=28.45 finish=46.71
        1620434) php              cpu=6 start=28.45 finish=46.71
      1620435) phpbench         cpu=5 start=50.71 finish=69.82
        1620436) php              cpu=14 start=50.71 finish=69.82