
A multi-media communication library. There are three tests. Overall not all cores are used.
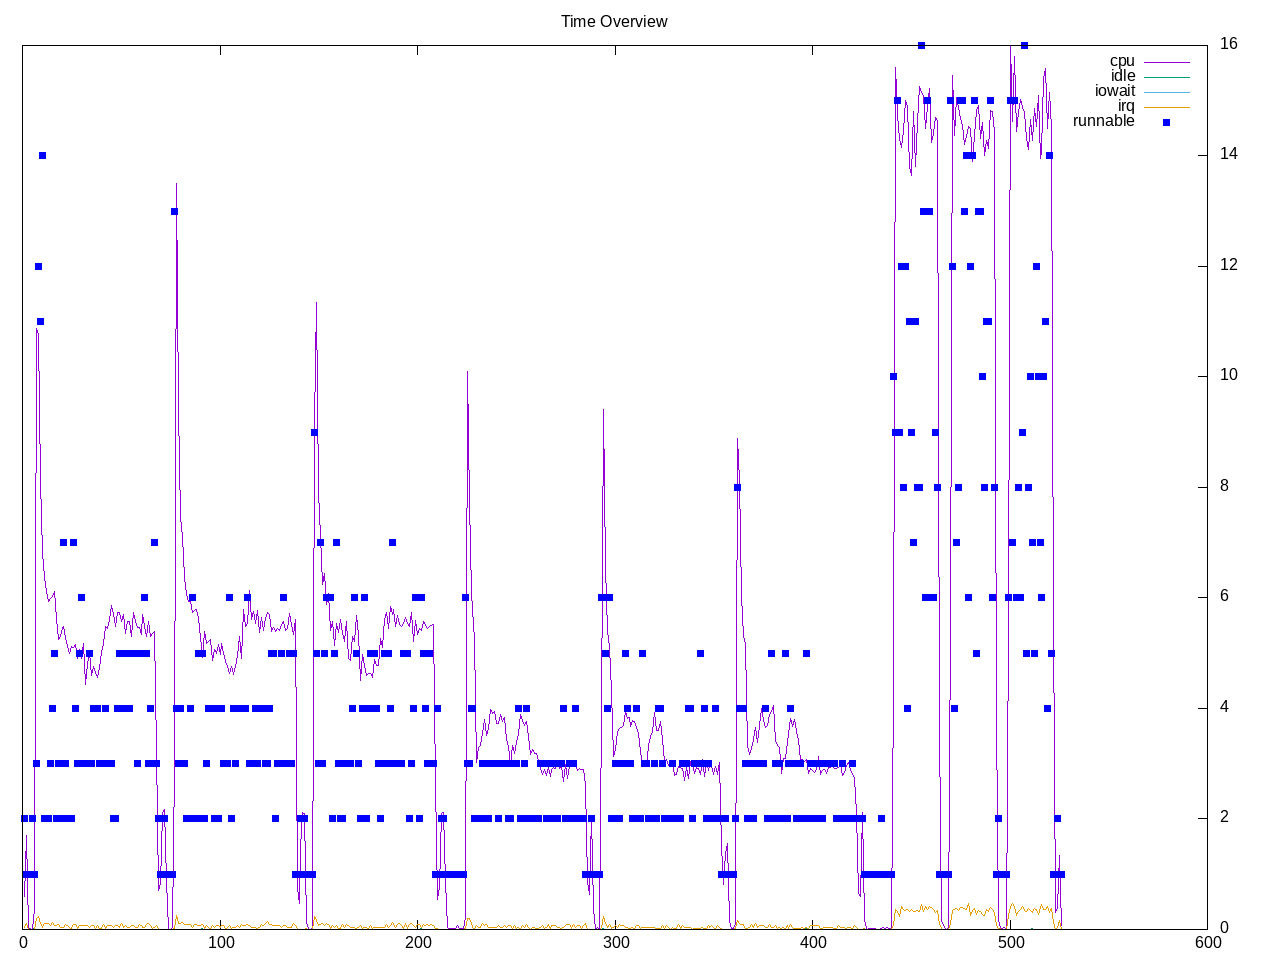
Topdown profile shows patterns for the first two workloads with increasing backend stalls and stead more front-end dominated third test.

AMD metrics confirm ~3 cores used. This has a low amount of floating point and some L2 access/miss. Retirement rate is low.
elapsed              872.680
on_cpu               0.181          # 2.90 / 16 cores
utime                1471.931
stime                1054.997
nvcsw                104739970      # 99.99%
nivcsw               13391          # 0.01%
inblock              0              # 0.00/sec
onblock              19360          # 22.18/sec
cpu-clock            2447341449035  # 2447.341 seconds
task-clock           2480102291249  # 2480.102 seconds
page faults          14806187       # 5969.990/sec
context switches     104757512      # 42239.190/sec
cpu migrations       205635         # 82.914/sec
major page faults    2              # 0.001/sec
minor page faults    14806185       # 5969.990/sec
alignment faults     0              # 0.000/sec
emulation faults     0              # 0.000/sec
branches             1128582198076  # 213.850 branches per 1000 inst
branch misses        47870033453    # 4.24% branch miss
conditional          693597720831   # 131.427 conditional branches per 1000 inst
indirect             48446812498    # 9.180 indirect branches per 1000 inst
cpu-cycles           4979308073975  # 0.60 GHz
instructions         3332596284211  # 0.67 IPC low
slots                9590503738338  #
retiring             1157720464051  # 12.1% (13.4%) low
-- ucode             5521946715     #     0.1%
-- fastpath          1152198517336  #    12.0%
frontend             3682466302037  # 38.4% (42.5%)
-- latency           2964712224432  #    30.9%
-- bandwidth         717754077605   #     7.5%
backend              3732946857573  # 38.9% (43.1%)
-- cpu               287450185120   #     3.0%
-- memory            3445496672453  #    35.9%
speculation          90555733372    #  0.9% ( 1.0%)
-- branch mispredict 89531846934    #     0.9%
-- pipeline restart  1023886438     #     0.0%
smt-contention       920983823302   #  9.6% ( 0.0%)
cpu-cycles           4974037708645  # 0.60 GHz
instructions         3337759127969  # 0.67 IPC low
instructions         1067429416158  # 77.346 l2 access per 1000 inst
l2 hit from l1       73991456271    # 23.13% l2 miss
l2 miss from l1      13819645625    #
l2 hit from l2 pf    3289759922     #
l3 hit from l2 pf    3690946118     #
l3 miss from l2 pf   1589510836     #
instructions         1062162717684  # 37.920 float per 1000 inst
float 512            70             # 0.000 AVX-512 per 1000 inst
float 256            376            # 0.000 AVX-256 per 1000 inst
float 128            40277396596    # 37.920 AVX-128 per 1000 inst
float MMX            0              # 0.000 MMX per 1000 inst
float scalar         0              # 0.000 scalar per 1000 inst
instructions         3271752497547  #
opcache              807851793032   # 246.917 opcache per 1000 inst
opcache miss         364522750050   # 45.1% opcache miss rate
l1 dTLB miss         18076511385    # 5.525 L1 dTLB per 1000 inst
l2 dTLB miss         6912031728     # 2.113 L2 dTLB per 1000 inst
instructions         3241047487847  #
icache               651603170877   # 201.047 icache per 1000 inst
icache miss          151656213181   # 23.3% icache miss rate
l1 iTLB miss         4500504772     # 1.389 L1 iTLB per 1000 inst
l2 iTLB miss         0              # 0.000 L2 iTLB per 1000 inst
tlb flush            27633          # 0.000 TLB flush per 1000 inst
Intel metrics show L2 contributing most to memory stalls.
elapsed              628.100
on_cpu               0.271          # 4.33 / 16 cores
utime                1091.855
stime                1629.278
nvcsw                151030991      # 99.93%
nivcsw               109554         # 0.07%
inblock              11128          # 17.72/sec
onblock              6552           # 10.43/sec
cpu-clock            2583472462864  # 2583.472 seconds
task-clock           2613444209838  # 2613.444 seconds
page faults          5468293        # 2092.370/sec
context switches     151143522      # 57833.078/sec
cpu migrations       1129211        # 432.078/sec
major page faults    75             # 0.029/sec
minor page faults    5468218        # 2092.342/sec
alignment faults     0              # 0.000/sec
emulation faults     0              # 0.000/sec
branches             648571518382   # 193.231 branches per 1000 inst
branch misses        6479755096     # 1.00% branch miss
conditional          648571535662   # 193.231 conditional branches per 1000 inst
indirect             184234923106   # 54.890 indirect branches per 1000 inst
slots                9992331641624  #
retiring             2316526686439  # 23.2% (23.2%)
-- ucode             271324146085   #     2.7%
-- fastpath          2045202540354  #    20.5%
frontend             3415663041163  # 34.2% (34.2%)
-- latency           2120574401746  #    21.2%
-- bandwidth         1295088639417  #    13.0%
backend              3818905787350  # 38.2% (38.2%)
-- cpu               1985792510508  #    19.9%
-- memory            1833113276842  #    18.3%
speculation          680472023318   #  6.8% ( 6.8%)
-- branch mispredict 627083874564   #     6.3%
-- pipeline restart  53388148754    #     0.5%
smt-contention       0              #  0.0% ( 0.0%)
cpu-cycles           6930631634594  # 0.68 GHz
instructions         3663941525969  # 0.53 IPC low
l2 access            120844116452   # 67.688 l2 access per 1000 inst
l2 miss              32589491360    # 26.97% l2 miss
cpu-cycles           3286115076954  # 40.3% memory latency
load stalls          1313147926015  #  7.7% l1 bound
l1 miss              1060648082367  #  6.0% l2 bound
l2 miss              862603162359   # 23.5% l3 bound
l3 miss              91443384427    #  2.8% dram bound
store_stalls         12488939402    #  0.4% store bound
Process overview shows pjsip-perf as the primary test process
768 processes
	304 pjsip-perf           31540.46 15983.96
	 68 clinfo                  19.84     5.99
	 38 vulkaninfo               1.71     1.33
	 80 threaded-ml              0.38     0.76
	  4 vulkani:disk$0           0.18     0.14
	  6 glxinfo:gdrv0            0.18     0.04
	  6 glxinfo:gl0              0.18     0.04
	  6 php                      0.09     0.17
	  2 llvmpipe-0               0.09     0.07
	  2 llvmpipe-1               0.09     0.07
	  2 llvmpipe-10              0.09     0.07
	  2 llvmpipe-11              0.09     0.07
	  2 llvmpipe-12              0.09     0.07
	  2 llvmpipe-13              0.09     0.07
	  2 llvmpipe-14              0.09     0.07
	  2 llvmpipe-15              0.09     0.07
	  2 llvmpipe-2               0.09     0.07
	  2 llvmpipe-3               0.09     0.07
	  2 llvmpipe-4               0.09     0.07
	  2 llvmpipe-5               0.09     0.07
	  2 llvmpipe-6               0.09     0.07
	  2 llvmpipe-7               0.09     0.07
	  2 llvmpipe-8               0.09     0.07
	  2 llvmpipe-9               0.09     0.07
	  2 glxinfo                  0.08     0.02
	  2 glxinfo:cs0              0.08     0.02
	  2 glxinfo:disk$0           0.08     0.02
	  2 glxinfo:sh0              0.08     0.02
	  2 glxinfo:shlo0            0.08     0.02
	  6 clang                    0.06     0.04
	  3 rocminfo                 0.06     0.00
	  1 lspci                    0.01     0.02
	 86 sh                       0.00     0.00
	 17 sed                      0.00     0.00
	 16 pjsip                    0.00     0.00
	 13 gcc                      0.00     0.00
	  9 gsettings                0.00     0.00
	  8 stat                     0.00     0.00
	  8 systemd-detect-          0.00     0.00
	  6 llvm-link                0.00     0.00
	  5 phoronix-test-s          0.00     0.00
	  4 gmain                    0.00     0.00
	  3 dconf worker             0.00     0.00
	  2 cc                       0.00     0.00
	  2 lscpu                    0.00     0.00
	  2 uname                    0.00     0.00
	  2 which                    0.00     0.00
	  2 xset                     0.00     0.00
	  1 date                     0.00     0.00
	  1 dirname                  0.00     0.00
	  1 dmesg                    0.00     0.00
	  1 dmidecode                0.00     0.00
	  1 grep                     0.00     0.00
	  1 ifconfig                 0.00     0.00
	  1 ip                       0.00     0.00
	  1 lsmod                    0.00     0.00
	  1 mktemp                   0.00     0.00
	  1 ps                       0.00     0.00
	  1 qdbus                    0.00     0.00
	  1 readlink                 0.00     0.00
	  1 realpath                 0.00     0.00
	  1 sort                     0.00     0.00
	  1 stty                     0.00     0.00
	  1 systemctl                0.00     0.00
	  1 template.sh              0.00     0.00
	  1 wc                       0.00     0.00
	  1 xrandr                   0.00     0.00
0 processes running
47 maximum processes
Computation blocks
      15666) pjsip            cpu=15 start=5.72  finish=71.82
        15667) pjsip-perf       cpu=15 start=5.72  finish=71.76
          15668) threaded-ml      cpu=9 start=5.74  finish=5.74
          15669) threaded-ml      cpu=13 start=5.74  finish=5.74
          15670) pjsip-perf       cpu=9 start=5.74  finish=5.74
          15671) pjsip-perf       cpu=12 start=5.74  finish=5.74
          15672) threaded-ml      cpu=2 start=5.74  finish=5.74
          15673) threaded-ml      cpu=1 start=5.74  finish=5.74
          15674) threaded-ml      cpu=9 start=6.05  finish=6.05
          15675) pjsip-perf       cpu=9 start=6.05  finish=69.52
          15676) pjsip-perf       cpu=8 start=6.05  finish=68.50
          15677) pjsip-perf       cpu=5 start=6.05  finish=68.56
          15678) pjsip-perf       cpu=3 start=6.05  finish=68.91
          15679) pjsip-perf       cpu=4 start=6.05  finish=68.48
          15680) pjsip-perf       cpu=12 start=6.05  finish=68.34
          15681) pjsip-perf       cpu=14 start=6.05  finish=68.76
          15682) pjsip-perf       cpu=15 start=6.05  finish=68.78
          15683) pjsip-perf       cpu=0 start=6.05  finish=68.48
          15684) pjsip-perf       cpu=6 start=6.05  finish=68.19
          15685) pjsip-perf       cpu=8 start=6.05  finish=68.72
          15686) pjsip-perf       cpu=3 start=6.05  finish=68.47
          15687) pjsip-perf       cpu=10 start=6.05  finish=68.52
          15688) pjsip-perf       cpu=1 start=6.05  finish=68.40
          15689) pjsip-perf       cpu=11 start=6.05  finish=68.87
          15690) pjsip-perf       cpu=7 start=6.05  finish=68.68
        15692) sed              cpu=8 start=71.82 finish=71.82