
PyBench is a benchmark suite for python. The test is single-threaded and have very high retirement rate and IPC. It is also short and quick.
Topdown profile shows a consistent high retirement rate.
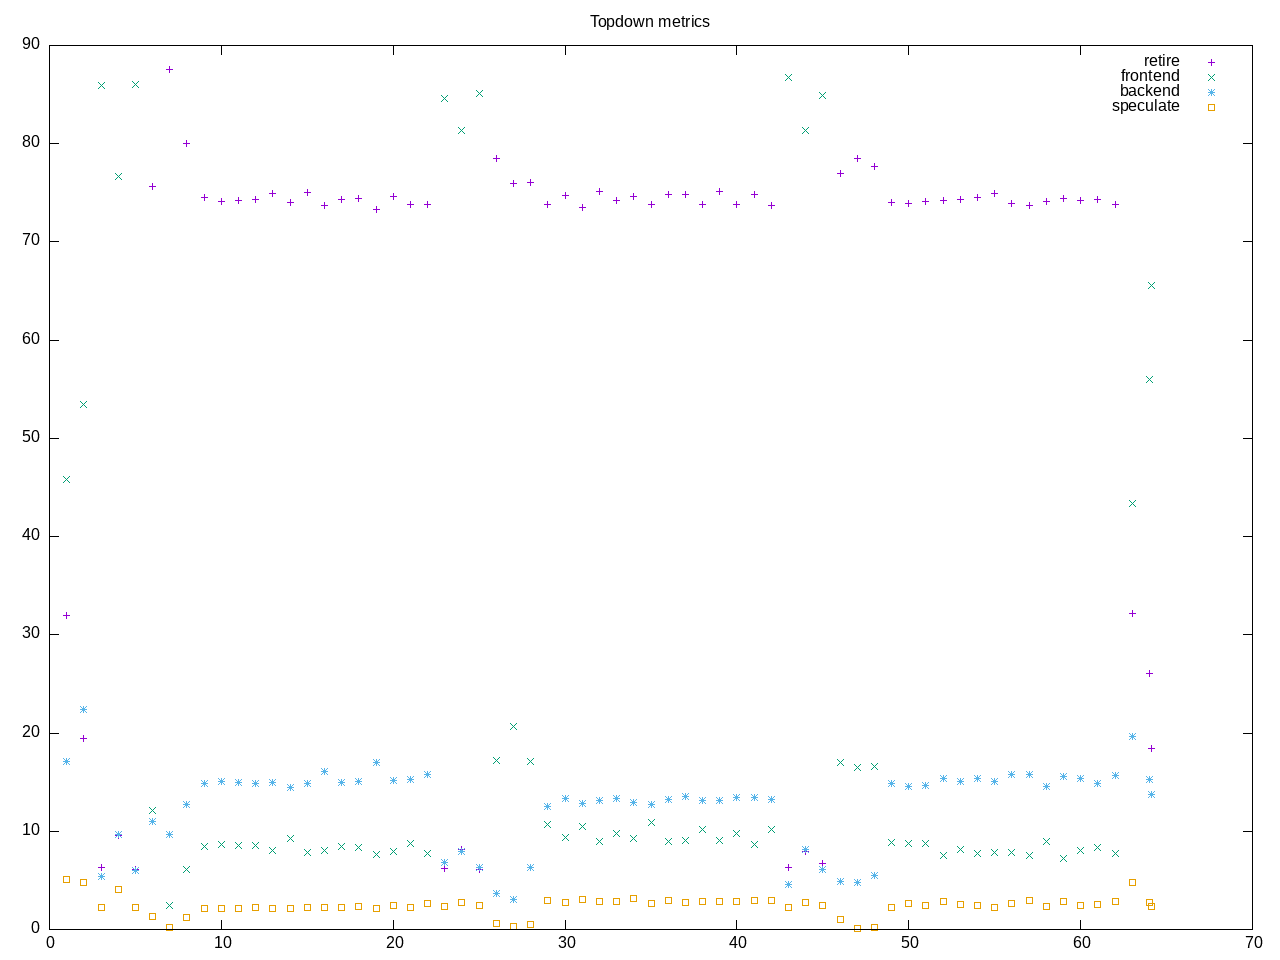
AMD metrics show very little floating point or L2 access. Both frontend and backend stalls are low.
elapsed              63.702
on_cpu               0.049          # 0.78 / 16 cores
utime                48.990
stime                0.793
nvcsw                1986           # 81.90%
nivcsw               439            # 18.10%
inblock              0              # 0.00/sec
onblock              12648          # 198.55/sec
cpu-clock            49805588772    # 49.806 seconds
task-clock           49808093050    # 49.808 seconds
page faults          160691         # 3226.203/sec
context switches     2564           # 51.478/sec
cpu migrations       270            # 5.421/sec
major page faults    2              # 0.040/sec
minor page faults    160689         # 3226.162/sec
alignment faults     0              # 0.000/sec
emulation faults     0              # 0.000/sec
branches             194912652988   # 186.412 branches per 1000 inst
branch misses        270411164      # 0.14% branch miss
conditional          154479730117   # 147.743 conditional branches per 1000 inst
indirect             18920311748    # 18.095 indirect branches per 1000 inst
cpu-cycles           374557890559   # 0.22 GHz
instructions         1734702413427  # 4.63 IPC high
slots                752332043412   #
retiring             561257349214   # 74.6% (74.6%) high
-- ucode             1483477360     #     0.2%
-- fastpath          559773871854   #    74.4%
frontend             77108360889    # 10.2% (10.3%)
-- latency           34005993816    #     4.5%
-- bandwidth         43102367073    #     5.7%
backend              97631998057    # 13.0% (13.0%) low
-- cpu               20007069354    #     2.7%
-- memory            77624928703    #    10.3%
speculation          16192947256    #  2.2% ( 2.2%)
-- branch mispredict 13204745243    #     1.8%
-- pipeline restart  2988202013     #     0.4%
smt-contention       141103425      #  0.0% ( 0.0%)
cpu-cycles           225789349951   # 0.22 GHz
instructions         1039703315363  # 4.60 IPC high
instructions         348255417695   # 1.063 l2 access per 1000 inst
l2 hit from l1       345411754      # 5.98% l2 miss
l2 miss from l1      13213404       #
l2 hit from l2 pf    15775251       #
l3 hit from l2 pf    4367477        #
l3 miss from l2 pf   4560360        #
instructions         347971571386   # 7.418 float per 1000 inst
float 512            52             # 0.000 AVX-512 per 1000 inst
float 256            580            # 0.000 AVX-256 per 1000 inst
float 128            2581105775     # 7.418 AVX-128 per 1000 inst
float MMX            0              # 0.000 MMX per 1000 inst
float scalar         13             # 0.000 scalar per 1000 inst
Intel metrics
elapsed              63.672
on_cpu               0.049          # 0.78 / 16 cores
utime                49.601
stime                0.357
nvcsw                1946           # 86.07%
nivcsw               315            # 13.93%
inblock              688            # 10.81/sec
onblock              1368           # 21.49/sec
cpu-clock            49970397576    # 49.970 seconds
task-clock           49972774658    # 49.973 seconds
page faults          149794         # 2997.512/sec
context switches     2408           # 48.186/sec
cpu migrations       202            # 4.042/sec
major page faults    1              # 0.020/sec
minor page faults    149793         # 2997.492/sec
alignment faults     0              # 0.000/sec
emulation faults     0              # 0.000/sec
branches             194468472774   # 185.970 branches per 1000 inst
branch misses        96408844       # 0.05% branch miss
conditional          194468484966   # 185.970 conditional branches per 1000 inst
indirect             18922715964    # 18.096 indirect branches per 1000 inst
slots                1132078905056  #
retiring             991835993221   # 87.6% (87.6%) high
-- ucode             47158698511    #     4.2%
-- fastpath          944677294710   #    83.4%
frontend             32564331849    #  2.9% ( 2.9%) low
-- latency           7632247901     #     0.7%
-- bandwidth         24932083948    #     2.2%
backend              61583929109    #  5.4% ( 5.4%) low
-- cpu               45713589376    #     4.0%
-- memory            15870339733    #     1.4%
speculation          31665658842    #  2.8% ( 2.8%)
-- branch mispredict 9823086021     #     0.9%
-- pipeline restart  21842572821    #     1.9%
smt-contention       0              #  0.0% ( 0.0%)
cpu-cycles           188457635434   # 0.18 GHz
instructions         1043848855562  # 5.54 IPC high
l2 access            693102729      # 0.664 l2 access per 1000 inst
l2 miss              98568390       # 14.22% l2 miss
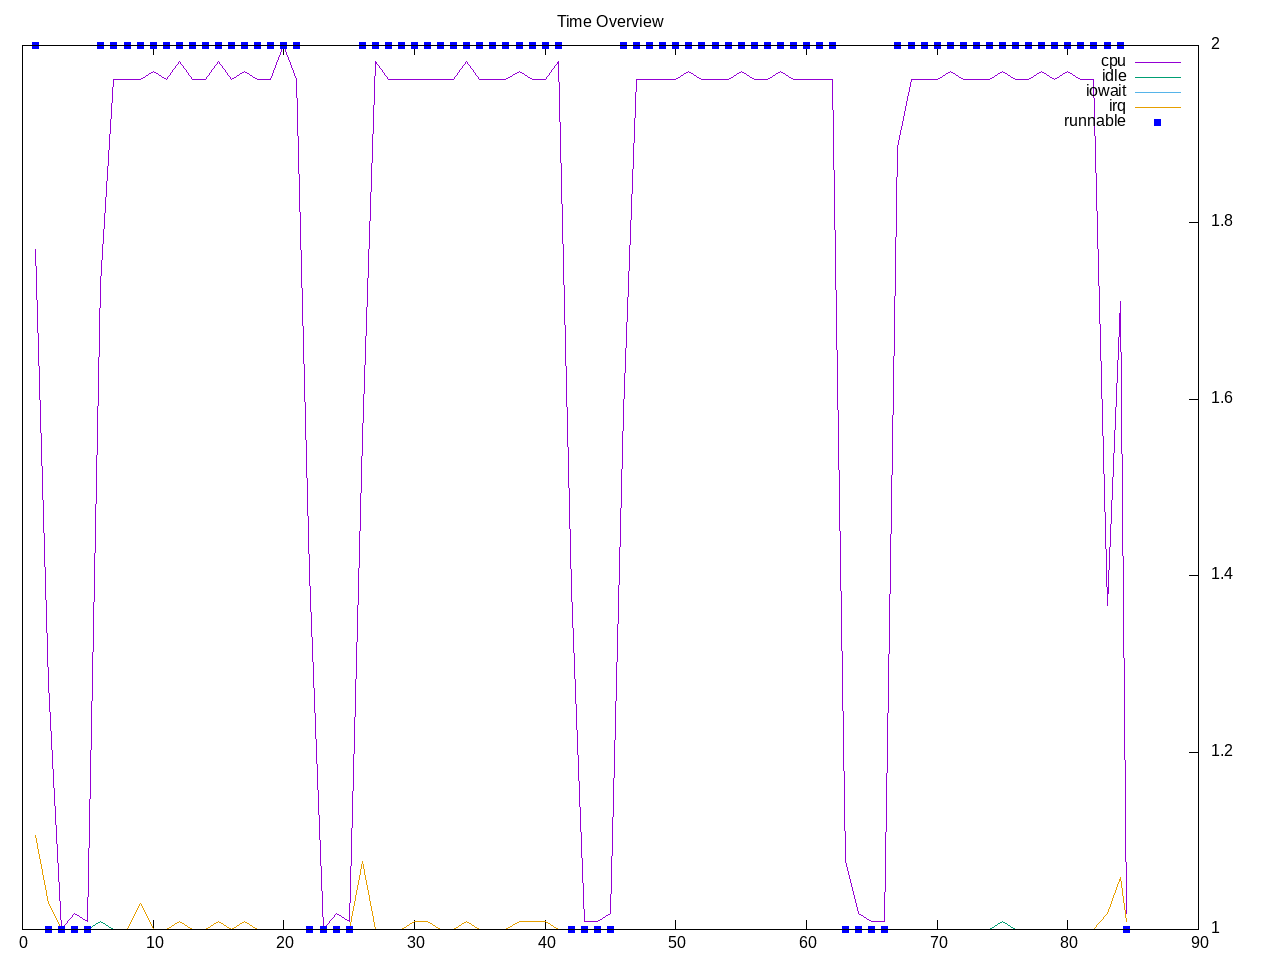
Process overview shows standard test overhead and four invocations of python
361 processes
	  4 python3                 48.35     0.02
	 68 clinfo                  18.20     4.66
	 38 vulkaninfo               0.95     1.34
	  6 glxinfo:gdrv0            0.12     0.07
	  6 glxinfo:gl0              0.12     0.07
	  4 vulkani:disk$0           0.10     0.15
	  6 php                      0.07     0.07
	  2 glxinfo                  0.06     0.03
	  2 glxinfo:cs0              0.06     0.03
	  2 glxinfo:disk$0           0.06     0.03
	  2 glxinfo:sh0              0.06     0.03
	  2 glxinfo:shlo0            0.06     0.03
	  2 llvmpipe-0               0.05     0.08
	  2 llvmpipe-1               0.05     0.08
	  2 llvmpipe-10              0.05     0.08
	  2 llvmpipe-11              0.05     0.08
	  2 llvmpipe-12              0.05     0.08
	  2 llvmpipe-13              0.05     0.08
	  2 llvmpipe-14              0.05     0.08
	  2 llvmpipe-15              0.05     0.08
	  2 llvmpipe-2               0.05     0.08
	  2 llvmpipe-3               0.05     0.08
	  2 llvmpipe-4               0.05     0.08
	  2 llvmpipe-5               0.05     0.08
	  2 llvmpipe-6               0.05     0.08
	  2 llvmpipe-7               0.05     0.08
	  2 llvmpipe-8               0.05     0.08
	  2 llvmpipe-9               0.05     0.08
	  6 clang                    0.03     0.09
	  3 rocminfo                 0.03     0.00
	  1 lspci                    0.00     0.01
	  1 ps                       0.00     0.01
	 83 sh                       0.00     0.00
	 12 gcc                      0.00     0.00
	  8 gsettings                0.00     0.00
	  8 stat                     0.00     0.00
	  8 systemd-detect-          0.00     0.00
	  6 llvm-link                0.00     0.00
	  5 gmain                    0.00     0.00
	  5 phoronix-test-s          0.00     0.00
	  5 uname                    0.00     0.00
	  3 dconf worker             0.00     0.00
	  3 file                     0.00     0.00
	  3 pybench                  0.00     0.00
	  2 lscpu                    0.00     0.00
	  2 which                    0.00     0.00
	  2 xset                     0.00     0.00
	  1 cc                       0.00     0.00
	  1 date                     0.00     0.00
	  1 dirname                  0.00     0.00
	  1 dmesg                    0.00     0.00
	  1 dmidecode                0.00     0.00
	  1 grep                     0.00     0.00
	  1 ifconfig                 0.00     0.00
	  1 ip                       0.00     0.00
	  1 lsmod                    0.00     0.00
	  1 mktemp                   0.00     0.00
	  1 python                   0.00     0.00
	  1 qdbus                    0.00     0.00
	  1 readlink                 0.00     0.00
	  1 realpath                 0.00     0.00
	  1 sed                      0.00     0.00
	  1 sort                     0.00     0.00
	  1 stty                     0.00     0.00
	  1 systemctl                0.00     0.00
	  1 template.sh              0.00     0.00
	  1 wc                       0.00     0.00
	  1 xrandr                   0.00     0.00
0 processes running
47 maximum processes
Computation section
      1622774) pybench          cpu=7 start=5.46  finish=21.52
        1622775) python3          cpu=2 start=5.46  finish=21.52
          1622776) file             cpu=11 start=5.49  finish=5.49
          1622777) uname            cpu=6 start=5.49  finish=5.49
      1622780) pybench          cpu=5 start=25.52 finish=41.88
        1622781) python3          cpu=6 start=25.52 finish=41.88
          1622782) file             cpu=15 start=25.55 finish=25.55
          1622783) uname            cpu=15 start=25.55 finish=25.55
      1622787) pybench          cpu=5 start=45.89 finish=61.89
        1622788) python3          cpu=6 start=45.89 finish=61.88
          1622789) file             cpu=15 start=45.92 finish=45.92
          1622790) uname            cpu=15 start=45.92 finish=45.92