
PyPerformance is the reference Python performance benchmark suite. It takes approximately 20x longer to run than pybench benchmark.It is however still single threaded. There are 13 subtests below with slightly different profiles and a few that are interrupt driven.

Topdown profile shows slight differences among the 13 workloads with most having high retirement rates but then some backend stalls and frontend stalls.
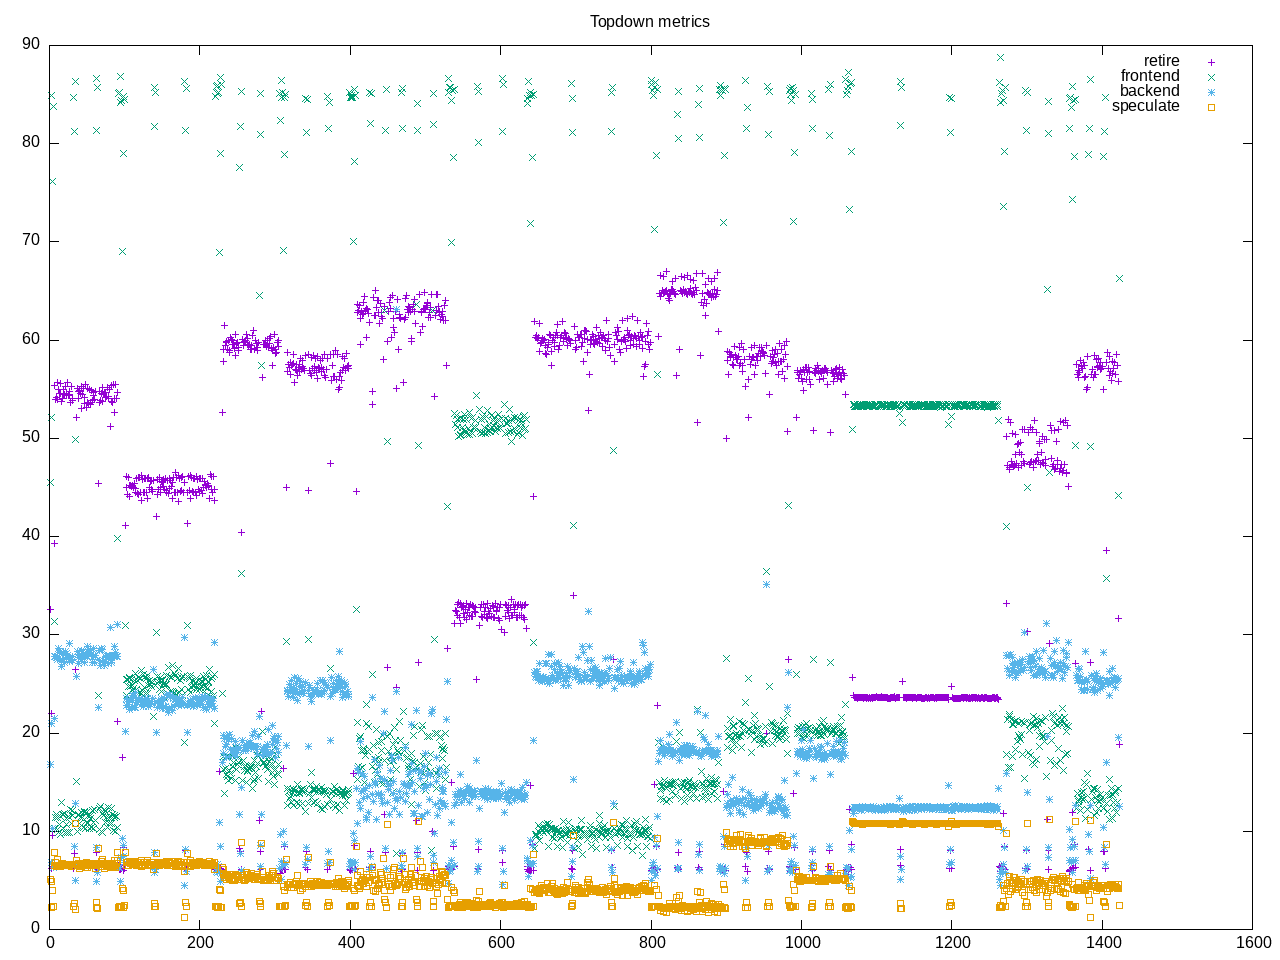
AMD metrics are a composite. This is still a workload with little floating point.
elapsed              1353.957
on_cpu               0.052          # 0.83 / 16 cores
utime                973.990
stime                147.482
nvcsw                94747          # 89.19%
nivcsw               11484          # 10.81%
inblock              0              # 0.00/sec
onblock              2035664        # 1503.49/sec
cpu-clock            1119830961587  # 1119.831 seconds
task-clock           1119904626937  # 1119.905 seconds
page faults          29943174       # 26737.254/sec
context switches     84047          # 75.048/sec
cpu migrations       3839           # 3.428/sec
major page faults    2              # 0.002/sec
minor page faults    29943172       # 26737.252/sec
alignment faults     0              # 0.000/sec
emulation faults     0              # 0.000/sec
branches             2994321577851  # 195.311 branches per 1000 inst
branch misses        28649603561    # 0.96% branch miss
conditional          2425795071846  # 158.228 conditional branches per 1000 inst
indirect             227999745660   # 14.872 indirect branches per 1000 inst
cpu-cycles           4689348425248  # 0.22 GHz
instructions         14736906286871 # 3.14 IPC high
slots                9924238921752  #
retiring             4920694875718  # 49.6% (49.6%)
-- ucode             11882730629    #     0.1%
-- fastpath          4908812145089  #    49.5%
frontend             2414939339008  # 24.3% (24.3%)
-- latency           1660300722108  #    16.7%
-- bandwidth         754638616900   #     7.6%
backend              2004798551184  # 20.2% (20.2%)
-- cpu               309889045759   #     3.1%
-- memory            1694909505425  #    17.1%
speculation          582435602064   #  5.9% ( 5.9%)
-- branch mispredict 521857008302   #     5.3%
-- pipeline restart  60578593762    #     0.6%
smt-contention       1369112675     #  0.0% ( 0.0%)
cpu-cycles           4558877170353  # 0.22 GHz
instructions         14265709084002 # 3.13 IPC high
instructions         4920908278314  # 22.496 l2 access per 1000 inst
l2 hit from l1       103761201510   # 8.27% l2 miss
l2 miss from l1      5618730997     #
l2 hit from l2 pf    3397082098     #
l3 hit from l2 pf    2981238540     #
l3 miss from l2 pf   560005053      #
instructions         4916752155881  # 10.649 float per 1000 inst
float 512            8949           # 0.000 AVX-512 per 1000 inst
float 256            58794          # 0.000 AVX-256 per 1000 inst
float 128            52357282574    # 10.649 AVX-128 per 1000 inst
float MMX            0              # 0.000 MMX per 1000 inst
float scalar         7035           # 0.000 scalar per 1000 inst
Intel metrics
elapsed              1643.309
on_cpu               0.052          # 0.83 / 16 cores
utime                1284.497
stime                87.323
nvcsw                119014         # 85.69%
nivcsw               19872          # 14.31%
inblock              99088          # 60.30/sec
onblock              2667160        # 1623.04/sec
cpu-clock            1368265116188  # 1368.265 seconds
task-clock           1368486534913  # 1368.487 seconds
page faults          30647479       # 22395.163/sec
context switches     118152         # 86.338/sec
cpu migrations       2880           # 2.105/sec
major page faults    426            # 0.311/sec
minor page faults    30647053       # 22394.852/sec
alignment faults     0              # 0.000/sec
emulation faults     0              # 0.000/sec
branches             3333799503012  # 193.531 branches per 1000 inst
branch misses        17891763254    # 0.54% branch miss
conditional          3333800440068  # 193.531 conditional branches per 1000 inst
indirect             263760873573   # 15.312 indirect branches per 1000 inst
slots                29643189116246 #
retiring             16016698426036 # 54.0% (54.0%) high
-- ucode             951310250035   #     3.2%
-- fastpath          15065388176001 #    50.8%
frontend             6104719705607  # 20.6% (20.6%)
-- latency           2443560383669  #     8.2%
-- bandwidth         3661159321938  #    12.4%
backend              4195516677023  # 14.2% (14.2%) low
-- cpu               3110800077212  #    10.5%
-- memory            1084716599811  #     3.7%
speculation          3297960168706  # 11.1% (11.1%) high
-- branch mispredict 2388958032173  #     8.1%
-- pipeline restart  909002136533   #     3.1%
smt-contention       0              #  0.0% ( 0.0%)
cpu-cycles           4884162551636  # 0.19 GHz
instructions         16802905156491 # 3.44 IPC high
l2 access            272007867054   # 16.198 l2 access per 1000 inst
l2 miss              29076273170    # 10.69% l2 miss
Process overview shows a large number of python processes started
29122 processes
	25720 python                 856.28    58.98
	 68 clinfo                  16.87     5.99
	 38 vulkaninfo               1.12     1.31
	 39 python3.10               0.43     0.05
	  6 php                      0.13     0.42
	  4 vulkani:disk$0           0.11     0.13
	  6 glxinfo:gdrv0            0.09     0.09
	  6 glxinfo:gl0              0.09     0.09
	  2 llvmpipe-0               0.06     0.07
	  2 llvmpipe-1               0.06     0.07
	  2 llvmpipe-10              0.06     0.07
	  2 llvmpipe-11              0.06     0.07
	  2 llvmpipe-12              0.06     0.07
	  2 llvmpipe-13              0.06     0.07
	  2 llvmpipe-14              0.06     0.07
	  2 llvmpipe-15              0.06     0.07
	  2 llvmpipe-2               0.06     0.07
	  2 llvmpipe-3               0.06     0.07
	  2 llvmpipe-4               0.06     0.07
	  2 llvmpipe-5               0.06     0.07
	  2 llvmpipe-6               0.06     0.07
	  2 llvmpipe-7               0.06     0.07
	  2 llvmpipe-8               0.06     0.07
	  2 llvmpipe-9               0.06     0.07
	  6 clang                    0.06     0.06
	  2 glxinfo                  0.05     0.04
	  2 glxinfo:cs0              0.05     0.04
	  2 glxinfo:disk$0           0.05     0.04
	  2 glxinfo:sh0              0.05     0.04
	  2 glxinfo:shlo0            0.05     0.04
	  3 rocminfo                 0.04     0.00
	  1 lspci                    0.00     0.02
	  1 ps                       0.00     0.01
	1601 uname                    0.00     0.00
	1353 file                     0.00     0.00
	107 sh                       0.00     0.00
	 39 pyperformance            0.00     0.00
	 12 gcc                      0.00     0.00
	  8 gsettings                0.00     0.00
	  8 stat                     0.00     0.00
	  8 systemd-detect-          0.00     0.00
	  6 llvm-link                0.00     0.00
	  5 gmain                    0.00     0.00
	  5 phoronix-test-s          0.00     0.00
	  3 dconf worker             0.00     0.00
	  2 lscpu                    0.00     0.00
	  2 which                    0.00     0.00
	  2 xset                     0.00     0.00
	  1 cc                       0.00     0.00
	  1 date                     0.00     0.00
	  1 dirname                  0.00     0.00
	  1 dmesg                    0.00     0.00
	  1 dmidecode                0.00     0.00
	  1 grep                     0.00     0.00
	  1 ifconfig                 0.00     0.00
	  1 ip                       0.00     0.00
	  1 lsmod                    0.00     0.00
	  1 mktemp                   0.00     0.00
	  1 python3                  0.00     0.00
	  1 qdbus                    0.00     0.00
	  1 readlink                 0.00     0.00
	  1 realpath                 0.00     0.00
	  1 sed                      0.00     0.00
	  1 sort                     0.00     0.00
	  1 stty                     0.00     0.00
	  1 systemctl                0.00     0.00
	  1 template.sh              0.00     0.00
	  1 wc                       0.00     0.00
	  1 xrandr                   0.00     0.00
0 processes running
47 maximum processes