
Measurements on 64-bit resnet 50 model
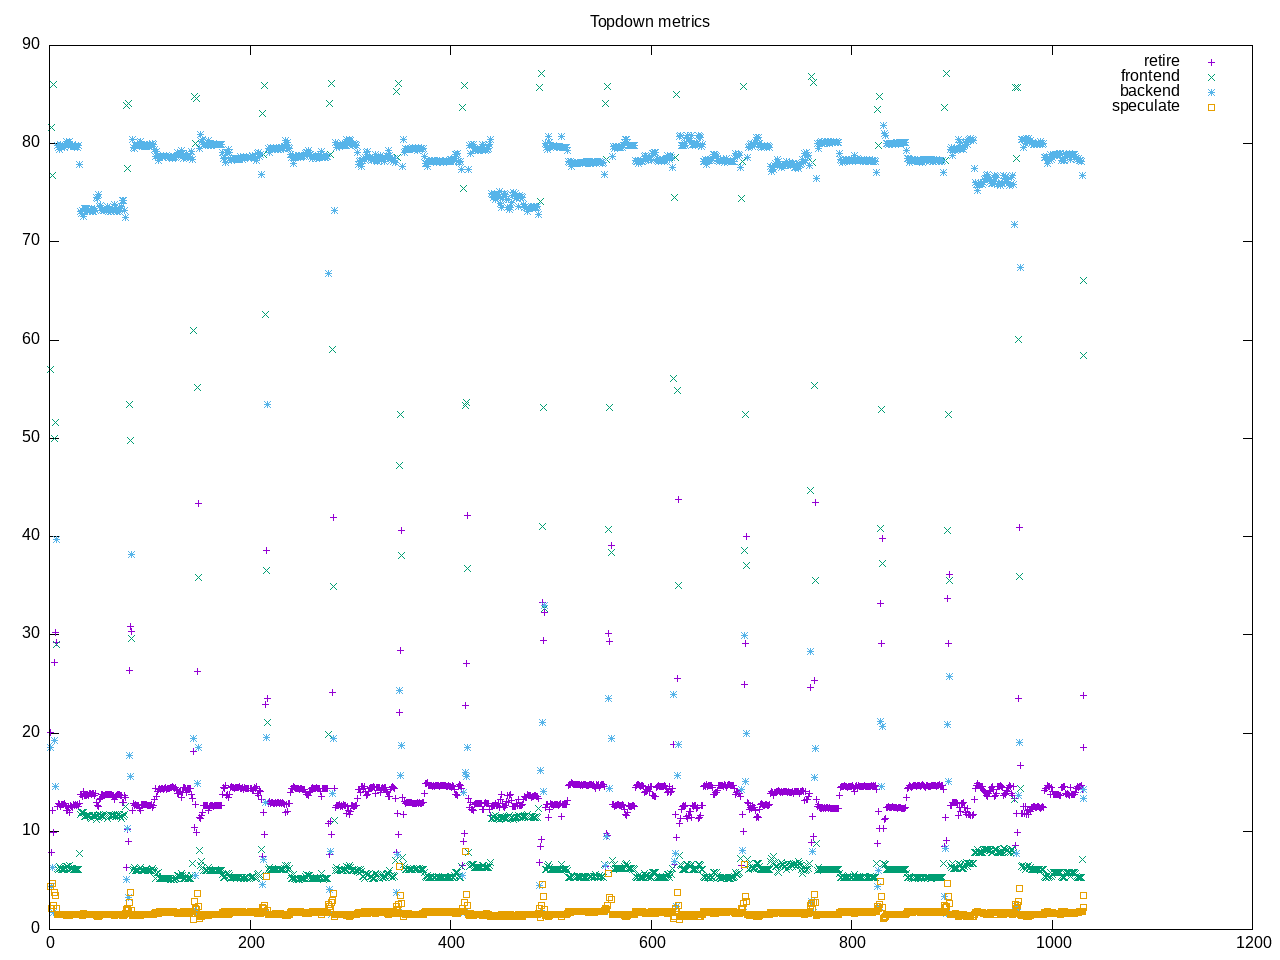
AMD metrics show a backend dominated benchmark with both memory and cpu contributing also showing both floating point and l2. It seemed to take multiple iterations to get to a converged result, contributing to higher elapsed time.
elapsed              888.295
on_cpu               0.453          # 7.25 / 16 cores
utime                6368.016
stime                73.376
nvcsw                6468           # 5.12%
nivcsw               119800         # 94.88%
inblock              205464
onblock              6536
cpu-clock            6441494326501  # 6441.494 seconds
task-clock           6441511010764  # 6441.511 seconds
page faults          28365221       # 4403.504/sec
context switches     130370         # 20.239/sec
cpu migrations       6329           # 0.983/sec
major page faults    1083           # 0.168/sec
minor page faults    28364137       # 4403.336/sec
alignment faults     0              # 0.000/sec
emulation faults     0              # 0.000/sec
branches             1019213674222  # 47.300 branches per 1000 inst
branch misses        25970276858    # 2.55% branch miss
conditional          863766043503   # 40.086 conditional branches per 1000 inst
indirect             29448001923    # 1.367 indirect branches per 1000 inst
cpu-cycles           6626976423794  # 2.01 GHz
instructions         4933090739402  # 0.74 IPC
slots                13246150286592 #
retiring             1704776212319  # 12.9% (13.6%)
-- ucode             9812416382     #     0.1%
-- fastpath          1694963795937  #    12.8%
frontend             763514723827   #  5.8% ( 6.1%)
-- latency           428385176334   #     3.2%
-- bandwidth         335129547493   #     2.5%
backend              9833869333399  # 74.2% (78.6%)
-- cpu               5375257224574  #    40.6%
-- memory            4458612108825  #    33.7%
speculation          201506860099   #  1.5% ( 1.6%)
-- branch mispredict 188020274940   #     1.4%
-- pipeline restart  13486585159    #     0.1%
smt-contention       741610871065   #  5.6% ( 0.0%)
cpu-cycles           17451458172063 # 2.02 GHz
instructions         13133820486750 # 0.75 IPC
instructions         4385559673728  # 102.068 l2 access per 1000 inst
l2 hit from l1       330912826682   # 19.66% l2 miss
l2 miss from l1      34680239069    #
l2 hit from l2 pf    63389477231    #
l3 hit from l2 pf    41640256311    #
l3 miss from l2 pf   11684225833    #
instructions         4372833455503  # 42.240 float per 1000 inst
float 512            74             # 0.000 AVX-512 per 1000 inst
float 256            5854           # 0.000 AVX-256 per 1000 inst
float 128            184710215223   # 42.240 AVX-128 per 1000 inst
float MMX            0              # 0.000 MMX per 1000 inst
float scalar         192            # 0.000 scalar per 1000 inst
Intel metrics
elapsed              345.548
on_cpu               0.703          # 11.25 / 16 cores
utime                3845.621
stime                42.453
nvcsw                1954           # 22.18%
nivcsw               6857           # 77.82%
inblock              33480
onblock              2536
cpu-clock            3888106007754  # 3888.106 seconds
task-clock           3888114503534  # 3888.115 seconds
page faults          17596747       # 4525.779/sec
context switches     10341          # 2.660/sec
cpu migrations       2785           # 0.716/sec
major page faults    306            # 0.079/sec
minor page faults    17596441       # 4525.700/sec
alignment faults     0              # 0.000/sec
emulation faults     0              # 0.000/sec
branches             346992734665   # 33.484 branches per 1000 inst
branch misses        5921009494     # 1.71% branch miss
conditional          346992747081   # 33.484 conditional branches per 1000 inst
indirect             122858659034   # 11.856 indirect branches per 1000 inst
slots                122967048504506 #
retiring             19592997128790 # 15.9% (15.9%)
-- ucode             1405051710420  #     1.1%
-- fastpath          18187945418370 #    14.8%
frontend             3831999650714  #  3.1% ( 3.1%)
-- latency           2414419492941  #     2.0%
-- bandwidth         1417580157773  #     1.2%
backend              98025673596023 # 79.7% (79.7%)
-- cpu               83254741022304 #    67.7%
-- memory            14770932573719 #    12.0%
speculation          2625657274843  #  2.1% ( 2.1%)
-- branch mispredict 2298959158532  #     1.9%
-- pipeline restart  326698116311   #     0.3%
smt-contention       0              #  0.0% ( 0.0%)
cpu-cycles           5989513323133  # 1.11 GHz
instructions         5532177304949  # 0.92 IPC
l2 access            180309976145   # 48.391 l2 access per 1000 inst
l2 miss              62476631641    # 34.65% l2 miss
As expected, time is spent in python process
386 processes
	 86 python3              36006.91   113.28
	 38 vulkaninfo               0.76     1.14
	  4 vulkani:disk$0           0.08     0.12
	  6 php                      0.06     0.06
	  2 llvmpipe-0               0.04     0.06
	  2 llvmpipe-1               0.04     0.06
	  2 llvmpipe-10              0.04     0.06
	  2 llvmpipe-11              0.04     0.06
	  2 llvmpipe-12              0.04     0.06
	  2 llvmpipe-13              0.04     0.06
	  2 llvmpipe-14              0.04     0.06
	  2 llvmpipe-15              0.04     0.06
	  2 llvmpipe-2               0.04     0.06
	  2 llvmpipe-3               0.04     0.06
	  2 llvmpipe-4               0.04     0.06
	  2 llvmpipe-5               0.04     0.06
	  2 llvmpipe-6               0.04     0.06
	  2 llvmpipe-7               0.04     0.06
	  2 llvmpipe-8               0.04     0.06
	  2 llvmpipe-9               0.04     0.06
	  6 clang                    0.04     0.05
	  1 lspci                    0.00     0.03
	 88 sh                       0.00     0.00
	 12 gcc                      0.00     0.00
	  9 stty                     0.00     0.00
	  8 gsettings                0.00     0.00
	  8 stat                     0.00     0.00
	  8 systemd-detect-          0.00     0.00
	  8 uname                    0.00     0.00
	  6 file                     0.00     0.00
	  6 llvm-link                0.00     0.00
	  5 glxinfo                  0.00     0.00
	  5 gmain                    0.00     0.00
	  5 lscpu                    0.00     0.00
	  5 phoronix-test-s          0.00     0.00
	  4 dmesg                    0.00     0.00
	  3 cat                      0.00     0.00
	  3 dconf worker             0.00     0.00
	  3 pytorch                  0.00     0.00
	  3 sysctl                   0.00     0.00
	  2 grep                     0.00     0.00
	  2 setterm                  0.00     0.00
	  2 which                    0.00     0.00
	  1 cc                       0.00     0.00
	  1 date                     0.00     0.00
	  1 dirname                  0.00     0.00
	  1 dmidecode                0.00     0.00
	  1 ifconfig                 0.00     0.00
	  1 ip                       0.00     0.00
	  1 lsmod                    0.00     0.00
	  1 mktemp                   0.00     0.00
	  1 ps                       0.00     0.00
	  1 readlink                 0.00     0.00
	  1 realpath                 0.00     0.00
	  1 sed                      0.00     0.00
	  1 sort                     0.00     0.00
	  1 systemctl                0.00     0.00
	  1 template.sh              0.00     0.00
	  1 wc                       0.00     0.00
The core section seems to run several processes per core.
      496689) pytorch start=71.27 finish=133.98
        496690) python3 start=71.27 finish=133.94
          496691) python3 start=71.53 finish=133.94
          496692) python3 start=71.53 finish=133.94
          496693) python3 start=71.53 finish=133.94
          496694) python3 start=71.53 finish=133.94
          496695) python3 start=71.53 finish=133.94
          496696) python3 start=71.53 finish=133.94
          496697) python3 start=71.53 finish=133.94
          496698) python3 start=71.53 finish=133.94
          496699) python3 start=71.53 finish=133.94
          496700) python3 start=71.53 finish=133.94
          496701) python3 start=71.53 finish=133.94
          496702) python3 start=71.53 finish=133.94
          496703) python3 start=71.53 finish=133.94
          496704) python3 start=71.53 finish=133.94
          496705) python3 start=71.53 finish=133.94
          496706) file start=72.23 finish=72.23
          496707) uname start=72.23 finish=72.23
          496708) python3 start=72.41 finish=73.48
            496709) file start=72.44 finish=72.44
            496710) uname start=72.44 finish=72.44
            496711) cat start=72.44 finish=72.45
            496712) lscpu start=72.45 finish=72.45
            496713) sysctl start=72.45 finish=72.45
            496714) dmesg start=72.46 finish=72.46
            496715) python3 start=72.46 finish=73.47
              496716) python3 start=73.47 finish=73.47
          496717) python3 start=73.48 finish=73.48
          496718) python3 start=73.49 finish=133.71
          496719) python3 start=73.49 finish=133.94
          496720) python3 start=73.49 finish=133.94
          496721) python3 start=73.49 finish=133.94
          496722) python3 start=73.49 finish=133.94
          496723) python3 start=73.49 finish=133.94
          496724) python3 start=73.49 finish=133.94
          496725) python3 start=73.49 finish=133.94
          496726) python3 start=75.59 finish=133.90