
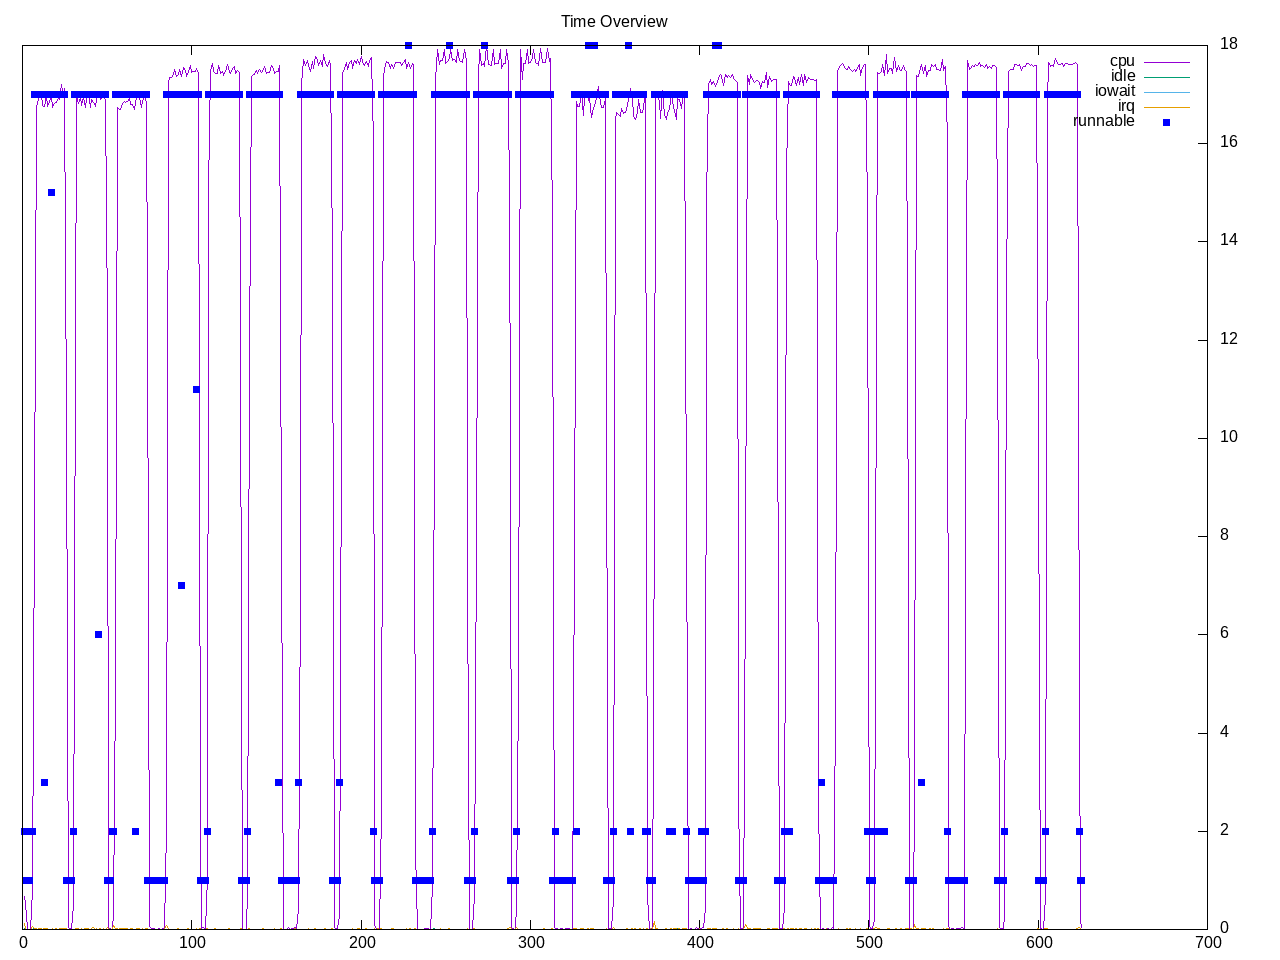
A real-time vector ray-tracing engine. There are eight subtests. These run on all cores.
Topdown profile shows these mostly backend bound with few frontend stalls.
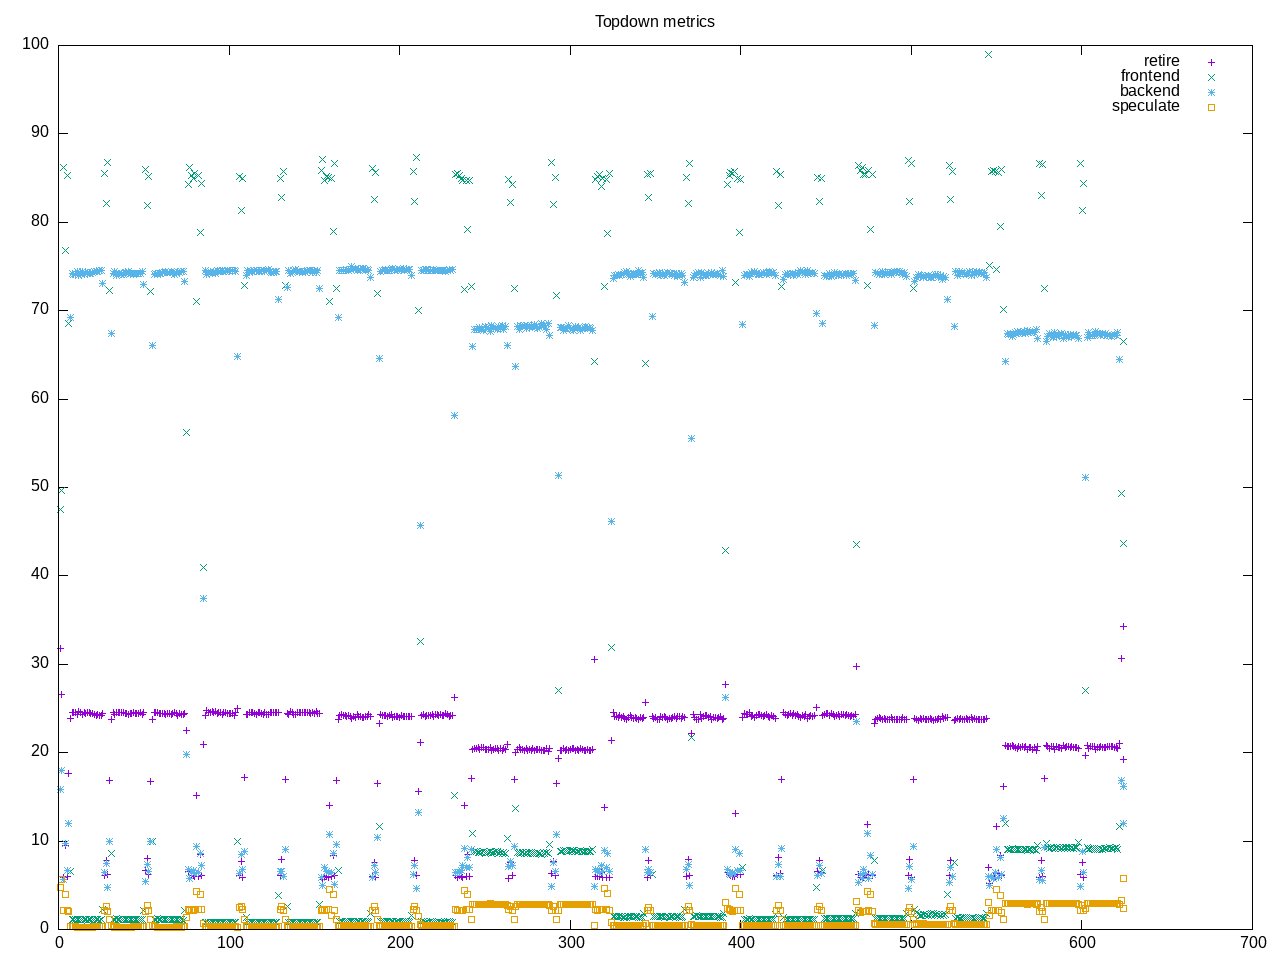
AMD metrics show backend stalls split between CPU and memory. There is not much floating point code.
elapsed              625.743
on_cpu               0.714          # 11.42 / 16 cores
utime                7119.296
stime                28.262
nvcsw                543310         # 80.96%
nivcsw               127794         # 19.04%
inblock              0              # 0.00/sec
onblock              14424          # 23.05/sec
cpu-clock            7147322701511  # 7147.323 seconds
task-clock           7147938611459  # 7147.939 seconds
page faults          9605265        # 1343.781/sec
context switches     674000         # 94.293/sec
cpu migrations       2367           # 0.331/sec
major page faults    77             # 0.011/sec
minor page faults    9605188        # 1343.770/sec
alignment faults     0              # 0.000/sec
emulation faults     0              # 0.000/sec
branches             2213138560582  # 83.291 branches per 1000 inst
branch misses        17501902038    # 0.79% branch miss
conditional          1933794071567  # 72.778 conditional branches per 1000 inst
indirect             163873148      # 0.006 indirect branches per 1000 inst
cpu-cycles           26735053193850 # 2.68 GHz
instructions         26540275610856 # 0.99 IPC
slots                53478182239044 #
retiring             9404982091633  # 17.6% (23.2%)
-- ucode             23083359398    #     0.0%
-- fastpath          9381898732235  #    17.5%
frontend             1432749254238  #  2.7% ( 3.5%) low
-- latency           913772041278   #     1.7%
-- bandwidth         518977212960   #     1.0%
backend              29314007637038 # 54.8% (72.2%) high
-- cpu               15535825778777 #    29.1%
-- memory            13778181858261 #    25.8%
speculation          433053049363   #  0.8% ( 1.1%)
-- branch mispredict 301142558895   #     0.6%
-- pipeline restart  131910490468   #     0.2%
smt-contention       12893301100630 # 24.1% ( 0.0%)
cpu-cycles           26684097340491 # 2.63 GHz
instructions         26508111828655 # 0.99 IPC
instructions         8838043367721  # 217.120 l2 access per 1000 inst
l2 hit from l1       1452674025909  # 0.93% l2 miss
l2 miss from l1      11743811973    #
l2 hit from l2 pf    460145048721   #
l3 hit from l2 pf    4891501169     #
l3 miss from l2 pf   1201823009     #
instructions         8829963878485  # 31.739 float per 1000 inst
float 512            85             # 0.000 AVX-512 per 1000 inst
float 256            468            # 0.000 AVX-256 per 1000 inst
float 128            280256805592   # 31.739 AVX-128 per 1000 inst
float MMX            0              # 0.000 MMX per 1000 inst
float scalar         0              # 0.000 scalar per 1000 inst
instructions         26550065692299 #
opcache              4885638845761  # 184.016 opcache per 1000 inst
opcache miss         188790824089   #  3.9% opcache miss rate
l1 dTLB miss         218391826788   # 8.226 L1 dTLB per 1000 inst
l2 dTLB miss         2754869850     # 0.104 L2 dTLB per 1000 inst
instructions         26547412969503 #
icache               244980878191   # 9.228 icache per 1000 inst
icache miss          21417678897    #  8.7% icache miss rate
l1 iTLB miss         9824289        # 0.000 L1 iTLB per 1000 inst
l2 iTLB miss         0              # 0.000 L2 iTLB per 1000 inst
tlb flush            42902          # 0.000 TLB flush per 1000 inst
Intel metrics show most of the backend memory stalls are L1 and L2
elapsed              628.053
on_cpu               0.558          # 8.93 / 16 cores
utime                5593.746
stime                15.852
nvcsw                225970         # 79.57%
nivcsw               58003          # 20.43%
inblock              3232           # 5.15/sec
onblock              2664           # 4.24/sec
cpu-clock            5608322435946  # 5608.322 seconds
task-clock           5608584641226  # 5608.585 seconds
page faults          9542595        # 1701.427/sec
context switches     286886         # 51.151/sec
cpu migrations       3881           # 0.692/sec
major page faults    104            # 0.019/sec
minor page faults    9542491        # 1701.408/sec
alignment faults     0              # 0.000/sec
emulation faults     0              # 0.000/sec
branches             1680443054208  # 85.552 branches per 1000 inst
branch misses        10375087163    # 0.62% branch miss
conditional          1680443078208  # 85.552 conditional branches per 1000 inst
indirect             515691696613   # 26.254 indirect branches per 1000 inst
slots                21897839692094 #
retiring             9731326497537  # 44.4% (44.4%)
-- ucode             413075777081   #     1.9%
-- fastpath          9318250720456  #    42.6%
frontend             4331544860416  # 19.8% (19.8%)
-- latency           3653140251914  #    16.7%
-- bandwidth         678404608502   #     3.1%
backend              7277613673818  # 33.2% (33.2%)
-- cpu               2606213574374  #    11.9%
-- memory            4671400099444  #    21.3%
speculation          604514458652   #  2.8% ( 2.8%)
-- branch mispredict 537968863823   #     2.5%
-- pipeline restart  66545594829    #     0.3%
smt-contention       0              #  0.0% ( 0.0%)
cpu-cycles           13966210798435 # 1.34 GHz
instructions         19034644351405 # 1.36 IPC
l2 access            516811085855   # 52.304 l2 access per 1000 inst
l2 miss              5176108418     # 1.00% l2 miss
cpu-cycles           7239863197863  # 37.8% memory latency
load stalls          2649725159323  # 16.7% l1 bound
l1 miss              1442347735969  # 19.8% l2 bound
l2 miss              9228044552     #  0.1% l3 bound
l3 miss              4311222790     #  0.1% dram bound
store_stalls         85504284960    #  1.2% store bound
Process overview shows RooT.x64f64 as the primary process
796 processes
	408 RooT.x64f64          121183.97   394.41
	 68 clinfo                  15.21     7.64
	 38 vulkaninfo               1.33     1.15
	  6 php                      0.14     0.15
	  4 vulkani:disk$0           0.14     0.12
	  6 glxinfo:gdrv0            0.09     0.09
	  6 glxinfo:gl0              0.09     0.09
	  6 clang                    0.08     0.04
	  2 llvmpipe-0               0.07     0.06
	  2 llvmpipe-1               0.07     0.06
	  2 llvmpipe-10              0.07     0.06
	  2 llvmpipe-11              0.07     0.06
	  2 llvmpipe-12              0.07     0.06
	  2 llvmpipe-13              0.07     0.06
	  2 llvmpipe-14              0.07     0.06
	  2 llvmpipe-15              0.07     0.06
	  2 llvmpipe-2               0.07     0.06
	  2 llvmpipe-3               0.07     0.06
	  2 llvmpipe-4               0.07     0.06
	  2 llvmpipe-5               0.07     0.06
	  2 llvmpipe-6               0.07     0.06
	  2 llvmpipe-7               0.07     0.06
	  2 llvmpipe-8               0.07     0.06
	  2 llvmpipe-9               0.07     0.06
	  2 glxinfo                  0.05     0.03
	  2 glxinfo:cs0              0.05     0.03
	  2 glxinfo:disk$0           0.05     0.03
	  2 glxinfo:sh0              0.05     0.03
	  2 glxinfo:shlo0            0.05     0.03
	  3 rocminfo                 0.03     0.00
	  1 lspci                    0.01     0.01
	  1 ps                       0.00     0.01
	 97 sh                       0.00     0.00
	 24 quadray                  0.00     0.00
	 13 gcc                      0.00     0.00
	 13 gsettings                0.00     0.00
	  9 systemd-detect-          0.00     0.00
	  8 stat                     0.00     0.00
	  6 llvm-link                0.00     0.00
	  5 phoronix-test-s          0.00     0.00
	  3 gmain                    0.00     0.00
	  2 cc                       0.00     0.00
	  2 lscpu                    0.00     0.00
	  2 uname                    0.00     0.00
	  2 which                    0.00     0.00
	  2 xset                     0.00     0.00
	  1 date                     0.00     0.00
	  1 dirname                  0.00     0.00
	  1 dmesg                    0.00     0.00
	  1 dmidecode                0.00     0.00
	  1 grep                     0.00     0.00
	  1 ifconfig                 0.00     0.00
	  1 ip                       0.00     0.00
	  1 lsmod                    0.00     0.00
	  1 mktemp                   0.00     0.00
	  1 qdbus                    0.00     0.00
	  1 readlink                 0.00     0.00
	  1 realpath                 0.00     0.00
	  1 sed                      0.00     0.00
	  1 sort                     0.00     0.00
	  1 stty                     0.00     0.00
	  1 systemctl                0.00     0.00
	  1 template.sh              0.00     0.00
	  1 wc                       0.00     0.00
	  1 xrandr                   0.00     0.00
0 processes running
47 maximum processes
Computation blocks
      22741) quadray          cpu=13 start=5.64  finish=25.78
        22742) RooT.x64f64      cpu=9 start=5.64  finish=25.78
          22743) RooT.x64f64      cpu=0 start=5.64  finish=25.77
          22744) RooT.x64f64      cpu=1 start=5.64  finish=25.77
          22745) RooT.x64f64      cpu=2 start=5.64  finish=25.77
          22746) RooT.x64f64      cpu=3 start=5.64  finish=25.77
          22747) RooT.x64f64      cpu=4 start=5.64  finish=25.77
          22748) RooT.x64f64      cpu=5 start=5.64  finish=25.77
          22749) RooT.x64f64      cpu=6 start=5.64  finish=25.77
          22750) RooT.x64f64      cpu=7 start=5.64  finish=25.77
          22751) RooT.x64f64      cpu=8 start=5.64  finish=25.77
          22752) RooT.x64f64      cpu=9 start=5.64  finish=25.77
          22753) RooT.x64f64      cpu=10 start=5.64  finish=25.77
          22754) RooT.x64f64      cpu=11 start=5.64  finish=25.77
          22755) RooT.x64f64      cpu=12 start=5.64  finish=25.77
          22756) RooT.x64f64      cpu=13 start=5.64  finish=25.77
          22757) RooT.x64f64      cpu=14 start=5.64  finish=25.77
          22758) RooT.x64f64      cpu=15 start=5.64  finish=25.77