
This test looks like a variation of the stream benchmark with copy/scale/triad and average. It uses floating point and integer data types. It looks to be mostly one or two threads.

Topdown profile shows a backend bound program
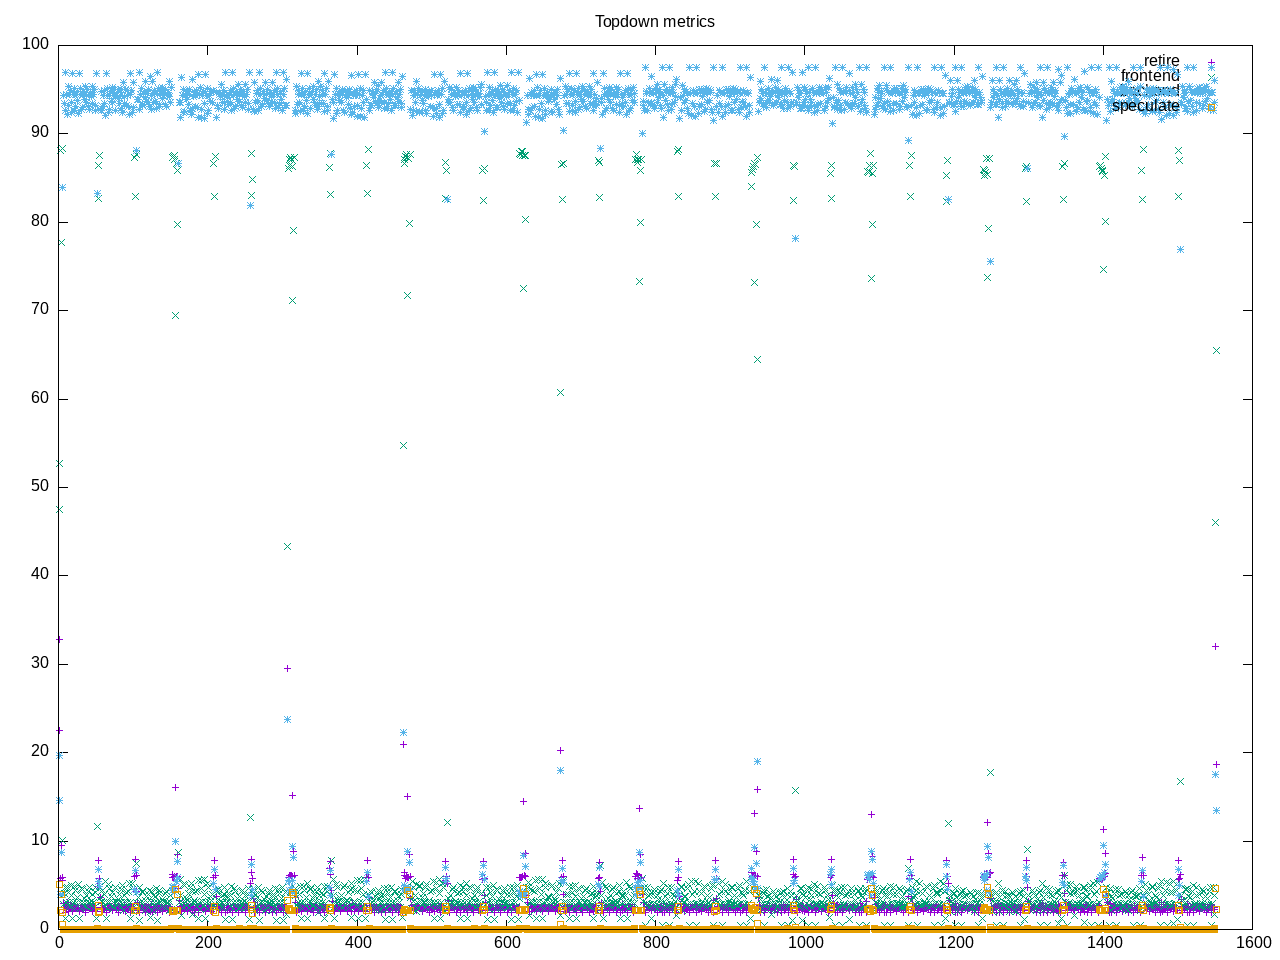
AMD metrics confirm this as memory bound with high rate of L2 access. Despite moving floating point, there are almost no floating point intructions.
elapsed              1557.486
on_cpu               0.055          # 0.88 / 16 cores
utime                1326.810
stime                41.987
nvcsw                68351          # 92.84%
nivcsw               5271           # 7.16%
inblock              32             # 0.02/sec
onblock              13816          # 8.87/sec
cpu-clock            2742989846478  # 2742.990 seconds
task-clock           2743086882030  # 2743.087 seconds
page faults          49322001       # 17980.474/sec
context switches     105687         # 38.528/sec
cpu migrations       532            # 0.194/sec
major page faults    2              # 0.001/sec
minor page faults    49321999       # 17980.473/sec
alignment faults     0              # 0.000/sec
emulation faults     0              # 0.000/sec
branches             147713856443   # 93.840 branches per 1000 inst
branch misses        7525003207     # 5.09% branch miss
conditional          114162095786   # 72.525 conditional branches per 1000 inst
indirect             98555933       # 0.063 indirect branches per 1000 inst
cpu-cycles           12641110483498 # 0.51 GHz
instructions         1554483337148  # 0.12 IPC low
slots                25288565605854 #
retiring             618318956718   #  2.4% ( 2.4%) low
-- ucode             775636722      #     0.0%
-- fastpath          617543319996   #     2.4%
frontend             841830393022   #  3.3% ( 3.3%) low
-- latency           497749780566   #     2.0%
-- bandwidth         344080612456   #     1.4%
backend              23818249605363 # 94.2% (94.2%) high
-- cpu               597500871971   #     2.4%
-- memory            23220748733392 #    91.8%
speculation          10018864501    #  0.0% ( 0.0%) low
-- branch mispredict 9753004805     #     0.0%
-- pipeline restart  265859696      #     0.0%
smt-contention       146921617      #  0.0% ( 0.0%)
cpu-cycles           12618813414012 # 0.51 GHz
instructions         1556603033250  # 0.12 IPC low
instructions         517961772956   # 980.903 l2 access per 1000 inst
l2 hit from l1       288657905828   # 40.52% l2 miss
l2 miss from l1      8939564541     #
l2 hit from l2 pf    22494472717    #
l3 hit from l2 pf    210256769      #
l3 miss from l2 pf   196707682284   #
instructions         517796842548   # 0.447 float per 1000 inst
float 512            100            # 0.000 AVX-512 per 1000 inst
float 256            650            # 0.000 AVX-256 per 1000 inst
float 128            231462915      # 0.447 AVX-128 per 1000 inst
float MMX            0              # 0.000 MMX per 1000 inst
float scalar         0              # 0.000 scalar per 1000 inst
instructions         1554155337938  #
opcache              127266670070   # 81.888 opcache per 1000 inst
opcache miss         53635397087    # 42.1% opcache miss rate
l1 dTLB miss         13222015095    # 8.508 L1 dTLB per 1000 inst
l2 dTLB miss         12953589496    # 8.335 L2 dTLB per 1000 inst
instructions         1554100729697  #
icache               121460160159   # 78.155 icache per 1000 inst
icache miss          3758654716     #  3.1% icache miss rate
l1 iTLB miss         9921047        # 0.006 L1 iTLB per 1000 inst
l2 iTLB miss         0              # 0.000 L2 iTLB per 1000 inst
tlb flush            26472          # 0.000 TLB flush per 1000 inst
Intel metrics confirm memory stalls with 38% dram and 16% L3
elapsed              2181.952
on_cpu               0.057          # 0.92 / 16 cores
utime                1973.303
stime                28.338
nvcsw                19700          # 74.29%
nivcsw               6818           # 25.71%
inblock              1776           # 0.81/sec
onblock              2424           # 1.11/sec
cpu-clock            4002738390187  # 4002.738 seconds
task-clock           4002789217081  # 4002.789 seconds
page faults          49256733       # 12305.603/sec
context switches     61697          # 15.414/sec
cpu migrations       3389           # 0.847/sec
major page faults    15             # 0.004/sec
minor page faults    49256718       # 12305.599/sec
alignment faults     0              # 0.000/sec
emulation faults     0              # 0.000/sec
branches             133960761624   # 40.246 branches per 1000 inst
branch misses        53656019       # 0.04% branch miss
conditional          133960773688   # 40.246 conditional branches per 1000 inst
indirect             115513238      # 0.035 indirect branches per 1000 inst
slots                79291431925904 #
retiring             3147625843228  #  4.0% ( 4.0%) low
-- ucode             63566823852    #     0.1%
-- fastpath          3084059019376  #     3.9%
frontend             425391016890   #  0.5% ( 0.5%) low
-- latency           241218002295   #     0.3%
-- bandwidth         184173014595   #     0.2%
backend              75525111531388 # 95.3% (95.3%) high
-- cpu               6323241151248  #     8.0%
-- memory            69201870380140 #    87.3%
speculation          38772786029    #  0.0% ( 0.0%) low
-- branch mispredict 6942804511     #     0.0%
-- pipeline restart  31829981518    #     0.0%
smt-contention       0              #  0.0% ( 0.0%)
cpu-cycles           13254648321108 # 0.37 GHz
instructions         3310529227804  # 0.25 IPC low
l2 access            1554923758519  # 469.826 l2 access per 1000 inst
l2 miss              1118397500954  # 71.93% l2 miss
cpu-cycles           13269097487447 # 85.4% memory latency
load stalls          9214888159006  #  1.6% l1 bound
l1 miss              9003832128730  # 13.4% l2 bound
l2 miss              7221520942138  # 16.1% l3 bound
l3 miss              5088357775927  # 38.3% dram bound
store_stalls         2114460128716  # 15.9% store bound
Process overview shows ramsp as the execution process
441 processes
	 60 ramsmp                2668.41    76.81
	 68 clinfo                  17.54     5.60
	 38 vulkaninfo               1.14     1.15
	  6 php                      0.16     0.65
	  4 vulkani:disk$0           0.12     0.13
	  2 llvmpipe-0               0.06     0.07
	  2 llvmpipe-1               0.06     0.07
	  2 llvmpipe-10              0.06     0.07
	  2 llvmpipe-11              0.06     0.07
	  2 llvmpipe-12              0.06     0.07
	  2 llvmpipe-13              0.06     0.07
	  2 llvmpipe-14              0.06     0.07
	  2 llvmpipe-15              0.06     0.07
	  2 llvmpipe-2               0.06     0.07
	  2 llvmpipe-3               0.06     0.07
	  2 llvmpipe-4               0.06     0.07
	  2 llvmpipe-5               0.06     0.07
	  2 llvmpipe-6               0.06     0.07
	  2 llvmpipe-7               0.06     0.07
	  2 llvmpipe-8               0.06     0.07
	  2 llvmpipe-9               0.06     0.07
	  6 clang                    0.06     0.06
	  3 rocminfo                 0.03     0.00
	  1 lspci                    0.00     0.02
	102 sh                       0.00     0.00
	 30 ramspeed                 0.00     0.00
	 13 gcc                      0.00     0.00
	 11 gsettings                0.00     0.00
	  8 stat                     0.00     0.00
	  8 systemd-detect-          0.00     0.00
	  6 llvm-link                0.00     0.00
	  5 glxinfo                  0.00     0.00
	  5 phoronix-test-s          0.00     0.00
	  3 gmain                    0.00     0.00
	  2 cc                       0.00     0.00
	  2 dconf worker             0.00     0.00
	  2 grep                     0.00     0.00
	  2 lscpu                    0.00     0.00
	  2 setterm                  0.00     0.00
	  2 uname                    0.00     0.00
	  2 which                    0.00     0.00
	  1 date                     0.00     0.00
	  1 dirname                  0.00     0.00
	  1 dmesg                    0.00     0.00
	  1 dmidecode                0.00     0.00
	  1 ifconfig                 0.00     0.00
	  1 ip                       0.00     0.00
	  1 lsmod                    0.00     0.00
	  1 mktemp                   0.00     0.00
	  1 ps                       0.00     0.00
	  1 qdbus                    0.00     0.00
	  1 readlink                 0.00     0.00
	  1 realpath                 0.00     0.00
	  1 sed                      0.00     0.00
	  1 sort                     0.00     0.00
	  1 stty                     0.00     0.00
	  1 systemctl                0.00     0.00
	  1 template.sh              0.00     0.00
	  1 wc                       0.00     0.00
0 processes running
Computation blocks show two ramssmp processes
      239720) sh               cpu=11 start=5.59  finish=5.60
        239721) stty             cpu=6 start=5.59  finish=5.60
      239722) ramspeed         cpu=0 start=5.60  finish=51.38
        239723) ramsmp           cpu=3 start=5.60  finish=51.38
          239724) ramsmp           cpu=12 start=5.60  finish=51.38
      239727) ramspeed         cpu=11 start=55.38 finish=101.25
        239728) ramsmp           cpu=4 start=55.38 finish=101.25
          239729) ramsmp           cpu=14 start=55.39 finish=101.25
      239730) ramspeed         cpu=11 start=105.26 finish=151.06
        239731) ramsmp           cpu=4 start=105.26 finish=151.06
          239732) ramsmp           cpu=6 start=105.26 finish=151.06
      239733) sh               cpu=7 start=151.06 finish=151.06