
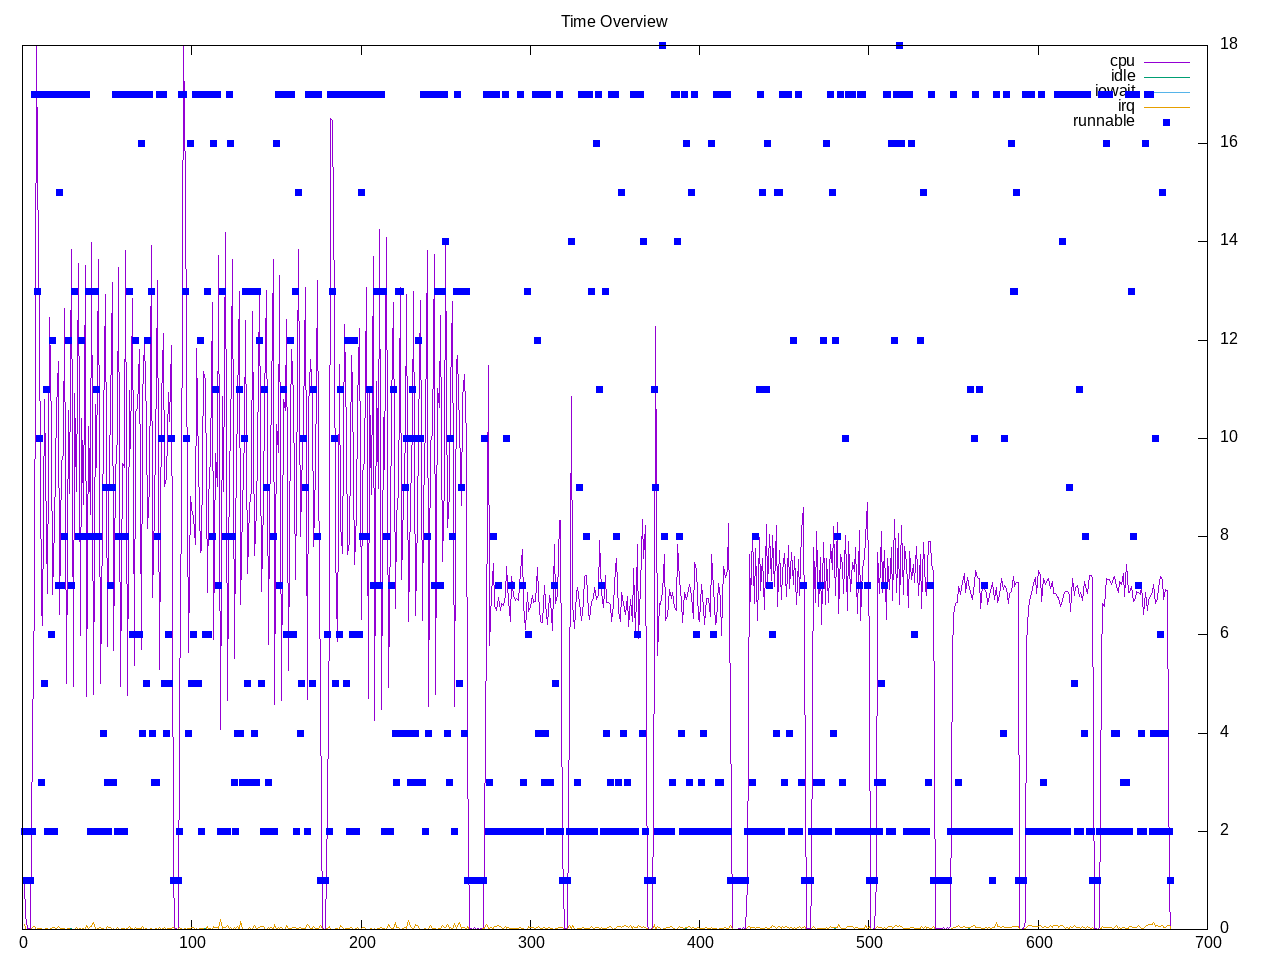
Rust written AV1 video encoder test. There are four workloads at various speed settings. These also seem to vary on how much on-cpu time is spent.
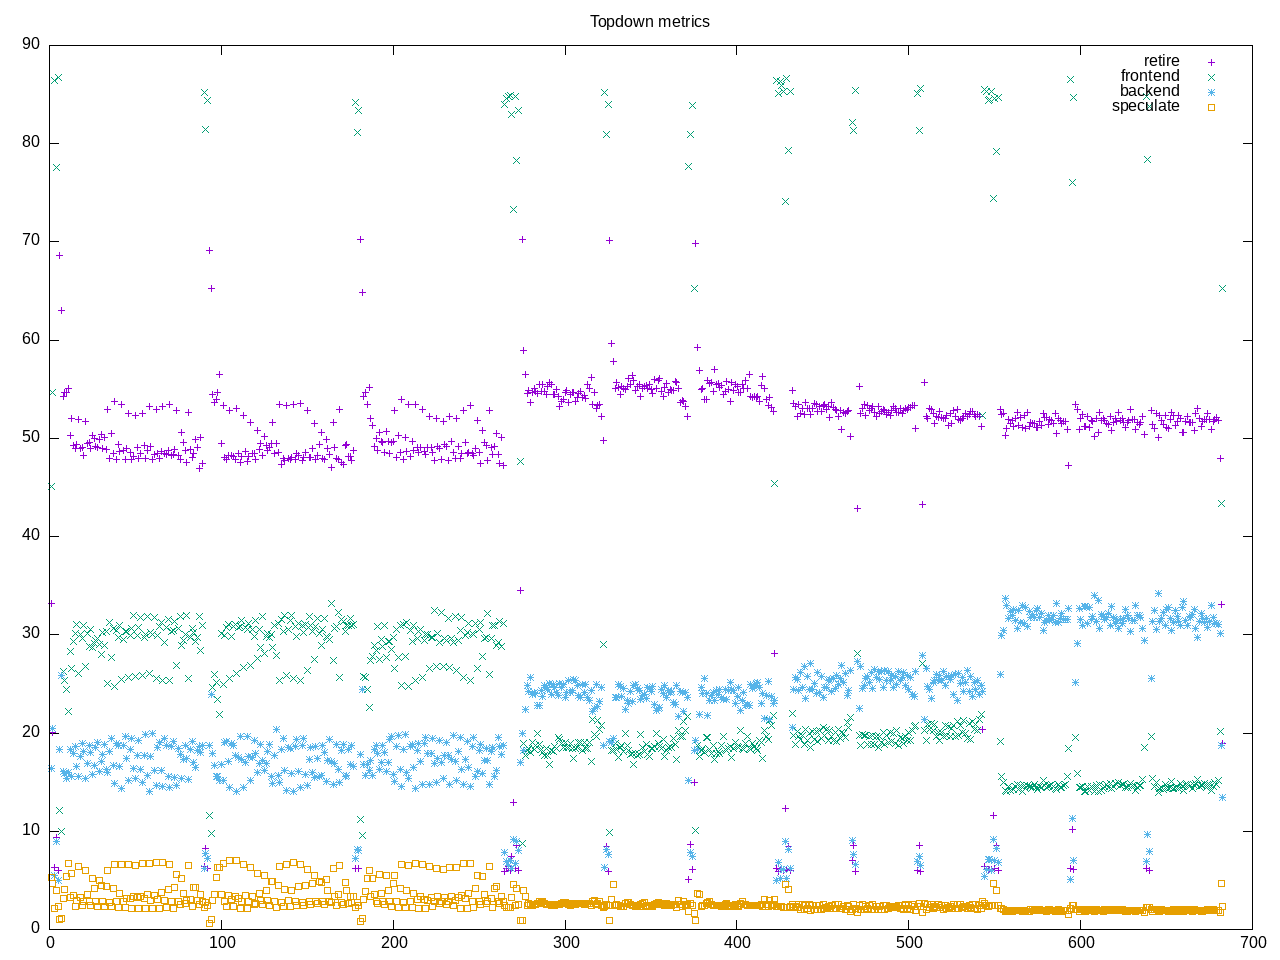
Topdown profile shows a consistent retirement rate with backend stalls higher in the last and frontend stalls higher in the first.
AMD metrics show on average six cores. The is some floating point and not much L2 activity.
elapsed              680.283
on_cpu               0.405          # 6.48 / 16 cores
utime                4380.077
stime                29.750
nvcsw                529699         # 94.26%
nivcsw               32249          # 5.74%
inblock              0              # 0.00/sec
onblock              15808          # 23.24/sec
cpu-clock            4406070896173  # 4406.071 seconds
task-clock           4406708412361  # 4406.708 seconds
page faults          6123612        # 1389.611/sec
context switches     565143         # 128.246/sec
cpu migrations       7223           # 1.639/sec
major page faults    2              # 0.000/sec
minor page faults    6123610        # 1389.611/sec
alignment faults     0              # 0.000/sec
emulation faults     0              # 0.000/sec
branches             4662711827592  # 111.593 branches per 1000 inst
branch misses        52847581667    # 1.13% branch miss
conditional          3741973573338  # 89.557 conditional branches per 1000 inst
indirect             184899584708   # 4.425 indirect branches per 1000 inst
cpu-cycles           17439787503556 # 1.60 GHz
instructions         41786711974119 # 2.40 IPC
slots                34865080874874 #
retiring             13743579233199 # 39.4% (51.7%)
-- ucode             30766579480    #     0.1%
-- fastpath          13712812653719 #    39.3%
frontend             6301204183817  # 18.1% (23.7%)
-- latency           3991486122378  #    11.4%
-- bandwidth         2309718061439  #     6.6%
backend              5757168999901  # 16.5% (21.6%)
-- cpu               1810773177827  #     5.2%
-- memory            3946395822074  #    11.3%
speculation          804632596029   #  2.3% ( 3.0%)
-- branch mispredict 783402978854   #     2.2%
-- pipeline restart  21229617175    #     0.1%
smt-contention       8258433048876  # 23.7% ( 0.0%)
cpu-cycles           17436364491114 # 1.60 GHz
instructions         41772250512279 # 2.40 IPC
instructions         13931405364622 # 30.075 l2 access per 1000 inst
l2 hit from l1       399942908773   # 2.77% l2 miss
l2 miss from l1      4259235520     #
l2 hit from l2 pf    11699912704    #
l3 hit from l2 pf    4059614458     #
l3 miss from l2 pf   3278519298     #
instructions         13924366621450 # 107.589 float per 1000 inst
float 512            70             # 0.000 AVX-512 per 1000 inst
float 256            534            # 0.000 AVX-256 per 1000 inst
float 128            1498110268831  # 107.589 AVX-128 per 1000 inst
float MMX            0              # 0.000 MMX per 1000 inst
float scalar         0              # 0.000 scalar per 1000 inst
Intel metrics
elapsed              856.175
on_cpu               0.403          # 6.45 / 16 cores
utime                5497.713
stime                22.929
nvcsw                539159         # 89.84%
nivcsw               60943          # 10.16%
inblock              664            # 0.78/sec
onblock              4800           # 5.61/sec
cpu-clock            5513430812677  # 5513.431 seconds
task-clock           5514030198429  # 5514.030 seconds
page faults          6400742        # 1160.810/sec
context switches     604186         # 109.572/sec
cpu migrations       45126          # 8.184/sec
major page faults    5              # 0.001/sec
minor page faults    6400733        # 1160.808/sec
alignment faults     0              # 0.000/sec
emulation faults     0              # 0.000/sec
branches             4723772752112  # 108.408 branches per 1000 inst
branch misses        55866941113    # 1.18% branch miss
conditional          4723772771216  # 108.408 conditional branches per 1000 inst
indirect             979987448967   # 22.490 indirect branches per 1000 inst
slots                42426994010144 #
retiring             25181587491963 # 59.4% (59.4%)
-- ucode             1276993347564  #     3.0%
-- fastpath          23904594144399 #    56.3%
frontend             9465887818390  # 22.3% (22.3%)
-- latency           3321055045324  #     7.8%
-- bandwidth         6144832773066  #    14.5%
backend              4043327042134  #  9.5% ( 9.5%)
-- cpu               2743315610137  #     6.5%
-- memory            1300011431997  #     3.1%
speculation          3778862180966  #  8.9% ( 8.9%)
-- branch mispredict 3656643627421  #     8.6%
-- pipeline restart  122218553545   #     0.3%
smt-contention       0              #  0.0% ( 0.0%)
cpu-cycles           19850940272366 # 1.44 GHz
instructions         52275803783004 # 2.63 IPC
l2 access            629155938709   # 24.142 l2 access per 1000 inst
l2 miss              42062422802    # 6.69% l2 miss
Process overview shows time spent in rav1e processes.
573 processes
	212 rav1e                73556.31   386.72
	 68 clinfo                  15.47     6.98
	 38 vulkaninfo               1.12     1.14
	  6 glxinfo:gdrv0            0.17     0.04
	  4 vulkani:disk$0           0.11     0.12
	  6 php                      0.10     0.14
	  2 glxinfo                  0.08     0.02
	  2 glxinfo:cs0              0.08     0.02
	  2 glxinfo:disk$0           0.08     0.02
	  2 glxinfo:sh0              0.08     0.02
	  2 glxinfo:shlo0            0.08     0.02
	  2 llvmpipe-0               0.06     0.06
	  2 llvmpipe-1               0.06     0.06
	  2 llvmpipe-10              0.06     0.06
	  2 llvmpipe-11              0.06     0.06
	  2 llvmpipe-12              0.06     0.06
	  2 llvmpipe-13              0.06     0.06
	  2 llvmpipe-14              0.06     0.06
	  2 llvmpipe-15              0.06     0.06
	  2 llvmpipe-2               0.06     0.06
	  2 llvmpipe-3               0.06     0.06
	  2 llvmpipe-4               0.06     0.06
	  2 llvmpipe-5               0.06     0.06
	  2 llvmpipe-6               0.06     0.06
	  2 llvmpipe-7               0.06     0.06
	  2 llvmpipe-8               0.06     0.06
	  2 llvmpipe-9               0.06     0.06
	  6 clang                    0.03     0.09
	  3 rocminfo                 0.03     0.00
	  1 lspci                    0.00     0.02
	 87 sh                       0.00     0.00
	 12 gcc                      0.00     0.00
	 12 tr                       0.00     0.00
	 10 gsettings                0.00     0.00
	  8 stat                     0.00     0.00
	  8 systemd-detect-          0.00     0.00
	  6 llvm-link                0.00     0.00
	  5 phoronix-test-s          0.00     0.00
	  4 gmain                    0.00     0.00
	  2 dconf worker             0.00     0.00
	  2 lscpu                    0.00     0.00
	  2 uname                    0.00     0.00
	  2 which                    0.00     0.00
	  2 xset                     0.00     0.00
	  1 cc                       0.00     0.00
	  1 date                     0.00     0.00
	  1 dirname                  0.00     0.00
	  1 dmesg                    0.00     0.00
	  1 dmidecode                0.00     0.00
	  1 grep                     0.00     0.00
	  1 ifconfig                 0.00     0.00
	  1 ip                       0.00     0.00
	  1 lsmod                    0.00     0.00
	  1 mktemp                   0.00     0.00
	  1 ps                       0.00     0.00
	  1 qdbus                    0.00     0.00
	  1 readlink                 0.00     0.00
	  1 realpath                 0.00     0.00
	  1 sed                      0.00     0.00
	  1 sort                     0.00     0.00
	  1 stty                     0.00     0.00
	  1 systemctl                0.00     0.00
	  1 template.sh              0.00     0.00
	  1 wc                       0.00     0.00
	  1 xrandr                   0.00     0.00
4 processes running
51 maximum processes
These seem to be started on all CPUs
      157481) rav1e            cpu=11 start=92.26 finish=175.52
        157482) rav1e            cpu=7 start=92.26 finish=175.46
          157483) rav1e            cpu=15 start=92.27 finish=175.46
          157484) rav1e            cpu=12 start=92.27 finish=175.46
          157485) rav1e            cpu=5 start=92.27 finish=175.47
          157486) rav1e            cpu=13 start=92.27 finish=175.47
          157487) rav1e            cpu=0 start=92.27 finish=175.47
          157488) rav1e            cpu=14 start=92.27 finish=175.47
          157489) rav1e            cpu=11 start=92.27 finish=175.47
          157490) rav1e            cpu=2 start=92.27 finish=175.47
          157491) rav1e            cpu=9 start=92.27 finish=175.46
          157492) rav1e            cpu=10 start=92.27 finish=175.47
          157493) rav1e            cpu=12 start=92.27 finish=175.47
          157494) rav1e            cpu=4 start=92.27 finish=175.47
          157495) rav1e            cpu=6 start=92.27 finish=175.47
          157496) rav1e            cpu=3 start=92.27 finish=175.46
          157497) rav1e            cpu=3 start=92.27 finish=175.47
          157498) rav1e            cpu=8 start=92.27 finish=175.47
        157500) tr               cpu=4 start=175.52 finish=175.52