
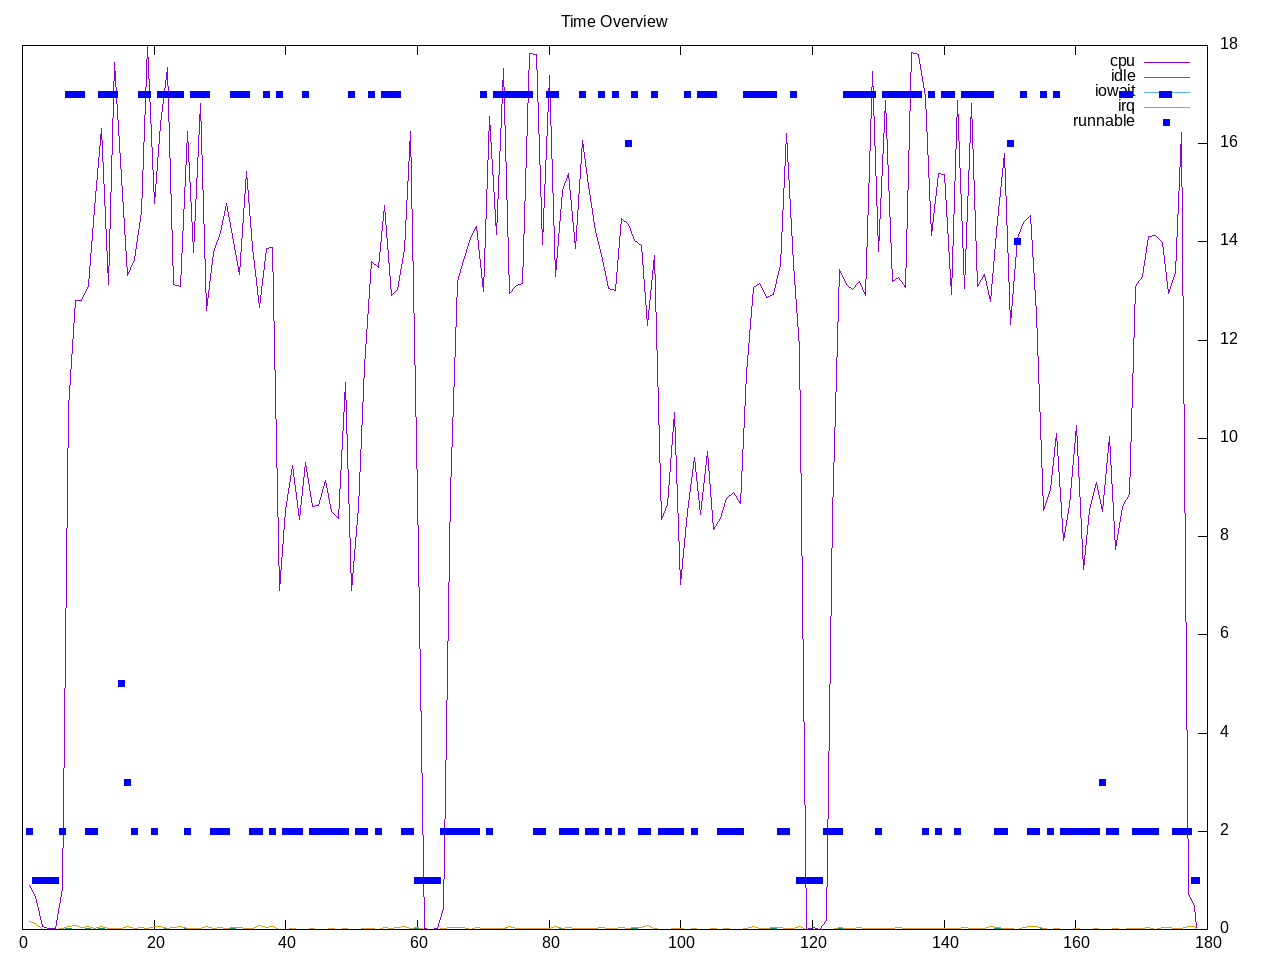
An image processing program for RAW files. There is one workload resulting in a total processing time. The profile shows a parallel workload with phases where fewer cores are used.
Topdown profile has metrics somewhat scattered throughout the execution.
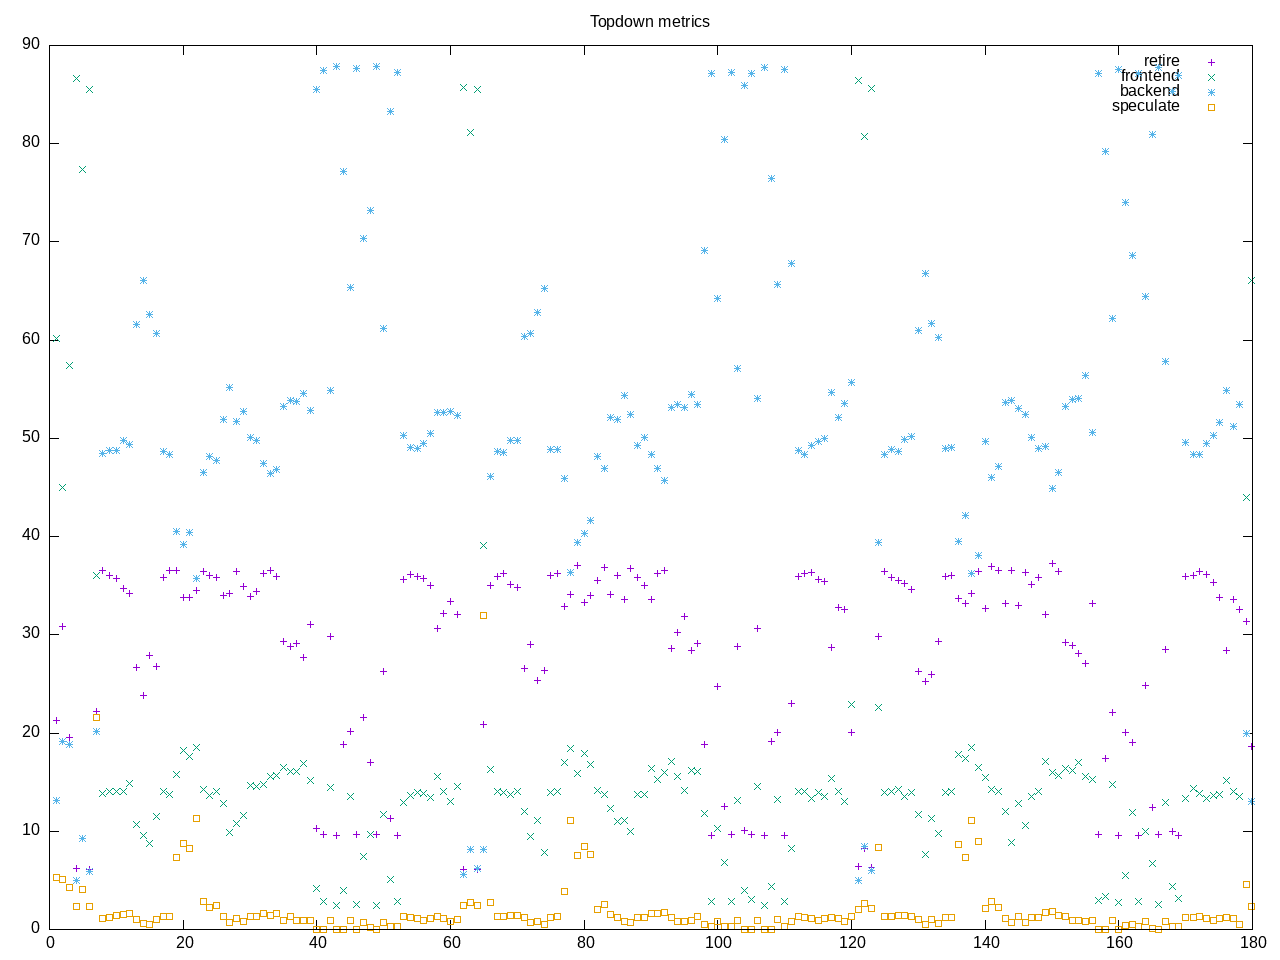
AMD metrics pull together the jumble from above to indicate a medium-low retirement rate with backend stalls being the largest issue. The backend stalls are balanced between CPU and memory. This is a floating point code with not as many branches. The L2 access rate is also fairly low.
elapsed              179.887
on_cpu               0.512          # 8.20 / 16 cores
utime                1287.209
stime                187.568
nvcsw                102097         # 80.35%
nivcsw               24973          # 19.65%
inblock              0              # 0.00/sec
onblock              78336          # 435.47/sec
cpu-clock            1475350779508  # 1475.351 seconds
task-clock           1475480500578  # 1475.481 seconds
page faults          65599226       # 44459.568/sec
context switches     125342         # 84.950/sec
cpu migrations       10194          # 6.909/sec
major page faults    3958           # 2.683/sec
minor page faults    65595268       # 44456.886/sec
alignment faults     0              # 0.000/sec
emulation faults     0              # 0.000/sec
branches             924461608255   # 120.345 branches per 1000 inst
branch misses        16691502731    # 1.81% branch miss
conditional          663067209853   # 86.317 conditional branches per 1000 inst
indirect             46540186604    # 6.059 indirect branches per 1000 inst
cpu-cycles           6019157336166  # 2.09 GHz
instructions         7611310091960  # 1.26 IPC
slots                12254200328232 #
retiring             2679466866315  # 21.9% (29.9%)
-- ucode             11858635207    #     0.1%
-- fastpath          2667608231108  #    21.8%
frontend             1132197658551  #  9.2% (12.6%)
-- latency           699150851094   #     5.7%
-- bandwidth         433046807457   #     3.5%
backend              4996777714725  # 40.8% (55.7%)
-- cpu               2530516948651  #    20.7%
-- memory            2466260766074  #    20.1%
speculation          159411027400   #  1.3% ( 1.8%)
-- branch mispredict 156974288805   #     1.3%
-- pipeline restart  2436738595     #     0.0%
smt-contention       3286330679686  # 26.8% ( 0.0%)
cpu-cycles           6017367535283  # 2.09 GHz
instructions         7600363732607  # 1.26 IPC
instructions         2551891094994  # 17.136 l2 access per 1000 inst
l2 hit from l1       28354278284    # 23.61% l2 miss
l2 miss from l1      2637176678     #
l2 hit from l2 pf    7684883289     #
l3 hit from l2 pf    2573993509     #
l3 miss from l2 pf   5115054138     #
instructions         2559759186206  # 338.719 float per 1000 inst
float 512            413            # 0.000 AVX-512 per 1000 inst
float 256            1316           # 0.000 AVX-256 per 1000 inst
float 128            867040280823   # 338.719 AVX-128 per 1000 inst
float MMX            0              # 0.000 MMX per 1000 inst
float scalar         0              # 0.000 scalar per 1000 inst
Intel metrics
elapsed              209.305
on_cpu               0.566          # 9.05 / 16 cores
utime                1739.418
stime                154.595
nvcsw                89411          # 35.26%
nivcsw               164131         # 64.74%
inblock              55920          # 267.17/sec
onblock              66968          # 319.95/sec
cpu-clock            1894454435242  # 1894.454 seconds
task-clock           1894582680824  # 1894.583 seconds
page faults          63161343       # 33337.866/sec
context switches     251947         # 132.983/sec
cpu migrations       23375          # 12.338/sec
major page faults    4178           # 2.205/sec
minor page faults    63157165       # 33335.660/sec
alignment faults     0              # 0.000/sec
emulation faults     0              # 0.000/sec
branches             895136532769   # 117.481 branches per 1000 inst
branch misses        7425350001     # 0.83% branch miss
conditional          895137086081   # 117.481 conditional branches per 1000 inst
indirect             239235008391   # 31.398 indirect branches per 1000 inst
slots                10896610205486 #
retiring             4290917573683  # 39.4% (39.4%)
-- ucode             307384348347   #     2.8%
-- fastpath          3983533225336  #    36.6%
frontend             1444453419495  # 13.3% (13.3%)
-- latency           1025878630534  #     9.4%
-- bandwidth         418574788961   #     3.8%
backend              4626094399272  # 42.5% (42.5%)
-- cpu               3366364526917  #    30.9%
-- memory            1259729872355  #    11.6%
speculation          615212559566   #  5.6% ( 5.6%)
-- branch mispredict 584215762555   #     5.4%
-- pipeline restart  30996797011    #     0.3%
smt-contention       0              #  0.0% ( 0.0%)
cpu-cycles           4545561423398  # 1.37 GHz
instructions         5818829336429  # 1.28 IPC
l2 access            55992677153    # 13.197 l2 access per 1000 inst
l2 miss              22828183572    # 40.77% l2 miss
Process summary includes a large number of rawtherapee processes
17271 processes
	14658 rawtherapee-cli      55652.09 14395.32
	 68 clinfo                  17.86     5.00
	  3 xz                       1.55     0.04
	 38 vulkaninfo               1.33     0.96
	  6 glxinfo:gdrv0            0.15     0.04
	  6 glxinfo:gl0              0.15     0.04
	  4 vulkani:disk$0           0.14     0.11
	  6 php                      0.08     0.06
	  6 clang                    0.07     0.05
	  2 llvmpipe-0               0.07     0.05
	  2 llvmpipe-1               0.07     0.05
	  2 llvmpipe-10              0.07     0.05
	  2 llvmpipe-11              0.07     0.05
	  2 llvmpipe-12              0.07     0.05
	  2 llvmpipe-13              0.07     0.05
	  2 llvmpipe-14              0.07     0.05
	  2 llvmpipe-15              0.07     0.05
	  2 llvmpipe-2               0.07     0.05
	  2 llvmpipe-3               0.07     0.05
	  2 llvmpipe-4               0.07     0.05
	  2 llvmpipe-5               0.07     0.05
	  2 llvmpipe-6               0.07     0.05
	  2 llvmpipe-7               0.07     0.05
	  2 llvmpipe-8               0.07     0.05
	  2 llvmpipe-9               0.07     0.05
	  2 glxinfo                  0.07     0.02
	  2 glxinfo:cs0              0.07     0.02
	  2 glxinfo:disk$0           0.07     0.02
	  2 glxinfo:sh0              0.07     0.02
	  2 glxinfo:shlo0            0.07     0.02
	1482 bash                     0.04     0.31
	  3 rocminfo                 0.03     0.00
	  1 lspci                    0.01     0.01
	  3 tar                      0.00     0.09
	  1 ps                       0.00     0.01
	295 sed                      0.00     0.00
	255 bc                       0.00     0.00
	211 grep                     0.00     0.00
	 81 sh                       0.00     0.00
	 12 gcc                      0.00     0.00
	  8 gsettings                0.00     0.00
	  8 stat                     0.00     0.00
	  8 systemd-detect-          0.00     0.00
	  6 llvm-link                0.00     0.00
	  5 gmain                    0.00     0.00
	  5 phoronix-test-s          0.00     0.00
	  5 uname                    0.00     0.00
	  5 which                    0.00     0.00
	  4 dirname                  0.00     0.00
	  4 sort                     0.00     0.00
	  3 basename                 0.00     0.00
	  3 dconf worker             0.00     0.00
	  3 rawtherapee              0.00     0.00
	  3 rm                       0.00     0.00
	  2 lscpu                    0.00     0.00
	  2 xset                     0.00     0.00
	  1 cc                       0.00     0.00
	  1 date                     0.00     0.00
	  1 dmesg                    0.00     0.00
	  1 dmidecode                0.00     0.00
	  1 ifconfig                 0.00     0.00
	  1 ip                       0.00     0.00
	  1 lsmod                    0.00     0.00
	  1 mktemp                   0.00     0.00
	  1 qdbus                    0.00     0.00
	  1 readlink                 0.00     0.00
	  1 realpath                 0.00     0.00
	  1 stty                     0.00     0.00
	  1 systemctl                0.00     0.00
	  1 template.sh              0.00     0.00
	  1 wc                       0.00     0.00
	  1 xrandr                   0.00     0.00
0 processes running
47 maximum processes