
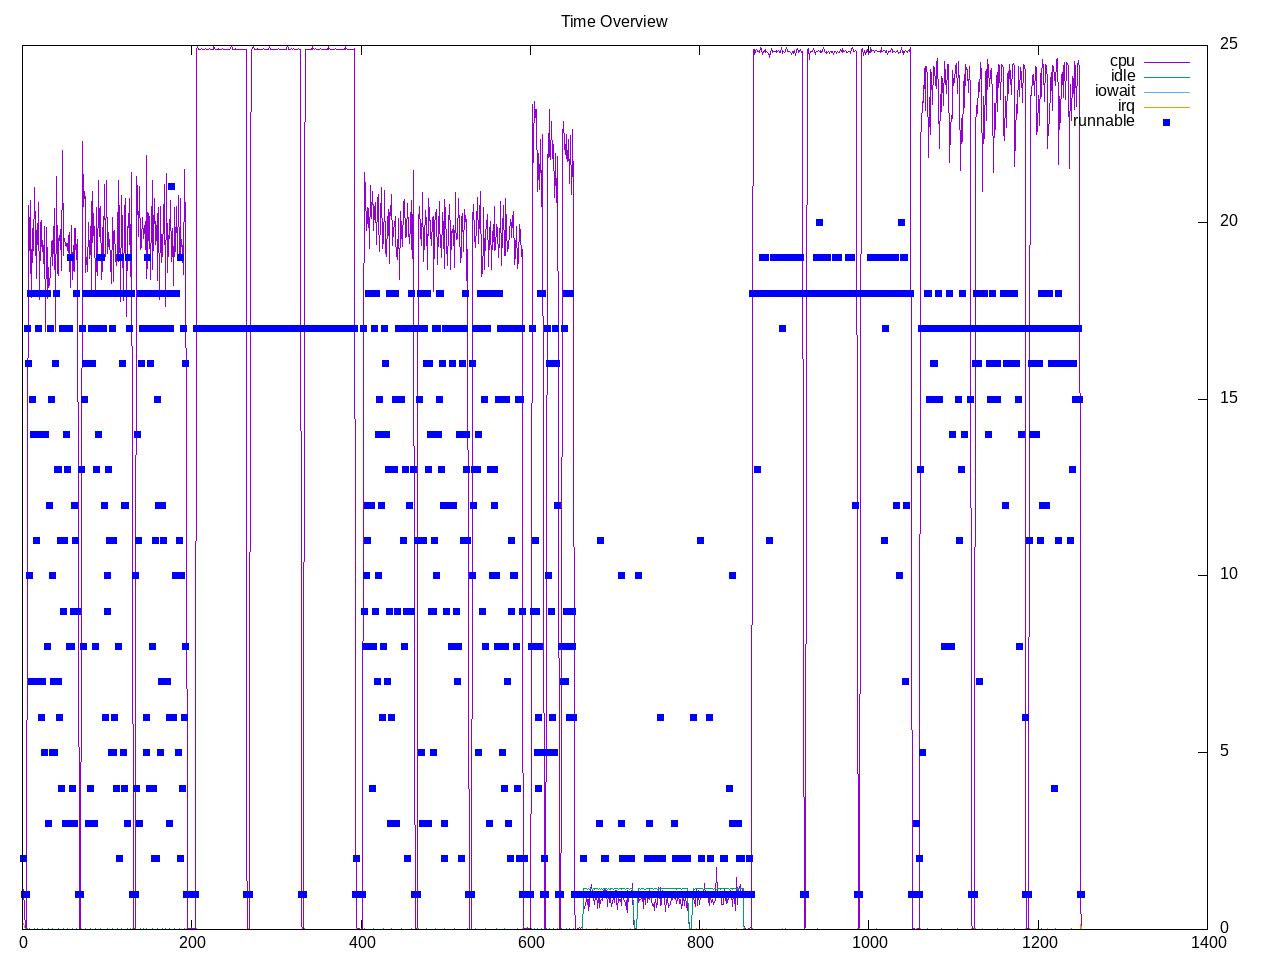
An embeddable persistent key-value store for fast storage. Seven different operations are measured. Most of these workloads are parallel with as many runnable processes as cores. The amount the cores are busy varies from low for the 5th workload (random fill sync) to high for the sixth (read while writing)
AMD metrics how little floating point. Otherwise most metrics in the average ranges.
elapsed              1256.218
on_cpu               0.679          # 10.86 / 16 cores
utime                10219.396
stime                3420.266
nvcsw                119769591      # 94.73%
nivcsw               6663729        # 5.27%
inblock              1232           # 0.98/sec
onblock              121962920      # 97087.39/sec
cpu-clock            13574139138031 # 13574.139 seconds
task-clock           13612664355199 # 13612.664 seconds
page faults          6824183        # 501.311/sec
context switches     126439332      # 9288.360/sec
cpu migrations       8718536        # 640.472/sec
major page faults    6              # 0.000/sec
minor page faults    6824177        # 501.311/sec
alignment faults     0              # 0.000/sec
emulation faults     0              # 0.000/sec
branches             10271174340310 # 188.623 branches per 1000 inst
branch misses        277449179077   # 2.70% branch miss
conditional          5648504136349  # 103.731 conditional branches per 1000 inst
indirect             1124377851737  # 20.648 indirect branches per 1000 inst
cpu-cycles           53751704256411 # 2.68 GHz
instructions         55119098215444 # 1.03 IPC
slots                106841913111060 #
retiring             19849503350670 # 18.6% (22.5%)
-- ucode             127793340403   #     0.1%
-- fastpath          19721710010267 #    18.5%
frontend             36712996676391 # 34.4% (41.6%)
-- latency           28253840782476 #    26.4%
-- bandwidth         8459155893915  #     7.9%
backend              30901818231943 # 28.9% (35.0%)
-- cpu               3612883079005  #     3.4%
-- memory            27288935152938 #    25.5%
speculation          771073948149   #  0.7% ( 0.9%) low
-- branch mispredict 762799127135   #     0.7%
-- pipeline restart  8274821014     #     0.0%
smt-contention       18593652403377 # 17.4% ( 0.0%)
cpu-cycles           60594058043732 # 2.67 GHz
instructions         59197242000526 # 0.98 IPC
instructions         19647912053547 # 42.592 l2 access per 1000 inst
l2 hit from l1       767630063538   # 12.41% l2 miss
l2 miss from l1      62743931847    #
l2 hit from l2 pf    28135323858    #
l3 hit from l2 pf    26813207921    #
l3 miss from l2 pf   14259442809    #
instructions         19631998808723 # 22.432 float per 1000 inst
float 512            108            # 0.000 AVX-512 per 1000 inst
float 256            1048           # 0.000 AVX-256 per 1000 inst
float 128            440377952417   # 22.432 AVX-128 per 1000 inst
float MMX            0              # 0.000 MMX per 1000 inst
float scalar         0              # 0.000 scalar per 1000 inst
Intel metrics
elapsed              2036.936
on_cpu               0.813          # 13.01 / 16 cores
utime                22363.617
stime                4133.225
nvcsw                30038469       # 66.05%
nivcsw               15441406       # 33.95%
inblock              32272          # 15.84/sec
onblock              168286872      # 82617.67/sec
cpu-clock            26482794374350 # 26482.794 seconds
task-clock           26490021625577 # 26490.022 seconds
page faults          6277667        # 236.982/sec
context switches     45489763       # 1717.241/sec
cpu migrations       446163         # 16.843/sec
major page faults    145            # 0.005/sec
minor page faults    6277522        # 236.977/sec
alignment faults     0              # 0.000/sec
emulation faults     0              # 0.000/sec
branches             15845073239406 # 182.768 branches per 1000 inst
branch misses        80660799235    # 0.51% branch miss
conditional          15845073296654 # 182.768 conditional branches per 1000 inst
indirect             5550933536562  # 64.028 indirect branches per 1000 inst
slots                153818137907582 #
retiring             55497284490468 # 36.1% (36.1%)
-- ucode             6412404460591  #     4.2%
-- fastpath          49084880029877 #    31.9%
frontend             41077025945675 # 26.7% (26.7%)
-- latency           18447973920816 #    12.0%
-- bandwidth         22629052024859 #    14.7%
backend              50702116635446 # 33.0% (33.0%)
-- cpu               37168072994080 #    24.2%
-- memory            13534043641366 #     8.8%
speculation          6203760391327  #  4.0% ( 4.0%)
-- branch mispredict 5657529498006  #     3.7%
-- pipeline restart  546230893321   #     0.4%
smt-contention       0              #  0.0% ( 0.0%)
cpu-cycles           80870767382994 # 2.38 GHz
instructions         85902833984593 # 1.06 IPC
l2 access            2188123304139  # 49.724 l2 access per 1000 inst
l2 miss              458577890247   # 20.96% l2 miss
cpu-cycles           23489588431046 # 26.9% memory latency
load stalls          6158169861775  #  6.7% l1 bound
l1 miss              4595344972815  #  8.1% l2 bound
l2 miss              2701798732980  #  6.3% l3 bound
l3 miss              1220720402911  #  5.2% dram bound
store_stalls         152469852843   #  0.6% store bound
Process summary has most time in the db_bench application with others balanced between rocksdb:high and rocksdb:low
1305 processes
	757 db_bench             193886.97 56926.57
	 21 rocksdb:high         10643.48  3131.87
	 21 rocksdb:low          10643.48  3131.85
	 68 clinfo                  15.87     7.32
	 38 vulkaninfo               1.12     1.14
	  6 php                      0.19     0.19
	  6 glxinfo:gdrv0            0.12     0.06
	  6 glxinfo:gl0              0.12     0.06
	  4 vulkani:disk$0           0.11     0.12
	  6 clang                    0.06     0.06
	  2 llvmpipe-0               0.06     0.06
	  2 llvmpipe-1               0.06     0.06
	  2 llvmpipe-10              0.06     0.06
	  2 llvmpipe-11              0.06     0.06
	  2 llvmpipe-12              0.06     0.06
	  2 llvmpipe-13              0.06     0.06
	  2 llvmpipe-14              0.06     0.06
	  2 llvmpipe-15              0.06     0.06
	  2 llvmpipe-2               0.06     0.06
	  2 llvmpipe-3               0.06     0.06
	  2 llvmpipe-4               0.06     0.06
	  2 llvmpipe-5               0.06     0.06
	  2 llvmpipe-6               0.06     0.06
	  2 llvmpipe-7               0.06     0.06
	  2 llvmpipe-8               0.06     0.06
	  2 llvmpipe-9               0.06     0.06
	  2 glxinfo                  0.06     0.03
	  2 glxinfo:cs0              0.06     0.03
	  2 glxinfo:disk$0           0.06     0.03
	  2 glxinfo:sh0              0.06     0.02
	  2 glxinfo:shlo0            0.06     0.02
	  3 rocminfo                 0.03     0.00
	 42 rm                       0.00     0.22
	  1 lspci                    0.00     0.02
	 94 sh                       0.00     0.00
	 21 rocksdb                  0.00     0.00
	 13 gcc                      0.00     0.00
	  9 gsettings                0.00     0.00
	  8 stat                     0.00     0.00
	  8 systemd-detect-          0.00     0.00
	  6 llvm-link                0.00     0.00
	  5 phoronix-test-s          0.00     0.00
	  4 gmain                    0.00     0.00
	  3 dconf worker             0.00     0.00
	  2 cc                       0.00     0.00
	  2 lscpu                    0.00     0.00
	  2 uname                    0.00     0.00
	  2 which                    0.00     0.00
	  2 xset                     0.00     0.00
	  1 date                     0.00     0.00
	  1 dirname                  0.00     0.00
	  1 dmesg                    0.00     0.00
	  1 dmidecode                0.00     0.00
	  1 grep                     0.00     0.00
	  1 ifconfig                 0.00     0.00
	  1 ip                       0.00     0.00
	  1 lsmod                    0.00     0.00
	  1 mktemp                   0.00     0.00
	  1 ps                       0.00     0.00
	  1 qdbus                    0.00     0.00
	  1 readlink                 0.00     0.00
	  1 realpath                 0.00     0.00
	  1 sed                      0.00     0.00
	  1 sort                     0.00     0.00
	  1 stty                     0.00     0.00
	  1 systemctl                0.00     0.00
	  1 template.sh              0.00     0.00
	  1 wc                       0.00     0.00
	  1 xrandr                   0.00     0.00
83 processes running
130 maximum processes
The ?? processers did not have names, but otherwise looks like straightforward invocations with one rocksdb:low and one rocksdb:high in each test run and otherwise db_bench processes.
      1099628) rocksdb          cpu=4 start=5.51  finish=65.66
        1099629) rm               cpu=13 start=5.52  finish=5.52
        1099630) db_bench         cpu=1 start=5.52  finish=65.63
          1099631) rocksdb:low      cpu=9 start=5.53  finish=65.63
          1099632) rocksdb:high     cpu=10 start=5.53  finish=65.63
          1099633) db_bench         cpu=7 start=5.53  finish=5.53
          1099634) db_bench         cpu=6 start=5.53  finish=5.53
          1099635) ?? cpu=0 start=5.53  finish=0.00
          1099636) db_bench         cpu=8 start=5.53  finish=5.53
          1099637) db_bench         cpu=4 start=5.53  finish=5.53
          1099638) db_bench         cpu=5 start=5.53  finish=5.53
          1099639) ?? cpu=0 start=5.53  finish=0.00
          1099640) db_bench         cpu=3 start=5.53  finish=5.53
          1099641) ?? cpu=0 start=5.53  finish=0.00
          1099642) db_bench         cpu=3 start=5.53  finish=5.53
          1099643) db_bench         cpu=1 start=5.53  finish=5.53
          1099644) db_bench         cpu=3 start=5.53  finish=5.53
          1099645) db_bench         cpu=1 start=5.53  finish=5.53
          1099646) ?? cpu=0 start=5.53  finish=0.00
          1099647) db_bench         cpu=3 start=5.53  finish=5.53
          1099648) db_bench         cpu=7 start=5.54  finish=5.54
          1099649) db_bench         cpu=6 start=5.54  finish=5.54
          1099650) db_bench         cpu=7 start=5.54  finish=5.54
          1099651) ?? cpu=0 start=5.54  finish=0.00
          1099652) db_bench         cpu=8 start=5.54  finish=5.54
          1099653) ?? cpu=0 start=5.54  finish=0.00
          1099654) db_bench         cpu=10 start=5.54  finish=5.54
          1099655) db_bench         cpu=1 start=5.54  finish=5.54
          1099656) db_bench         cpu=4 start=5.54  finish=5.54
          1099657) db_bench         cpu=1 start=5.54  finish=5.54
          1099658) ?? cpu=0 start=5.54  finish=0.00
          1099659) db_bench         cpu=5 start=5.54  finish=5.54
          1099660) db_bench         cpu=6 start=5.54  finish=5.54
          1099661) ?? cpu=0 start=5.54  finish=0.00
          1099662) db_bench         cpu=7 start=5.54  finish=5.54
          1099663) db_bench         cpu=8 start=5.54  finish=5.54
          1099664) db_bench         cpu=3 start=5.55  finish=65.56
          1099665) db_bench         cpu=6 start=5.55  finish=65.56
          1099666) db_bench         cpu=9 start=5.55  finish=65.56
          1099667) db_bench         cpu=3 start=5.55  finish=65.55
          1099668) db_bench         cpu=13 start=5.55  finish=65.55
          1099669) db_bench         cpu=8 start=5.55  finish=65.55
          1099670) db_bench         cpu=2 start=5.55  finish=65.56
          1099671) db_bench         cpu=5 start=5.55  finish=65.55
          1099672) db_bench         cpu=4 start=5.55  finish=65.56
          1099673) db_bench         cpu=5 start=5.55  finish=65.56
          1099674) db_bench         cpu=15 start=5.55  finish=65.56
          1099675) db_bench         cpu=0 start=5.55  finish=65.56
          1099676) db_bench         cpu=9 start=5.55  finish=65.55
          1099677) db_bench         cpu=1 start=5.55  finish=65.55
          1099678) db_bench         cpu=11 start=5.55  finish=65.56
          1099679) db_bench         cpu=12 start=5.55  finish=65.55
          1099680) db_bench         cpu=7 start=5.55  finish=65.56
        1099683) rm               cpu=13 start=65.63 finish=65.66