
An accelerator test including OpenMP, CUDA and OpenCL Five tests are OpenMP and two are OpenCL. The OpenCL fail so this is really five subtests.These tests take some time to settle down and at least one is single-threaded.
Topdown profile shows differences in the profiles with a few higher retirement rates and others with more backend stalls.
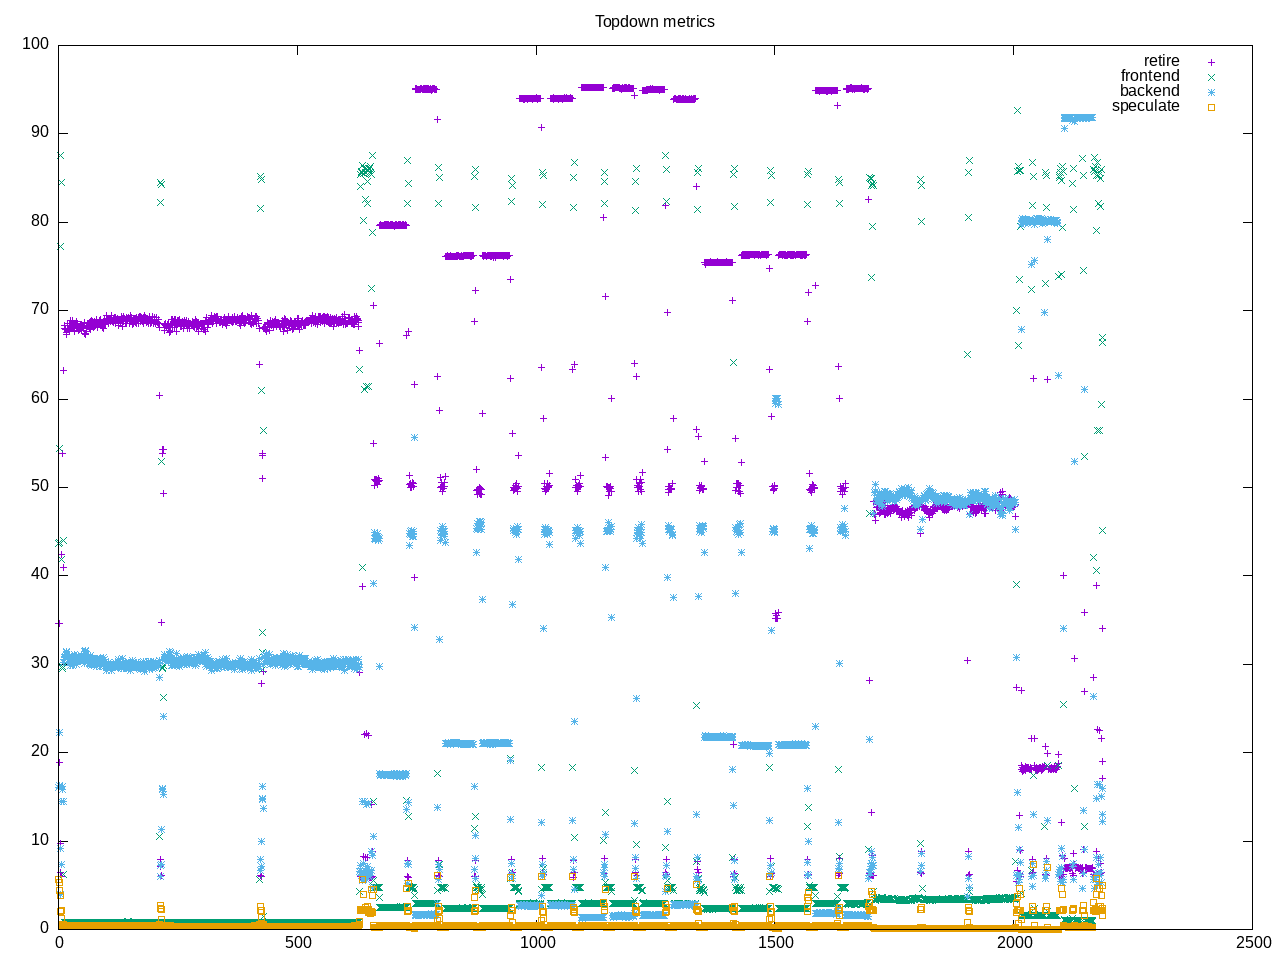
AMD metrics show floating point code, not much L2 access and the backend stalls are more CPU than memory. The number of branches is moderate.
elapsed              2493.966
on_cpu               0.540          # 8.64 / 16 cores
utime                21518.722
stime                21.889
nvcsw                30584          # 13.26%
nivcsw               200012         # 86.74%
inblock              0              # 0.00/sec
onblock              1021736        # 409.68/sec
cpu-clock            21542010047079 # 21542.010 seconds
task-clock           21542202986873 # 21542.203 seconds
page faults          8858867        # 411.233/sec
context switches     242783         # 11.270/sec
cpu migrations       7688           # 0.357/sec
major page faults    47             # 0.002/sec
minor page faults    8858820        # 411.231/sec
alignment faults     0              # 0.000/sec
emulation faults     0              # 0.000/sec
branches             16114747147990 # 101.889 branches per 1000 inst
branch misses        19153578824    # 0.12% branch miss
conditional          10609186092769 # 67.079 conditional branches per 1000 inst
indirect             1695742623714  # 10.722 indirect branches per 1000 inst
cpu-cycles           87215208815204 # 2.22 GHz
instructions         178678953072578 # 2.05 IPC
slots                174423368262540 #
retiring             62401214102905 # 35.8% (56.0%) high
-- ucode             131586618110   #     0.1%
-- fastpath          62269627484795 #    35.7%
frontend             2321571740608  #  1.3% ( 2.1%) low
-- latency           706428625452   #     0.4%
-- bandwidth         1615143115156  #     0.9%
backend              46480039019914 # 26.6% (41.7%)
-- cpu               37908047673805 #    21.7%
-- memory            8571991346109  #     4.9%
speculation          299016986173   #  0.2% ( 0.3%) low
-- branch mispredict 281309161062   #     0.2%
-- pipeline restart  17707825111    #     0.0%
smt-contention       62921325104833 # 36.1% ( 0.0%)
cpu-cycles           74673715961135 # 2.10 GHz
instructions         152456531522489 # 2.04 IPC
instructions         50818766143828 # 7.328 l2 access per 1000 inst
l2 hit from l1       196442306356   # 23.41% l2 miss
l2 miss from l1      13403485931    #
l2 hit from l2 pf    102187178346   #
l3 hit from l2 pf    45428238002    #
l3 miss from l2 pf   28327299005    #
instructions         50821318031341 # 323.549 float per 1000 inst
float 512            97             # 0.000 AVX-512 per 1000 inst
float 256            630            # 0.000 AVX-256 per 1000 inst
float 128            16443198436737 # 323.549 AVX-128 per 1000 inst
float MMX            0              # 0.000 MMX per 1000 inst
float scalar         0              # 0.000 scalar per 1000 inst
instructions         2670454        #
opcache              988041         # 369.990 opcache per 1000 inst
opcache miss         532227         # 53.9% opcache miss rate
l1 dTLB miss         5238           # 1.961 L1 dTLB per 1000 inst
l2 dTLB miss         1129           # 0.423 L2 dTLB per 1000 inst
instructions         2699471        #
icache               1306392        # 483.944 icache per 1000 inst
icache miss          110562         #  8.5% icache miss rate
l1 iTLB miss         13             # 0.005 L1 iTLB per 1000 inst
l2 iTLB miss         0              # 0.000 L2 iTLB per 1000 inst
tlb flush            22             # 0.008 TLB flush per 1000 inst
Intel metrics
elapsed              1645.268
on_cpu               0.715          # 11.44 / 16 cores
utime                18811.581
stime                15.025
nvcsw                28926          # 16.89%
nivcsw               142292         # 83.11%
inblock              559936         # 340.33/sec
onblock              230440         # 140.06/sec
cpu-clock            18826064492000 # 18826.064 seconds
task-clock           18826151799361 # 18826.152 seconds
page faults          8281354        # 439.886/sec
context switches     179211         # 9.519/sec
cpu migrations       19260          # 1.023/sec
major page faults    85             # 0.005/sec
minor page faults    8281269        # 439.881/sec
alignment faults     0              # 0.000/sec
emulation faults     0              # 0.000/sec
branches             13193076197482 # 112.251 branches per 1000 inst
branch misses        16326408207    # 0.12% branch miss
conditional          13193076222218 # 112.251 conditional branches per 1000 inst
indirect             4434825753165  # 37.733 indirect branches per 1000 inst
slots                97563657619520 #
retiring             59925790784692 # 61.4% (61.4%) high
-- ucode             3166614337055  #     3.2%
-- fastpath          56759176447637 #    58.2%
frontend             10212256156300 # 10.5% (10.5%)
-- latency           8543550138460  #     8.8%
-- bandwidth         1668706017840  #     1.7%
backend              26403767081345 # 27.1% (27.1%)
-- cpu               14690616659153 #    15.1%
-- memory            11713150422192 #    12.0%
speculation          815731012482   #  0.8% ( 0.8%) low
-- branch mispredict 760996322204   #     0.8%
-- pipeline restart  54734690278    #     0.1%
smt-contention       0              #  0.0% ( 0.0%)
cpu-cycles           50707273870129 # 1.92 GHz
instructions         105254985989712 # 2.08 IPC
l2 access            223186481571   # 3.799 l2 access per 1000 inst
l2 miss              76102210380    # 34.10% l2 miss
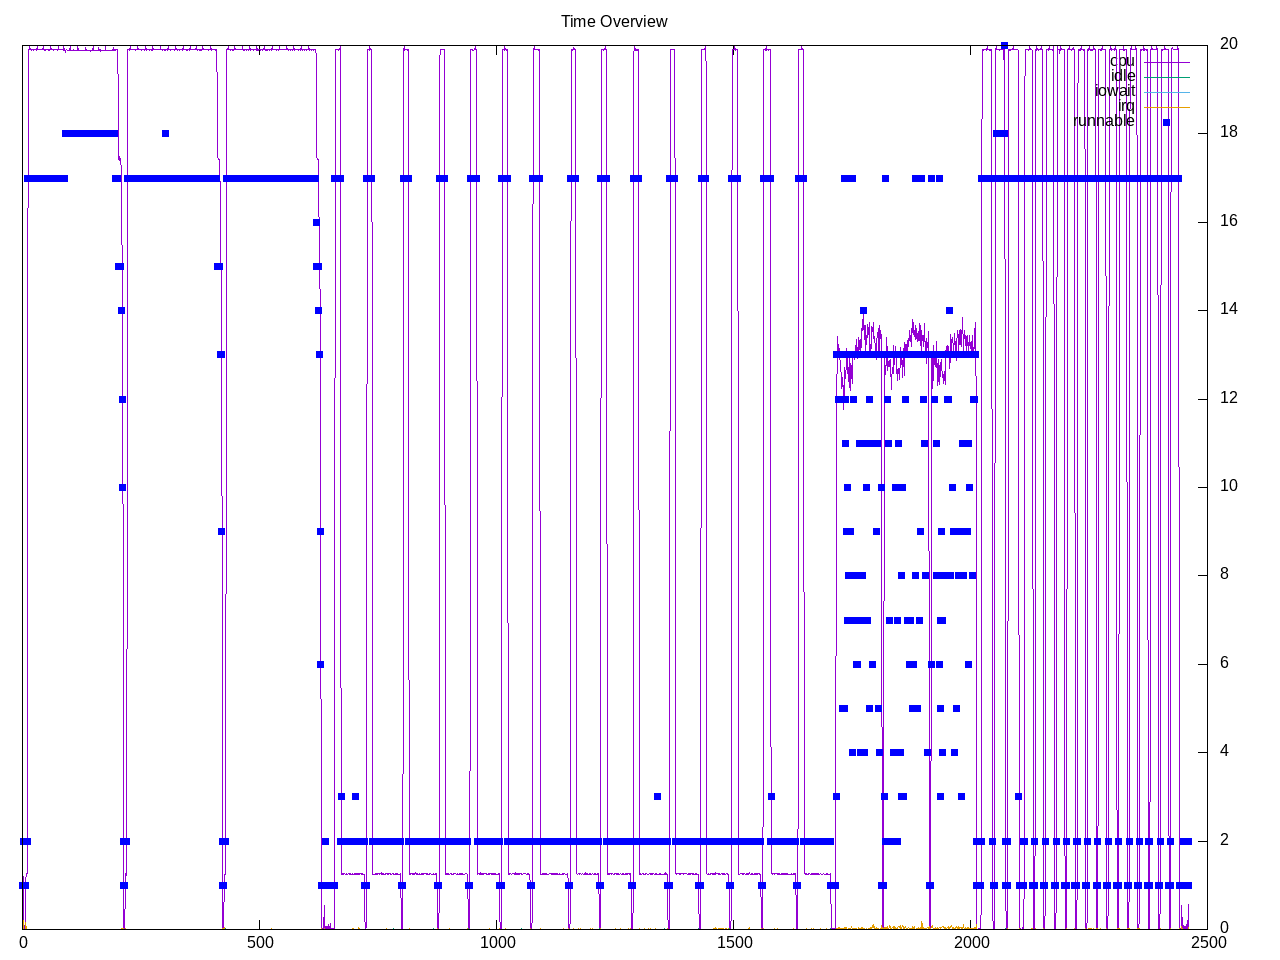
Process overview shows each process with a name. Looks like LavaMD took a while to settle and consumes the largest share.
979 processes
	 48 lavaMD               152420.00   109.60
	240 3D                   67068.45    21.12
	 48 leukocyte            48273.12   105.60
	 48 euler3d_cpu_dou      17002.74    51.68
	 48 sc_omp               12816.32     3.52
	204 clinfo                  58.31    18.29
	 38 vulkaninfo               1.33     1.33
	  9 OCL_particlefil          0.26     0.27
	  9 myocyte.out              0.20     0.26
	  4 vulkani:disk$0           0.14     0.14
	  6 glxinfo:gdrv0            0.14     0.07
	  6 glxinfo:gl0              0.14     0.07
	  6 php                      0.13     0.37
	  2 llvmpipe-0               0.07     0.07
	  2 llvmpipe-1               0.07     0.07
	  2 llvmpipe-10              0.07     0.07
	  2 llvmpipe-11              0.07     0.07
	  2 llvmpipe-12              0.07     0.07
	  2 llvmpipe-13              0.07     0.07
	  2 llvmpipe-14              0.07     0.07
	  2 llvmpipe-15              0.07     0.07
	  2 llvmpipe-2               0.07     0.07
	  2 llvmpipe-3               0.07     0.07
	  2 llvmpipe-4               0.07     0.07
	  2 llvmpipe-5               0.07     0.07
	  2 llvmpipe-6               0.07     0.07
	  2 llvmpipe-7               0.07     0.07
	  2 llvmpipe-8               0.07     0.07
	  2 llvmpipe-9               0.07     0.07
	  2 glxinfo                  0.07     0.04
	  2 glxinfo:cs0              0.06     0.03
	  2 glxinfo:disk$0           0.06     0.03
	  2 glxinfo:sh0              0.06     0.03
	  2 glxinfo:shlo0            0.06     0.03
	  6 clang                    0.04     0.04
	  3 rocminfo                 0.03     0.00
	  1 lspci                    0.01     0.02
	 94 sh                       0.00     0.00
	 33 rodinia                  0.00     0.00
	 13 gcc                      0.00     0.00
	  9 gsettings                0.00     0.00
	  8 stat                     0.00     0.00
	  8 systemd-detect-          0.00     0.00
	  6 llvm-link                0.00     0.00
	  5 phoronix-test-s          0.00     0.00
	  4 gmain                    0.00     0.00
	  3 dconf worker             0.00     0.00
	  2 cc                       0.00     0.00
	  2 lscpu                    0.00     0.00
	  2 uname                    0.00     0.00
	  2 which                    0.00     0.00
	  2 xset                     0.00     0.00
	  1 date                     0.00     0.00
	  1 dirname                  0.00     0.00
	  1 dmesg                    0.00     0.00
	  1 dmidecode                0.00     0.00
	  1 grep                     0.00     0.00
	  1 ifconfig                 0.00     0.00
	  1 ip                       0.00     0.00
	  1 lsmod                    0.00     0.00
	  1 mktemp                   0.00     0.00
	  1 ps                       0.00     0.00
	  1 qdbus                    0.00     0.00
	  1 readlink                 0.00     0.00
	  1 realpath                 0.00     0.00
	  1 sed                      0.00     0.00
	  1 sort                     0.00     0.00
	  1 stty                     0.00     0.00
	  1 systemctl                0.00     0.00
	  1 template.sh              0.00     0.00
	  1 wc                       0.00     0.00
	  1 xrandr                   0.00     0.00
0 processes running
47 maximum processes
Example computation blocks
      222891) rodinia          cpu=2 start=6.65  finish=211.78
        222892) lavaMD           cpu=1 start=6.65  finish=211.78
          222895) lavaMD           cpu=13 start=11.00 finish=211.78
          222896) lavaMD           cpu=8 start=11.00 finish=211.78
          222897) lavaMD           cpu=15 start=11.00 finish=211.78
          222898) lavaMD           cpu=0 start=11.00 finish=211.78
          222899) lavaMD           cpu=9 start=11.00 finish=211.78
          222900) lavaMD           cpu=10 start=11.00 finish=211.78
          222901) lavaMD           cpu=12 start=11.00 finish=211.78
          222902) lavaMD           cpu=11 start=11.00 finish=211.78
          222903) lavaMD           cpu=5 start=11.00 finish=211.78
          222904) lavaMD           cpu=6 start=11.00 finish=211.78
          222905) lavaMD           cpu=3 start=11.00 finish=211.78
          222906) lavaMD           cpu=2 start=11.00 finish=211.78
          222907) lavaMD           cpu=14 start=11.00 finish=211.78
          222908) lavaMD           cpu=7 start=11.00 finish=211.78
          222909) lavaMD           cpu=4 start=11.00 finish=211.78