
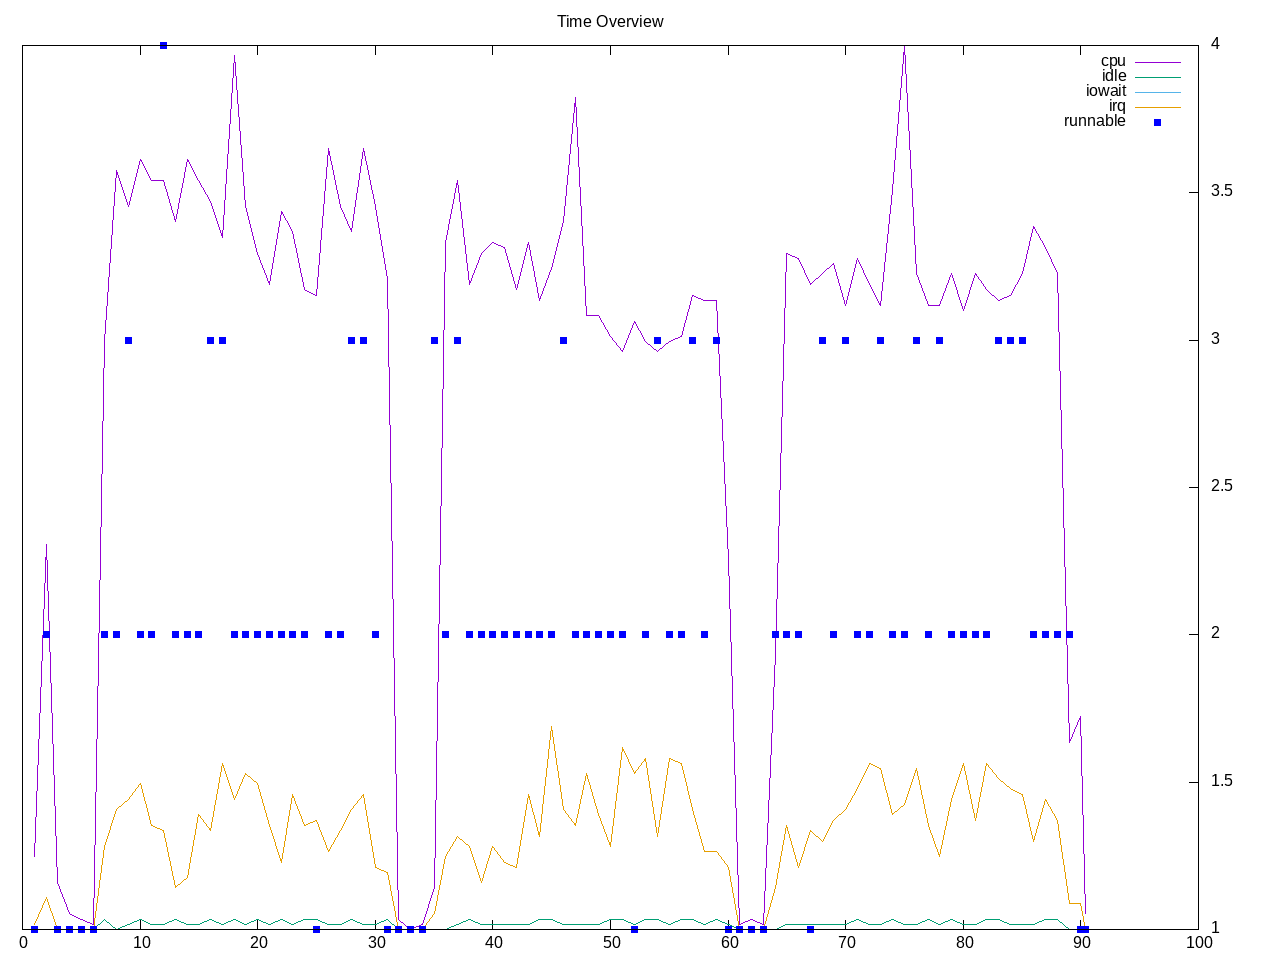
Testing the librsvg vector graphics library. There is one test that runs in less than 30 seconds. It looks mostly single-threaded.
Topdown profile shows retirement stalls as the highest portion.
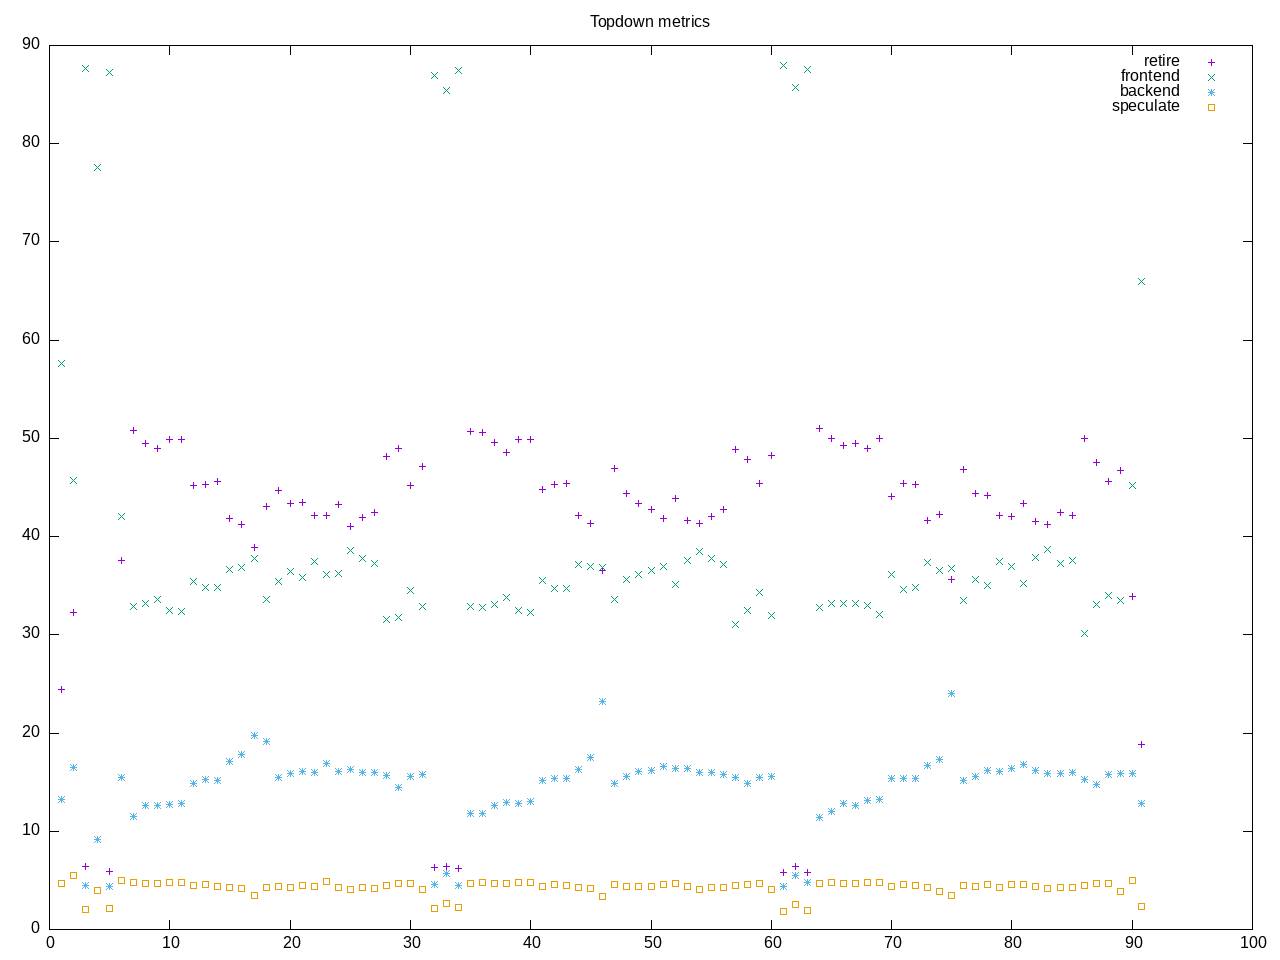
AMD metrics show oncore of only 0.7 and low backend stalls. There is not much floating point.
elapsed              91.690
on_cpu               0.043          # 0.69 / 16 cores
utime                45.313
stime                18.342
nvcsw                76062          # 95.55%
nivcsw               3545           # 4.45%
inblock              8              # 0.09/sec
onblock              103192         # 1125.45/sec
cpu-clock            90815954701    # 90.816 seconds
task-clock           90912432328    # 90.912 seconds
page faults          4042969        # 44471.024/sec
context switches     77945          # 857.363/sec
cpu migrations       5046           # 55.504/sec
major page faults    2              # 0.022/sec
minor page faults    4042967        # 44471.002/sec
alignment faults     0              # 0.000/sec
emulation faults     0              # 0.000/sec
branches             147471797199   # 176.955 branches per 1000 inst
branch misses        3089473014     # 2.09% branch miss
conditional          110382888857   # 132.451 conditional branches per 1000 inst
indirect             5037841192     # 6.045 indirect branches per 1000 inst
cpu-cycles           205545500455   # 0.14 GHz
instructions         642870821370   # 3.13 IPC high
slots                619621597422   #
retiring             273417324155   # 44.1% (44.3%)
-- ucode             793369832      #     0.1%
-- fastpath          272623954323   #    44.0%
frontend             219722230918   # 35.5% (35.6%)
-- latency           168134443470   #    27.1%
-- bandwidth         51587787448    #     8.3%
backend              96600027920    # 15.6% (15.7%) low
-- cpu               23569596994    #     3.8%
-- memory            73030430926    #    11.8%
speculation          27318925102    #  4.4% ( 4.4%)
-- branch mispredict 27122343208    #     4.4%
-- pipeline restart  196581894      #     0.0%
smt-contention       2561245890     #  0.4% ( 0.0%)
cpu-cycles           205272619877   # 0.14 GHz
instructions         637323484540   # 3.10 IPC high
instructions         275283291422   # 14.327 l2 access per 1000 inst
l2 hit from l1       3380047154     # 21.79% l2 miss
l2 miss from l1      582451810      #
l2 hit from l2 pf    287054714      #
l3 hit from l2 pf    187892718      #
l3 miss from l2 pf   89099902       #
instructions         279028735556   # 29.884 float per 1000 inst
float 512            664            # 0.000 AVX-512 per 1000 inst
float 256            596            # 0.000 AVX-256 per 1000 inst
float 128            8338532082     # 29.884 AVX-128 per 1000 inst
float MMX            0              # 0.000 MMX per 1000 inst
float scalar         0              # 0.000 scalar per 1000 inst
instructions         830841454647   #
opcache              135720537947   # 163.353 opcache per 1000 inst
opcache miss         20306663678    # 15.0% opcache miss rate
l1 dTLB miss         975531218      # 1.174 L1 dTLB per 1000 inst
l2 dTLB miss         61755707       # 0.074 L2 dTLB per 1000 inst
instructions         831010059760   #
icache               44486178211    # 53.533 icache per 1000 inst
icache miss          5914794798     # 13.3% icache miss rate
l1 iTLB miss         73929852       # 0.089 L1 iTLB per 1000 inst
l2 iTLB miss         0              # 0.000 L2 iTLB per 1000 inst
tlb flush            893267         # 0.001 TLB flush per 1000 inst
Intel metrics
elapsed              102.997
on_cpu               0.044          # 0.70 / 16 cores
utime                56.876
stime                15.552
nvcsw                74213          # 92.13%
nivcsw               6340           # 7.87%
inblock              8624           # 83.73/sec
onblock              91928          # 892.53/sec
cpu-clock            94859011406    # 94.859 seconds
task-clock           95098965683    # 95.099 seconds
page faults          3987414        # 41929.100/sec
context switches     78931          # 829.988/sec
cpu migrations       7729           # 81.273/sec
major page faults    66             # 0.694/sec
minor page faults    3987348        # 41928.406/sec
alignment faults     0              # 0.000/sec
emulation faults     0              # 0.000/sec
branches             143294059807   # 173.502 branches per 1000 inst
branch misses        1333887632     # 0.93% branch miss
conditional          143295083391   # 173.503 conditional branches per 1000 inst
indirect             6271520462     # 7.594 indirect branches per 1000 inst
slots                1481294216192  #
retiring             763595480156   # 51.5% (51.5%)
-- ucode             44478293800    #     3.0%
-- fastpath          719117186356   #    48.5%
frontend             336402997348   # 22.7% (22.7%)
-- latency           170261793634   #    11.5%
-- bandwidth         166141203714   #    11.2%
backend              213270529849   # 14.4% (14.4%) low
-- cpu               116212942772   #     7.8%
-- memory            97057587077    #     6.6%
speculation          171291661914   # 11.6% (11.6%) high
-- branch mispredict 165903031700   #    11.2%
-- pipeline restart  5388630214     #     0.4%
smt-contention       0              #  0.0% ( 0.0%)
cpu-cycles           258683319982   # 0.15 GHz
instructions         841791808851   # 3.25 IPC high
l2 access            9594028901     # 11.888 l2 access per 1000 inst
l2 miss              3246302962     # 33.84% l2 miss
cpu-cycles           248821553158   # 13.1% memory latency
load stalls          30878249372    #  1.7% l1 bound
l1 miss              26556503992    #  5.9% l2 bound
l2 miss              11955857818    #  2.1% l3 bound
l3 miss              6672889025     #  2.7% dram bound
store_stalls         1636418541     #  0.7% store bound
Process overview shows many short-lived processes running.
31989 processes
	25845 rsvg-convert           432.25   174.98
	1942 gmain                   52.40    14.06
	1938 gdbus                   52.37    14.05
	 68 clinfo                  15.55     6.97
	 38 vulkaninfo               1.52     0.95
	  4 vulkani:disk$0           0.16     0.10
	  2 llvmpipe-0               0.08     0.05
	  2 llvmpipe-1               0.08     0.05
	  2 llvmpipe-10              0.08     0.05
	  2 llvmpipe-11              0.08     0.05
	  2 llvmpipe-12              0.08     0.05
	  2 llvmpipe-13              0.08     0.05
	  2 llvmpipe-14              0.08     0.05
	  2 llvmpipe-15              0.08     0.05
	  2 llvmpipe-2               0.08     0.05
	  2 llvmpipe-3               0.08     0.05
	  2 llvmpipe-4               0.08     0.05
	  2 llvmpipe-5               0.08     0.05
	  2 llvmpipe-6               0.08     0.05
	  2 llvmpipe-7               0.08     0.05
	  2 llvmpipe-8               0.08     0.05
	  2 llvmpipe-9               0.08     0.05
	  3 rsvg                     0.07     0.45
	  6 php                      0.06     0.07
	  6 clang                    0.06     0.06
	  3 rocminfo                 0.03     0.00
	1935 [pango] FcInit           0.00     5.30
	  1 lspci                    0.00     0.02
	  1 ps                       0.00     0.01
	 82 sh                       0.00     0.00
	 12 gcc                      0.00     0.00
	  9 gsettings                0.00     0.00
	  8 stat                     0.00     0.00
	  8 systemd-detect-          0.00     0.00
	  6 llvm-link                0.00     0.00
	  5 phoronix-test-s          0.00     0.00
	  4 glxinfo                  0.00     0.00
	  4 grep                     0.00     0.00
	  3 dconf worker             0.00     0.00
	  2 lscpu                    0.00     0.00
	  2 setterm                  0.00     0.00
	  2 uname                    0.00     0.00
	  2 which                    0.00     0.00
	  1 cc                       0.00     0.00
	  1 date                     0.00     0.00
	  1 dirname                  0.00     0.00
	  1 dmesg                    0.00     0.00
	  1 dmidecode                0.00     0.00
	  1 ifconfig                 0.00     0.00
	  1 ip                       0.00     0.00
	  1 lsmod                    0.00     0.00
	  1 mktemp                   0.00     0.00
	  1 qdbus                    0.00     0.00
	  1 readlink                 0.00     0.00
	  1 realpath                 0.00     0.00
	  1 sed                      0.00     0.00
	  1 sort                     0.00     0.00
	  1 stty                     0.00     0.00
	  1 systemctl                0.00     0.00
	  1 template.sh              0.00     0.00
	  1 wc                       0.00     0.00
0 processes running
47 maximum processes