
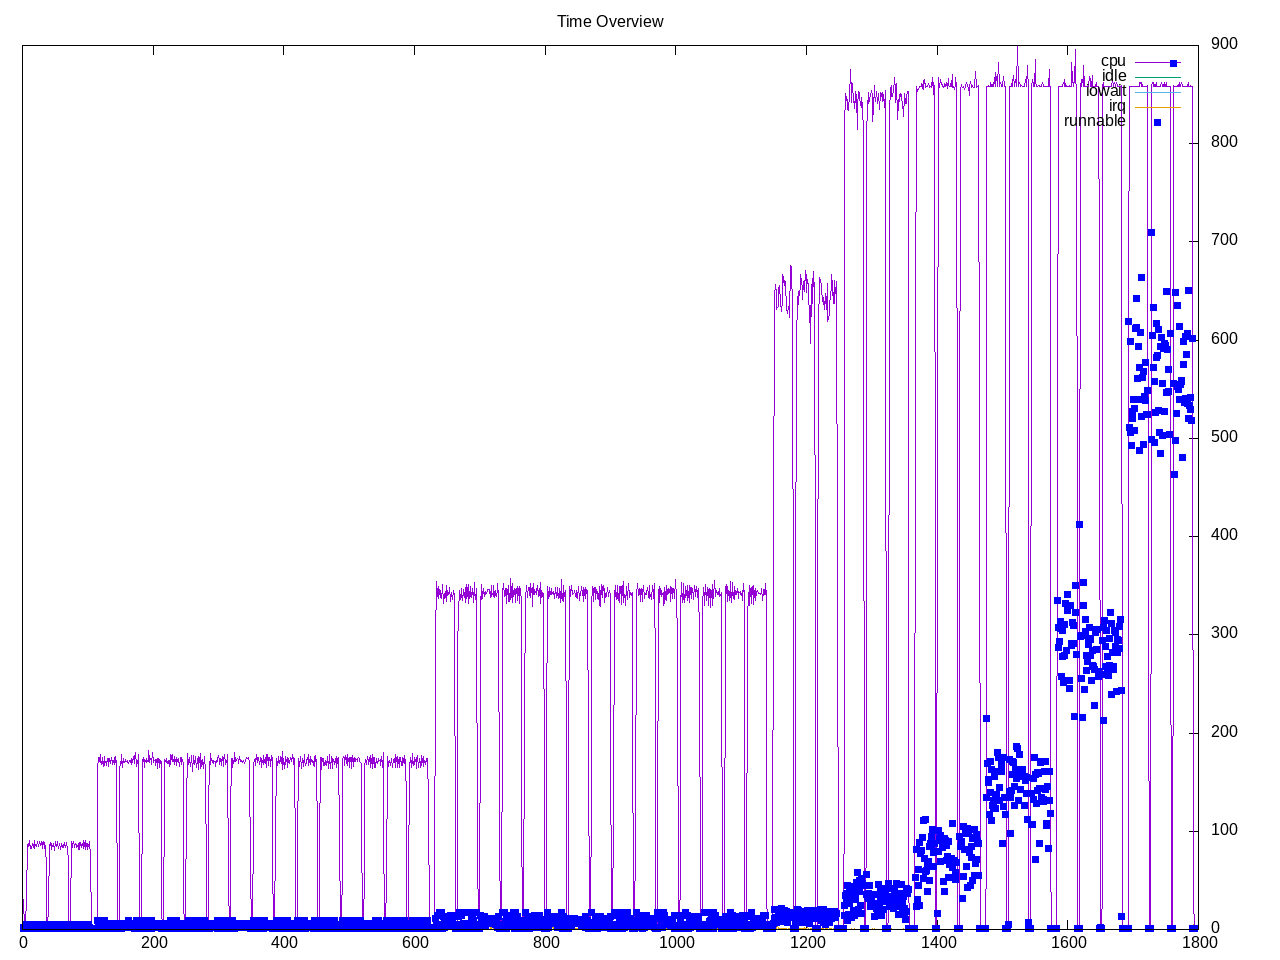
A Linux kernel scheduler benchmark. There are nine workloads measuring latency with increasing numbers of threads. Plot below reflects both increased runable threads and usage.
Topdown profile shows mostly memory bound with some frontend stalls.
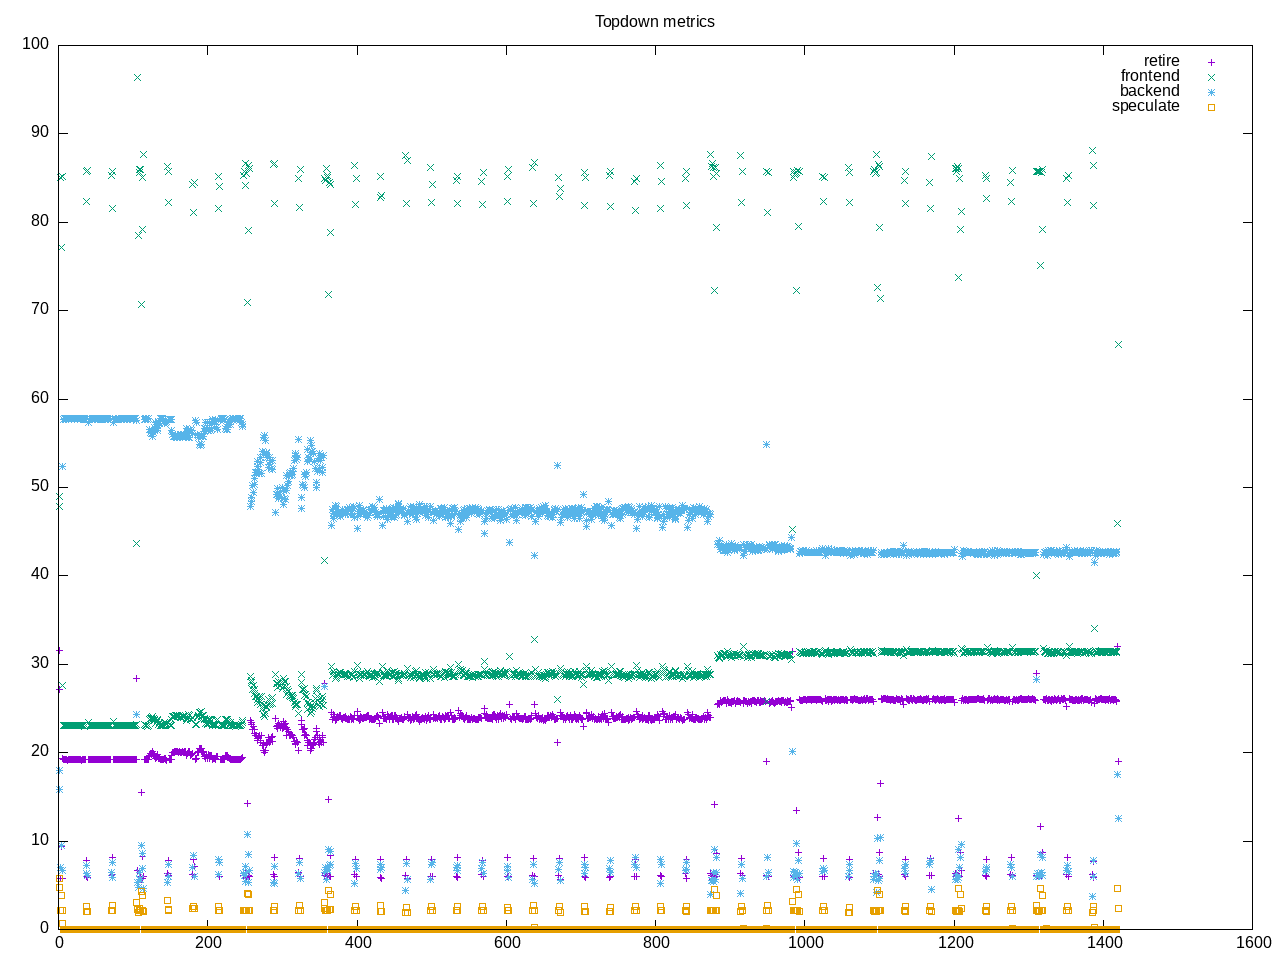
AMD metrics show backend stalls. There is little floating point code and little L2 access.
elapsed              1556.050
on_cpu               0.645          # 10.32 / 16 cores
utime                16042.943
stime                11.160
nvcsw                1661935        # 45.05%
nivcsw               2026894        # 54.95%
inblock              0              # 0.00/sec
onblock              14568          # 9.36/sec
cpu-clock            16053848559152 # 16053.849 seconds
task-clock           16054114142431 # 16054.114 seconds
page faults          242257         # 15.090/sec
context switches     3696293        # 230.240/sec
cpu migrations       790049         # 49.212/sec
major page faults    57             # 0.004/sec
minor page faults    242200         # 15.086/sec
alignment faults     0              # 0.000/sec
emulation faults     0              # 0.000/sec
branches             8363015807661  # 181.011 branches per 1000 inst
branch misses        1751506043     # 0.02% branch miss
conditional          6129106510907  # 132.659 conditional branches per 1000 inst
indirect             555221078517   # 12.017 indirect branches per 1000 inst
cpu-cycles           73140054874996 # 2.54 GHz
instructions         46237826856780 # 0.63 IPC low
slots                146432173835976 #
retiring             24129100695098 # 16.5% (24.2%)
-- ucode             370520955370   #     0.3%
-- fastpath          23758579739728 #    16.2%
frontend             29102512339367 # 19.9% (29.2%)
-- latency           24587855340780 #    16.8%
-- bandwidth         4514656998587  #     3.1%
backend              46483315674898 # 31.7% (46.6%)
-- cpu               10093079433097 #     6.9%
-- memory            36390236241801 #    24.9%
speculation          2955527432     #  0.0% ( 0.0%) low
-- branch mispredict 2946103259     #     0.0%
-- pipeline restart  9424173        #     0.0%
smt-contention       46714117571170 # 31.9% ( 0.0%)
cpu-cycles           67822818429201 # 2.35 GHz
instructions         43003680601254 # 0.63 IPC low
instructions         14340971853956 # 0.122 l2 access per 1000 inst
l2 hit from l1       1599372168     # 15.28% l2 miss
l2 miss from l1      197105566      #
l2 hit from l2 pf    77075632       #
l3 hit from l2 pf    55117623       #
l3 miss from l2 pf   14657946       #
instructions         14335290807670 # 4.475 float per 1000 inst
float 512            108            # 0.000 AVX-512 per 1000 inst
float 256            480            # 0.000 AVX-256 per 1000 inst
float 128            64152822075    # 4.475 AVX-128 per 1000 inst
float MMX            0              # 0.000 MMX per 1000 inst
float scalar         0              # 0.000 scalar per 1000 inst
instructions         26647384037721 #
opcache              3861767750251  # 144.921 opcache per 1000 inst
opcache miss         7442788516     #  0.2% opcache miss rate
l1 dTLB miss         139727119      # 0.005 L1 dTLB per 1000 inst
l2 dTLB miss         18498881       # 0.001 L2 dTLB per 1000 inst
instructions         52883862220061 #
icache               25470270754    # 0.482 icache per 1000 inst
icache miss          3143824182     # 12.3% icache miss rate
l1 iTLB miss         9913687        # 0.000 L1 iTLB per 1000 inst
l2 iTLB miss         0              # 0.000 L2 iTLB per 1000 inst
tlb flush            146204         # 0.000 TLB flush per 1000 inst
Intel metrics show backend stalls as more CPU-based
elapsed              2139.355
on_cpu               0.565          # 9.04 / 16 cores
utime                19329.698
stime                10.853
nvcsw                1642438        # 46.31%
nivcsw               1904138        # 53.69%
inblock              288            # 0.13/sec
onblock              3760           # 1.76/sec
cpu-clock            19342627391967 # 19342.627 seconds
task-clock           19343100659394 # 19343.101 seconds
page faults          180818         # 9.348/sec
context switches     3556927        # 183.886/sec
cpu migrations       785457         # 40.607/sec
major page faults    66             # 0.003/sec
minor page faults    180752         # 9.345/sec
alignment faults     0              # 0.000/sec
emulation faults     0              # 0.000/sec
branches             4562313428524  # 180.964 branches per 1000 inst
branch misses        259291716      # 0.01% branch miss
conditional          4562313732684  # 180.964 conditional branches per 1000 inst
indirect             1397283320799  # 55.423 indirect branches per 1000 inst
slots                89163987381800 #
retiring             12228322389427 # 13.7% (13.7%) low
-- ucode             4221981936017  #     4.7%
-- fastpath          8006340453410  #     9.0%
frontend             6991394912521  #  7.8% ( 7.8%)
-- latency           5126137258625  #     5.7%
-- bandwidth         1865257653896  #     2.1%
backend              69975878002186 # 78.5% (78.5%) high
-- cpu               67849553454305 #    76.1%
-- memory            2126324547881  #     2.4%
speculation          2900478872     #  0.0% ( 0.0%) low
-- branch mispredict 2772785413     #     0.0%
-- pipeline restart  127693459      #     0.0%
smt-contention       0              #  0.0% ( 0.0%)
cpu-cycles           61862121549034 # 1.75 GHz
instructions         20391443056364 # 0.33 IPC low
l2 access            2429707648     # 0.224 l2 access per 1000 inst
l2 miss              786985989      # 32.39% l2 miss
cpu-cycles           23582529091664 #  3.7% memory latency
load stalls          864295341452   #  3.6% l1 bound
l1 miss              9987194866     #  0.0% l2 bound
l2 miss              6326008394     #  0.0% l3 bound
l3 miss              926737004      #  0.0% dram bound
store_stalls         276316533      #  0.0% store bound
Process summary
8083 processes
	7664 schbench             3752749.00  1085.68
	 68 clinfo                  16.21     5.99
	 38 vulkaninfo               1.52     0.96
	  4 vulkani:disk$0           0.16     0.10
	  6 php                      0.14     0.23
	  6 glxinfo:gdrv0            0.11     0.05
	  6 glxinfo:gl0              0.11     0.05
	  2 llvmpipe-0               0.08     0.05
	  2 llvmpipe-1               0.08     0.05
	  2 llvmpipe-10              0.08     0.05
	  2 llvmpipe-11              0.08     0.05
	  2 llvmpipe-12              0.08     0.05
	  2 llvmpipe-13              0.08     0.05
	  2 llvmpipe-14              0.08     0.05
	  2 llvmpipe-15              0.08     0.05
	  2 llvmpipe-2               0.08     0.05
	  2 llvmpipe-3               0.08     0.05
	  2 llvmpipe-4               0.08     0.05
	  2 llvmpipe-5               0.08     0.05
	  2 llvmpipe-6               0.08     0.05
	  2 llvmpipe-7               0.08     0.05
	  2 llvmpipe-8               0.08     0.05
	  2 llvmpipe-9               0.08     0.05
	  6 clang                    0.06     0.04
	  2 glxinfo                  0.05     0.03
	  2 glxinfo:cs0              0.05     0.03
	  2 glxinfo:disk$0           0.05     0.03
	  2 glxinfo:sh0              0.05     0.03
	  2 glxinfo:shlo0            0.05     0.03
	  3 rocminfo                 0.03     0.00
	  1 lspci                    0.00     0.02
	  1 ps                       0.00     0.01
	 98 sh                       0.00     0.00
	 13 gcc                      0.00     0.00
	 11 gsettings                0.00     0.00
	  8 stat                     0.00     0.00
	  8 systemd-detect-          0.00     0.00
	  6 llvm-link                0.00     0.00
	  5 phoronix-test-s          0.00     0.00
	  3 gmain                    0.00     0.00
	  2 cc                       0.00     0.00
	  2 dconf worker             0.00     0.00
	  2 lscpu                    0.00     0.00
	  2 uname                    0.00     0.00
	  2 which                    0.00     0.00
	  2 xset                     0.00     0.00
	  1 date                     0.00     0.00
	  1 dirname                  0.00     0.00
	  1 dmesg                    0.00     0.00
	  1 dmidecode                0.00     0.00
	  1 grep                     0.00     0.00
	  1 ifconfig                 0.00     0.00
	  1 ip                       0.00     0.00
	  1 lsmod                    0.00     0.00
	  1 mktemp                   0.00     0.00
	  1 qdbus                    0.00     0.00
	  1 readlink                 0.00     0.00
	  1 realpath                 0.00     0.00
	  1 sed                      0.00     0.00
	  1 sort                     0.00     0.00
	  1 stty                     0.00     0.00
	  1 systemctl                0.00     0.00
	  1 template.sh              0.00     0.00
	  1 wc                       0.00     0.00
	  1 xrandr                   0.00     0.00
0 processes running
1291 maximum processes
Computation structures
      87468) schbench         cpu=6 start=148.37 finish=178.43
        87469) schbench         cpu=7 start=148.37 finish=178.43
          87470) schbench         cpu=2 start=148.37 finish=178.43
            87472) schbench         cpu=10 start=148.37 finish=178.43
            87474) schbench         cpu=12 start=148.37 finish=178.43
            87476) schbench         cpu=15 start=148.37 finish=178.43
            87477) schbench         cpu=6 start=148.37 finish=178.43
          87471) schbench         cpu=1 start=148.37 finish=178.43
            87473) schbench         cpu=4 start=148.37 finish=178.43
            87475) schbench         cpu=5 start=148.37 finish=178.43
            87478) schbench         cpu=11 start=148.37 finish=178.43
            87479) schbench         cpu=9 start=148.37 finish=178.43