
Testing of various hash functions. There are nine different workloads, most being tested in single-threaded mode.
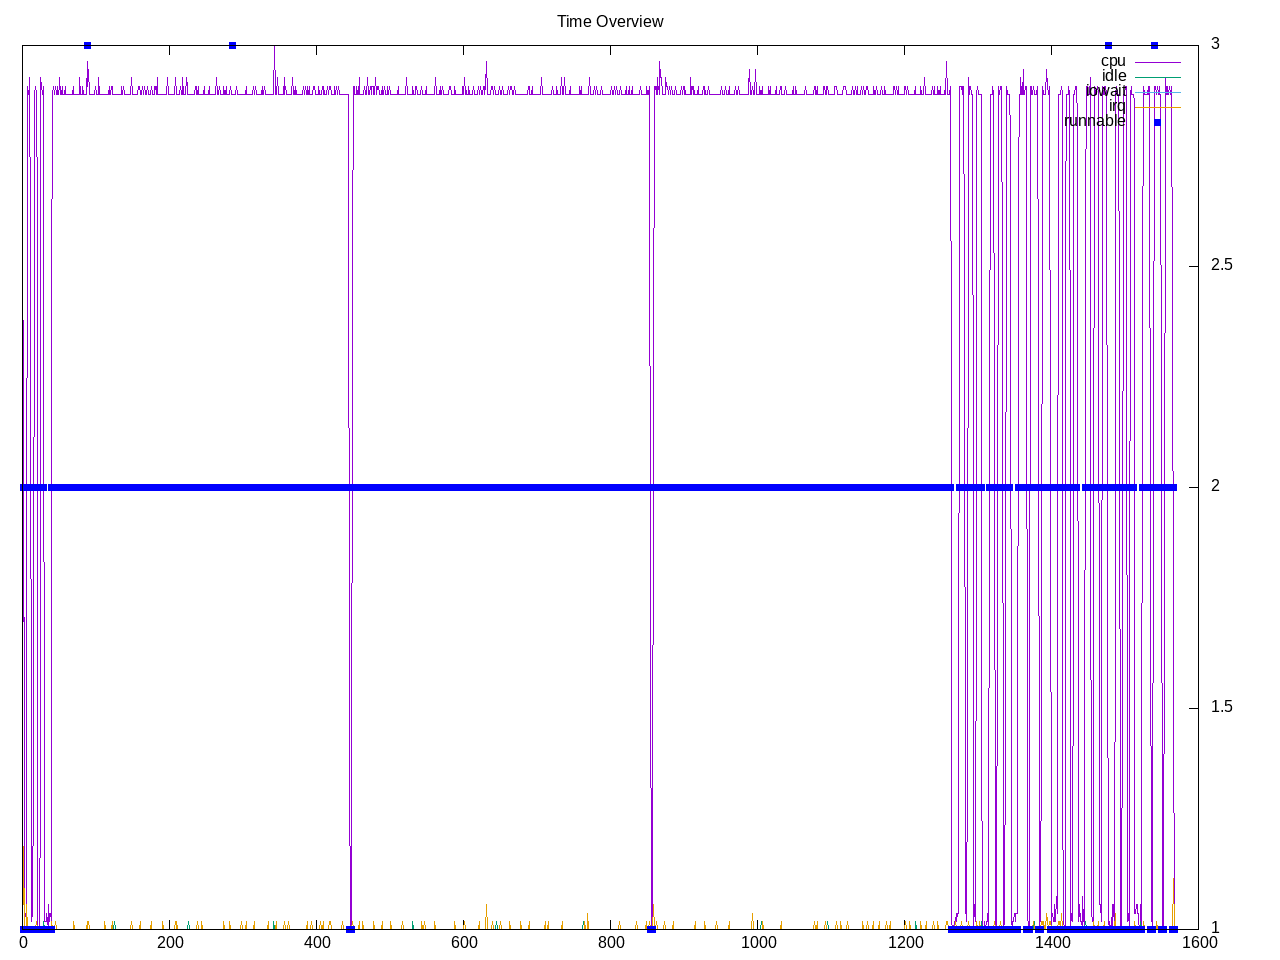
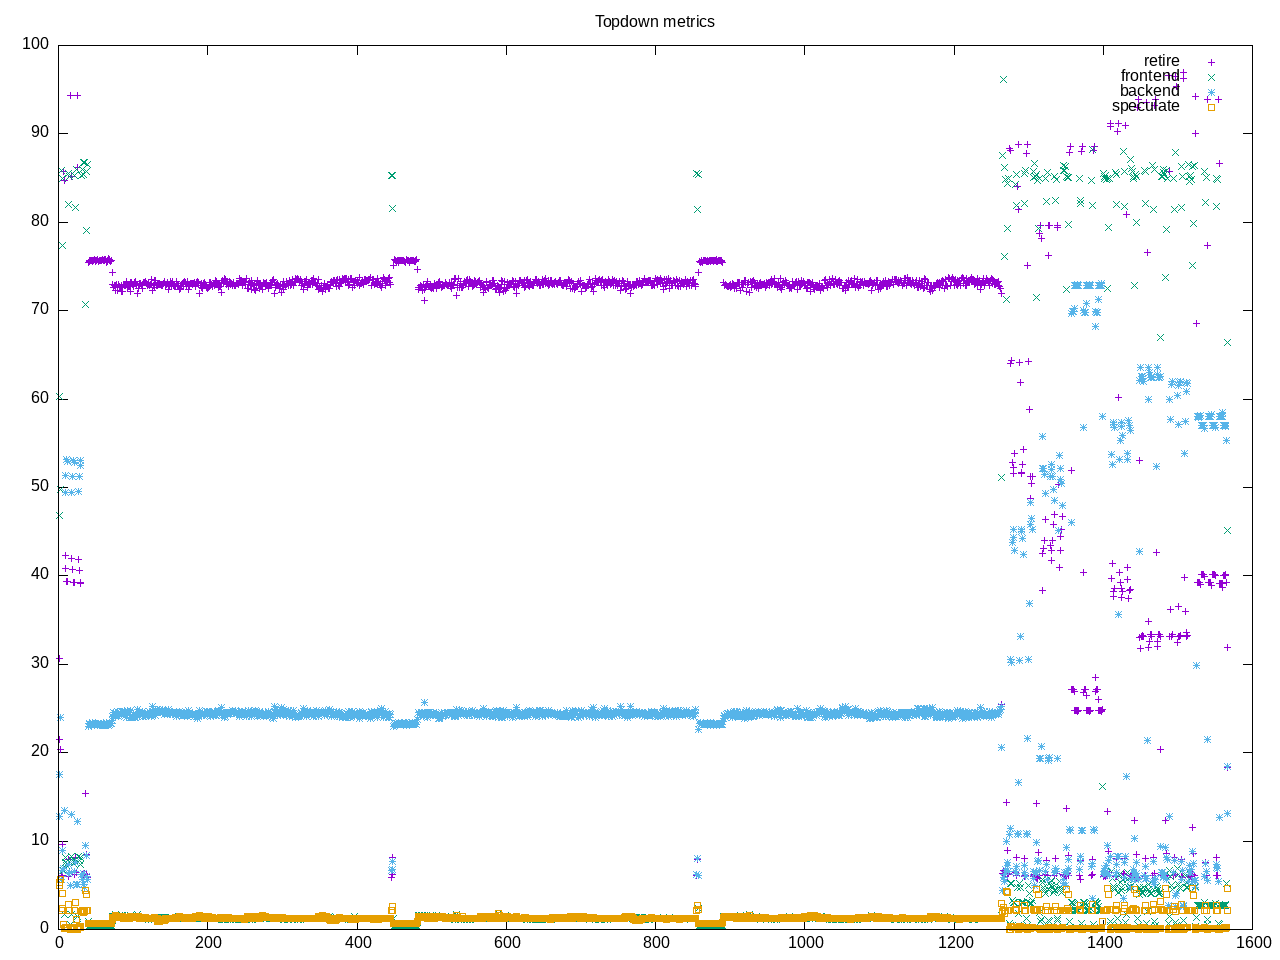
Topdown shows high overall retirement with the last workloads with slightly different profile than earlier ones.
AMD metrics show a very high IPC, single thread operation, some floating point and almost no L2 access. This is a small code that mostly lives in smallest caches.
elapsed              1566.574
on_cpu               0.056          # 0.90 / 16 cores
utime                1405.196
stime                0.948
nvcsw                2257           # 29.27%
nivcsw               5453           # 70.73%
inblock              0              # 0.00/sec
onblock              15312          # 9.77/sec
cpu-clock            1406343255973  # 1406.343 seconds
task-clock           1406357969683  # 1406.358 seconds
page faults          185397         # 131.828/sec
context switches     15305          # 10.883/sec
cpu migrations       334            # 0.237/sec
major page faults    2              # 0.001/sec
minor page faults    185395         # 131.826/sec
alignment faults     0              # 0.000/sec
emulation faults     0              # 0.000/sec
branches             1495100183668  # 54.321 branches per 1000 inst
branch misses        2160752312     # 0.14% branch miss
conditional          1395841520622  # 50.715 conditional branches per 1000 inst
indirect             24903641088    # 0.905 indirect branches per 1000 inst
cpu-cycles           6580810789108  # 0.26 GHz
instructions         27521443521680 # 4.18 IPC
slots                13181546628816 #
retiring             9171866457372  # 69.6% (69.6%)
-- ucode             750435404      #     0.0%
-- fastpath          9171116021968  #    69.6%
frontend             221343209031   #  1.7% ( 1.7%)
-- latency           156266698086   #     1.2%
-- bandwidth         65076510945    #     0.5%
backend              3631513254290  # 27.5% (27.6%)
-- cpu               1226756271225  #     9.3%
-- memory            2404756983065  #    18.2%
speculation          155520770377   #  1.2% ( 1.2%)
-- branch mispredict 85140199853    #     0.6%
-- pipeline restart  70380570524    #     0.5%
smt-contention       1302086497     #  0.0% ( 0.0%)
cpu-cycles           6556804737849  # 0.26 GHz
instructions         27521663699112 # 4.20 IPC
instructions         9185329763862  # 0.271 l2 access per 1000 inst
l2 hit from l1       2349727250     # 2.16% l2 miss
l2 miss from l1      22158458       #
l2 hit from l2 pf    105574795      #
l3 hit from l2 pf    25325193       #
l3 miss from l2 pf   6146166        #
instructions         9173363328790  # 65.883 float per 1000 inst
float 512            90             # 0.000 AVX-512 per 1000 inst
float 256            360            # 0.000 AVX-256 per 1000 inst
float 128            604364513727   # 65.883 AVX-128 per 1000 inst
float MMX            0              # 0.000 MMX per 1000 inst
float scalar         0              # 0.000 scalar per 1000 inst
Intel metrics show high IPC and low GHz
elapsed              1572.995
on_cpu               0.056          # 0.90 / 16 cores
utime                1411.729
stime                0.717
nvcsw                2164           # 25.20%
nivcsw               6424           # 74.80%
inblock              2640           # 1.68/sec
onblock              3344           # 2.13/sec
cpu-clock            1412590631712  # 1412.591 seconds
task-clock           1412603168736  # 1412.603 seconds
page faults          170457         # 120.669/sec
context switches     16208          # 11.474/sec
cpu migrations       1172           # 0.830/sec
major page faults    10             # 0.007/sec
minor page faults    170447         # 120.662/sec
alignment faults     0              # 0.000/sec
emulation faults     0              # 0.000/sec
branches             1479471141439  # 55.404 branches per 1000 inst
branch misses        2218751241     # 0.15% branch miss
conditional          1479471155391  # 55.404 conditional branches per 1000 inst
indirect             23059444347    # 0.864 indirect branches per 1000 inst
slots                32097078581210 #
retiring             27047314342263 # 84.3% (84.3%)
-- ucode             1499727894222  #     4.7%
-- fastpath          25547586448041 #    79.6%
frontend             562755433103   #  1.8% ( 1.8%)
-- latency           129961448818   #     0.4%
-- bandwidth         432793984285   #     1.3%
backend              4061051314363  # 12.7% (12.7%)
-- cpu               3643147164965  #    11.4%
-- memory            417904149398   #     1.3%
speculation          342277606009   #  1.1% ( 1.1%)
-- branch mispredict 237716644665   #     0.7%
-- pipeline restart  104560961344   #     0.3%
smt-contention       0              #  0.0% ( 0.0%)
cpu-cycles           5361198145918  # 0.21 GHz
instructions         26705571755611 # 4.98 IPC
l2 access            6859086527     # 0.257 l2 access per 1000 inst
l2 miss              154700276      # 2.26% l2 miss
Process summary, looks like there is one SMhasher executable with different algorithms
412 processes
	 27 SMHasher              1404.18     0.00
	 68 clinfo                  16.99     5.65
	 38 vulkaninfo               1.19     1.14
	  6 glxinfo:gdrv0            0.14     0.07
	  4 vulkani:disk$0           0.13     0.12
	  6 php                      0.10     0.34
	  2 llvmpipe-0               0.07     0.06
	  2 llvmpipe-1               0.07     0.06
	  2 llvmpipe-10              0.07     0.06
	  2 llvmpipe-11              0.07     0.06
	  2 llvmpipe-12              0.07     0.06
	  2 llvmpipe-13              0.07     0.06
	  2 llvmpipe-14              0.07     0.06
	  2 llvmpipe-15              0.07     0.06
	  2 llvmpipe-2               0.07     0.06
	  2 llvmpipe-3               0.07     0.06
	  2 llvmpipe-4               0.07     0.06
	  2 llvmpipe-5               0.07     0.06
	  2 llvmpipe-6               0.07     0.06
	  2 llvmpipe-7               0.07     0.06
	  2 llvmpipe-8               0.07     0.06
	  2 llvmpipe-9               0.07     0.06
	  2 glxinfo                  0.06     0.04
	  2 glxinfo:cs0              0.06     0.04
	  2 glxinfo:disk$0           0.06     0.03
	  2 glxinfo:sh0              0.06     0.03
	  2 glxinfo:shlo0            0.06     0.03
	  6 clang                    0.04     0.08
	  1 lspci                    0.01     0.02
	  3 rocminfo                 0.01     0.00
	  1 ps                       0.00     0.01
	 98 sh                       0.00     0.00
	 27 smhasher                 0.00     0.00
	 14 gsettings                0.00     0.00
	 13 gcc                      0.00     0.00
	  8 stat                     0.00     0.00
	  8 systemd-detect-          0.00     0.00
	  6 llvm-link                0.00     0.00
	  5 phoronix-test-s          0.00     0.00
	  2 cc                       0.00     0.00
	  2 lscpu                    0.00     0.00
	  2 uname                    0.00     0.00
	  2 which                    0.00     0.00
	  2 xset                     0.00     0.00
	  1 date                     0.00     0.00
	  1 dconf worker             0.00     0.00
	  1 dirname                  0.00     0.00
	  1 dmesg                    0.00     0.00
	  1 dmidecode                0.00     0.00
	  1 gmain                    0.00     0.00
	  1 grep                     0.00     0.00
	  1 ifconfig                 0.00     0.00
	  1 ip                       0.00     0.00
	  1 lsmod                    0.00     0.00
	  1 mktemp                   0.00     0.00
	  1 qdbus                    0.00     0.00
	  1 readlink                 0.00     0.00
	  1 realpath                 0.00     0.00
	  1 sed                      0.00     0.00
	  1 sort                     0.00     0.00
	  1 stty                     0.00     0.00
	  1 systemctl                0.00     0.00
	  1 template.sh              0.00     0.00
	  1 wc                       0.00     0.00
	  1 xrandr                   0.00     0.00
0 processes running
47 maximum processes
Core computation block
      272122) smhasher         cpu=4 start=5.81  finish=10.80
        272123) SMHasher         cpu=6 start=5.81  finish=10.80
      272126) smhasher         cpu=2 start=14.81 finish=19.84
        272127) SMHasher         cpu=3 start=14.81 finish=19.84
      272128) smhasher         cpu=2 start=23.84 finish=28.85
        272129) SMHasher         cpu=11 start=23.84 finish=28.85
      272130) sh               cpu=13 start=28.85 finish=28.86
        272131) sh               cpu=14 start=28.85 finish=28.86
      272132) smhasher         cpu=2 start=39.45 finish=444.76
        272133) SMHasher         cpu=11 start=39.46 finish=444.76
      272141) smhasher         cpu=10 start=448.77 finish=854.07
        272142) SMHasher         cpu=11 start=448.77 finish=854.07