
Benchmarking the sqlite database with five workloads that vary the number of threads operating from 1 to 16 in powers of 2. The number of runable processes only gets to five below.

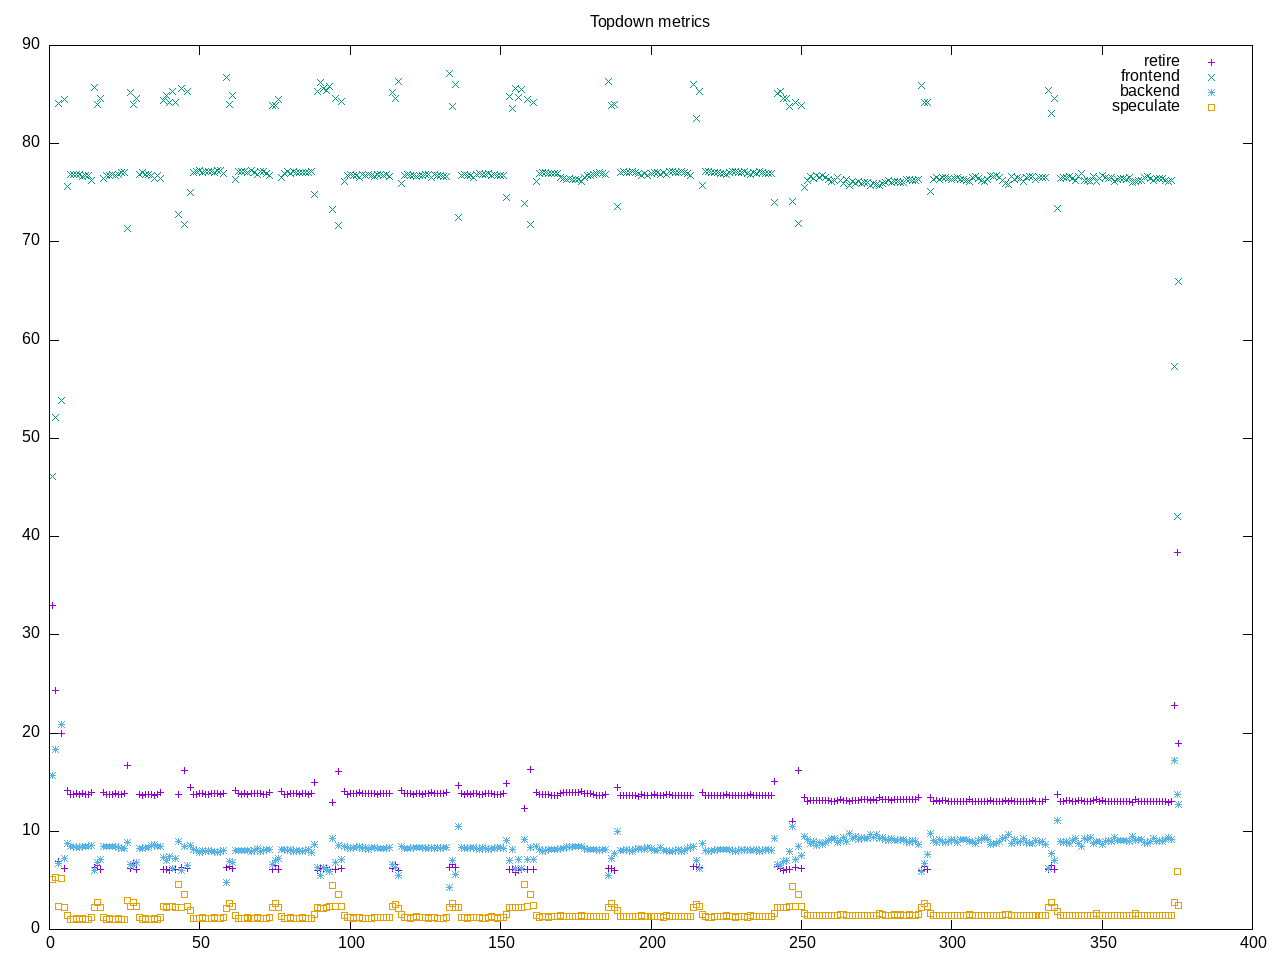
Topdown profile shows a workload dominated by frontend stalls and with a low retirement rate.
AMD metrics show less than one core of on-cpu on average. There is a moderately high L2 access and L2 miss rate but a low set of memory stalls. There is little floating point code.
elapsed              374.638
on_cpu               0.040          # 0.64 / 16 cores
utime                27.590
stime                212.440
nvcsw                6203372        # 83.77%
nivcsw               1202158        # 16.23%
inblock              0              # 0.00/sec
onblock              33573736       # 89616.45/sec
cpu-clock            234773842345   # 234.774 seconds
task-clock           237874612156   # 237.875 seconds
page faults          322667         # 1356.458/sec
context switches     7406386        # 31135.672/sec
cpu migrations       373657         # 1570.815/sec
major page faults    15             # 0.063/sec
minor page faults    322652         # 1356.395/sec
alignment faults     0              # 0.000/sec
emulation faults     0              # 0.000/sec
branches             73382349376    # 204.985 branches per 1000 inst
branch misses        9183182583     # 12.51% branch miss
conditional          39856833656    # 111.335 conditional branches per 1000 inst
indirect             735923949      # 2.056 indirect branches per 1000 inst
cpu-cycles           503897140569   # 0.08 GHz
instructions         362772973215   # 0.72 IPC
slots                985859494440   #
retiring             132024456157   # 13.4% (13.6%) low
-- ucode             675731578      #     0.1%
-- fastpath          131348724579   #    13.3%
frontend             743024582218   # 75.4% (76.3%) high
-- latency           632192389680   #    64.1%
-- bandwidth         110832192538   #    11.2%
backend              85070860456    #  8.6% ( 8.7%) low
-- cpu               24113210052    #     2.4%
-- memory            60957650404    #     6.2%
speculation          13412065688    #  1.4% ( 1.4%)
-- branch mispredict 13392597513    #     1.4%
-- pipeline restart  19468175       #     0.0%
smt-contention       12224270726    #  1.2% ( 0.0%)
cpu-cycles           503154312781   # 0.08 GHz
instructions         362440359916   # 0.72 IPC
instructions         117775660458   # 112.538 l2 access per 1000 inst
l2 hit from l1       12244170605    # 32.61% l2 miss
l2 miss from l1      3748255784     #
l2 hit from l2 pf    436472980      #
l3 hit from l2 pf    549331690      #
l3 miss from l2 pf   24246945       #
instructions         117838963317   # 11.287 float per 1000 inst
float 512            339            # 0.000 AVX-512 per 1000 inst
float 256            572            # 0.000 AVX-256 per 1000 inst
float 128            1330103949     # 11.287 AVX-128 per 1000 inst
float MMX            0              # 0.000 MMX per 1000 inst
float scalar         5              # 0.000 scalar per 1000 inst
Intel metrics
elapsed              948.364
on_cpu               0.038          # 0.61 / 16 cores
utime                84.072
stime                496.014
nvcsw                6863881        # 89.83%
nivcsw               776946         # 10.17%
inblock              0              # 0.00/sec
onblock              33562496       # 35389.88/sec
cpu-clock            565310791203   # 565.311 seconds
task-clock           572699669326   # 572.700 seconds
page faults          312550         # 545.749/sec
context switches     7644694        # 13348.522/sec
cpu migrations       1472792        # 2571.666/sec
major page faults    14             # 0.024/sec
minor page faults    312536         # 545.724/sec
alignment faults     0              # 0.000/sec
emulation faults     0              # 0.000/sec
branches             61483148417    # 177.932 branches per 1000 inst
branch misses        1319964232     # 2.15% branch miss
conditional          61483187617    # 177.933 conditional branches per 1000 inst
indirect             11339675159    # 32.817 indirect branches per 1000 inst
slots                1072578969920  #
retiring             226365385224   # 21.1% (21.1%)
-- ucode             37992131912    #     3.5%
-- fastpath          188373253312   #    17.6%
frontend             505370446250   # 47.1% (47.1%) high
-- latency           364473530709   #    34.0%
-- bandwidth         140896915541   #    13.1%
backend              267722977027   # 25.0% (25.0%)
-- cpu               129424001415   #    12.1%
-- memory            138298975612   #    12.9%
speculation          101927658915   #  9.5% ( 9.5%)
-- branch mispredict 96582518582    #     9.0%
-- pipeline restart  5345140333     #     0.5%
smt-contention       0              #  0.0% ( 0.0%)
cpu-cycles           364913872444   # 0.02 GHz
instructions         390403751528   # 1.07 IPC
l2 access            20396866754    # 92.720 l2 access per 1000 inst
l2 miss              5816501509     # 28.52% l2 miss
Process overview shows the test overhead is almost as much user time as the workload, though there is a much higher amount of system time. Interesting to drill deeper to see where that system time goes.
1205 processes
	372 sqlite3                 25.15   187.90
	 68 clinfo                  17.18     8.65
	 38 vulkaninfo               1.71     0.95
	  4 vulkani:disk$0           0.18     0.10
	  6 glxinfo:gdrv0            0.16     0.03
	  6 glxinfo:gl0              0.16     0.03
	  6 php                      0.13     0.12
	  2 llvmpipe-0               0.09     0.05
	  2 llvmpipe-1               0.09     0.05
	  2 llvmpipe-10              0.09     0.05
	  2 llvmpipe-11              0.09     0.05
	  2 llvmpipe-12              0.09     0.05
	  2 llvmpipe-13              0.09     0.05
	  2 llvmpipe-14              0.09     0.05
	  2 llvmpipe-15              0.09     0.05
	  2 llvmpipe-2               0.09     0.05
	  2 llvmpipe-3               0.09     0.05
	  2 llvmpipe-4               0.09     0.05
	  2 llvmpipe-5               0.09     0.05
	  2 llvmpipe-6               0.09     0.05
	  2 llvmpipe-7               0.09     0.05
	  2 llvmpipe-8               0.09     0.05
	  2 llvmpipe-9               0.09     0.05
	  2 glxinfo                  0.09     0.01
	  2 glxinfo:cs0              0.08     0.01
	  2 glxinfo:disk$0           0.08     0.01
	  2 glxinfo:sh0              0.08     0.01
	  2 glxinfo:shlo0            0.08     0.01
	  6 clang                    0.07     0.05
	  3 rocminfo                 0.03     0.00
	  1 lspci                    0.01     0.02
	  1 ps                       0.00     0.01
	292 cat                      0.00     0.00
	111 sh                       0.00     0.00
	108 sqlite-benchmar          0.00     0.00
	 20 bash                     0.00     0.00
	 20 rm                       0.00     0.00
	 15 seq                      0.00     0.00
	 13 gcc                      0.00     0.00
	  9 gsettings                0.00     0.00
	  9 stat                     0.00     0.00
	  8 systemd-detect-          0.00     0.00
	  6 llvm-link                0.00     0.00
	  5 phoronix-test-s          0.00     0.00
	  4 gmain                    0.00     0.00
	  3 dconf worker             0.00     0.00
	  2 cc                       0.00     0.00
	  2 lscpu                    0.00     0.00
	  2 uname                    0.00     0.00
	  2 which                    0.00     0.00
	  2 xset                     0.00     0.00
	  1 date                     0.00     0.00
	  1 dirname                  0.00     0.00
	  1 dmesg                    0.00     0.00
	  1 dmidecode                0.00     0.00
	  1 grep                     0.00     0.00
	  1 ifconfig                 0.00     0.00
	  1 ip                       0.00     0.00
	  1 lsmod                    0.00     0.00
	  1 mktemp                   0.00     0.00
	  1 qdbus                    0.00     0.00
	  1 readlink                 0.00     0.00
	  1 realpath                 0.00     0.00
	  1 sed                      0.00     0.00
	  1 sort                     0.00     0.00
	  1 stty                     0.00     0.00
	  1 systemctl                0.00     0.00
	  1 template.sh              0.00     0.00
	  1 wc                       0.00     0.00
	  1 xrandr                   0.00     0.00
0 processes running
58 maximum processes
Computation blocks are as follows
      20404) sqlite-benchmar  cpu=8 start=5.57  finish=13.19
        20405) cat              cpu=1 start=5.58  finish=5.58
        20406) seq              cpu=2 start=5.58  finish=5.58
        20407) sqlite-benchmar  cpu=4 start=5.58  finish=13.19
          20408) sqlite3          cpu=13 start=5.58  finish=5.59
          20409) cat              cpu=6 start=5.59  finish=7.45
          20410) sqlite3          cpu=10 start=5.59  finish=8.07
          20411) cat              cpu=13 start=8.07  finish=10.01
          20412) sqlite3          cpu=12 start=8.07  finish=10.63
          20413) cat              cpu=13 start=10.63 finish=12.57
          20414) sqlite3          cpu=14 start=10.63 finish=13.19