
Phoronix tensorflow with resnet50 batch size 64
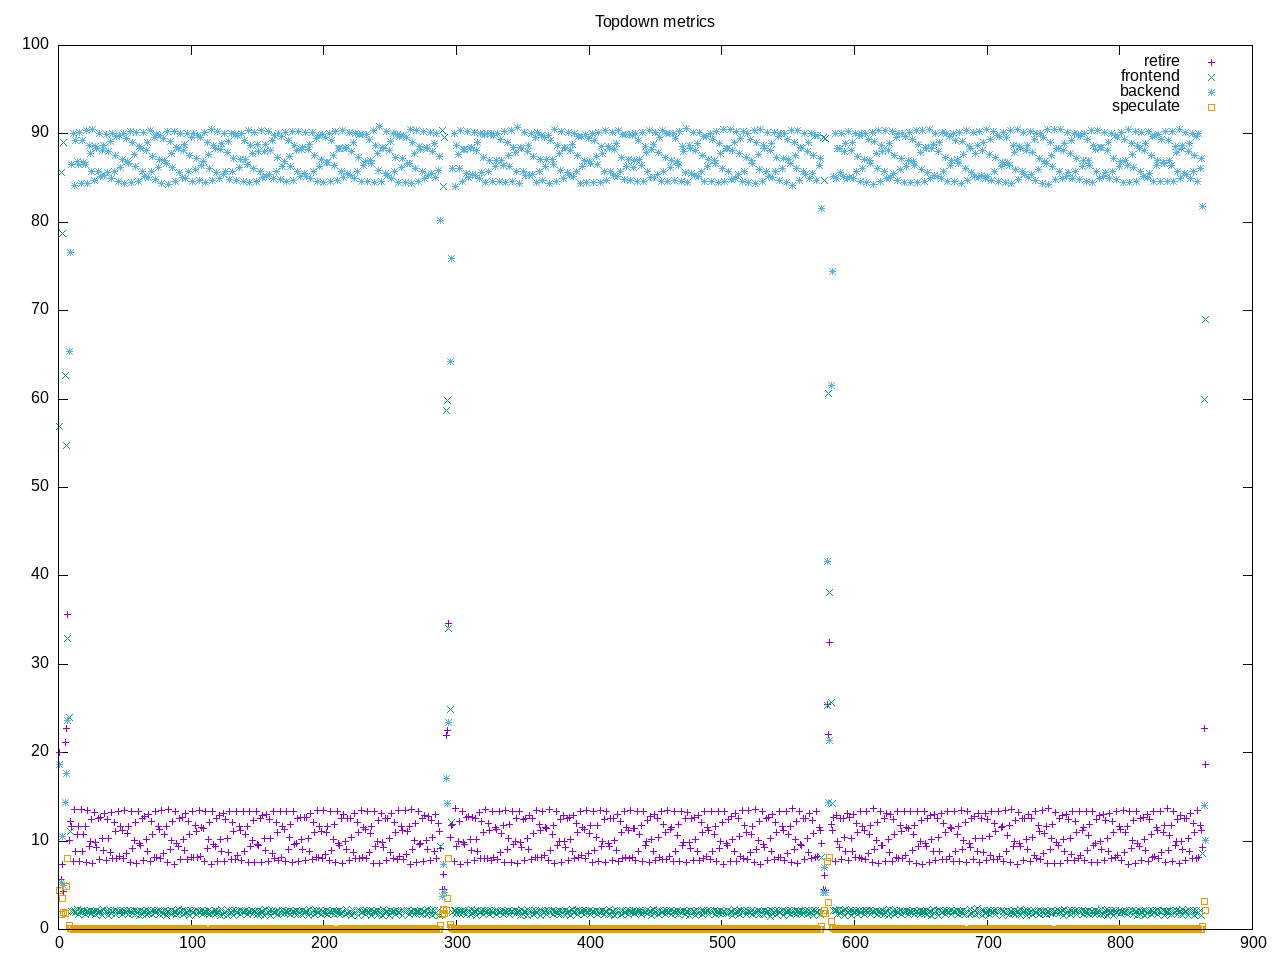
AMD metrics shows a workload with a lot of memory operations including L2 misses combined with cpu core operations with a fair amount of floating point.
elapsed              863.009
on_cpu               0.905          # 14.49 / 16 cores
utime                12411.355
stime                91.535
nvcsw                3282710        # 91.85%
nivcsw               291211         # 8.15%
inblock              5720
onblock              1200
cpu-clock            12516157413304 # 12516.157 seconds
task-clock           12518177989728 # 12518.178 seconds
page faults          11064521       # 883.876/sec
context switches     3578045        # 285.828/sec
cpu migrations       541658         # 43.270/sec
major page faults    42             # 0.003/sec
minor page faults    11064479       # 883.873/sec
alignment faults     0              # 0.000/sec
emulation faults     0              # 0.000/sec
branches             584022412717   # 20.641 branches per 1000 inst
branch misses        5377049822     # 0.92% branch miss
conditional          536426064913   # 18.959 conditional branches per 1000 inst
indirect             3308982806     # 0.117 indirect branches per 1000 inst
cpu-cycles           53588811756063 # 3.87 GHz
instructions         28290781703108 # 0.53 IPC
slots                107133025023402 #
retiring             9524494731791  #  8.9% (10.4%)
-- ucode             997841396      #     0.0%
-- fastpath          9523496890395  #     8.9%
frontend             1938764873769  #  1.8% ( 2.1%)
-- latency           1594472883906  #     1.5%
-- bandwidth         344291989863   #     0.3%
backend              79921103165442 # 74.6% (87.4%)
-- cpu               34642755177137 #    32.3%
-- memory            45278347988305 #    42.3%
speculation          45476223603    #  0.0% ( 0.0%)
-- branch mispredict 38988923174    #     0.0%
-- pipeline restart  6487300429     #     0.0%
smt-contention       15702947676761 # 14.7% ( 0.0%)
cpu-cycles           53578106185765 # 3.87 GHz
instructions         28287157572549 # 0.53 IPC
instructions         9432751214605  # 134.834 l2 access per 1000 inst
l2 hit from l1       928033007528   # 11.50% l2 miss
l2 miss from l1      52635401579    #
l2 hit from l2 pf    250202870552   #
l3 hit from l2 pf    47147988792    #
l3 miss from l2 pf   46468462841    #
instructions         9428428106186  # 37.224 float per 1000 inst
float 512            68             # 0.000 AVX-512 per 1000 inst
float 256            787391345      # 0.084 AVX-256 per 1000 inst
float 128            350180974896   # 37.141 AVX-128 per 1000 inst
float MMX            0              # 0.000 MMX per 1000 inst
float scalar         31             # 0.000 scalar per 1000 inst
Intel metrics shows less time on the cores and also a longer overall runtime.
elapsed              1665.194
on_cpu               0.621          # 9.94 / 16 cores
utime                16471.812
stime                74.065
nvcsw                2445852        # 86.38%
nivcsw               385496         # 13.62%
inblock              6928
onblock              1168
cpu-clock            16522570247592 # 16522.570 seconds
task-clock           16525566278147 # 16525.566 seconds
page faults          9772881        # 591.379/sec
context switches     2839550        # 171.828/sec
cpu migrations       742592         # 44.936/sec
major page faults    51             # 0.003/sec
minor page faults    9772830        # 591.376/sec
alignment faults     0              # 0.000/sec
emulation faults     0              # 0.000/sec
branches             1315588911649  # 22.142 branches per 1000 inst
branch misses        4086514516     # 0.31% branch miss
conditional          1315588926369  # 22.142 conditional branches per 1000 inst
indirect             470231770021   # 7.914 indirect branches per 1000 inst
slots                81158674362062 #
retiring             30632591230285 # 37.7% (37.7%)
-- ucode             1473030581277  #     1.8%
-- fastpath          29159560649008 #    35.9%
frontend             9540960332730  # 11.8% (11.8%)
-- latency           8398912584891  #    10.3%
-- bandwidth         1142047747839  #     1.4%
backend              40569942688186 # 50.0% (50.0%)
-- cpu               14005646405876 #    17.3%
-- memory            26564296282310 #    32.7%
speculation          1651850357581  #  2.0% ( 2.0%)
-- branch mispredict 1271607577543  #     1.6%
-- pipeline restart  380242780038   #     0.5%
smt-contention       0              #  0.0% ( 0.0%)
cpu-cycles           54996415778281 # 2.07 GHz
instructions         77038363659819 # 1.40 IPC
l2 access            1914216855761  # 62.810 l2 access per 1000 inst
l2 miss              344524930940   # 18.00% l2 miss
The process tree time mostly concentrated in python code with a large number of parallel threads started, more than the # of cores. Here is a summary of processes started.
470 processes
	105 tf_cnn_benchmar      422684.85  2544.84
	 91 python3              372951.14  2240.24
	 38 vulkaninfo               0.76     1.14
	  6 php                      0.19     0.14
	  4 vulkani:disk$0           0.08     0.12
	  2 llvmpipe-0               0.04     0.06
	  2 llvmpipe-1               0.04     0.06
	  2 llvmpipe-10              0.04     0.06
	  2 llvmpipe-11              0.04     0.06
	  2 llvmpipe-12              0.04     0.06
	  2 llvmpipe-13              0.04     0.06
	  2 llvmpipe-14              0.04     0.06
	  2 llvmpipe-15              0.04     0.06
	  2 llvmpipe-2               0.04     0.06
	  2 llvmpipe-3               0.04     0.06
	  2 llvmpipe-4               0.04     0.06
	  2 llvmpipe-5               0.04     0.06
	  2 llvmpipe-6               0.04     0.06
	  2 llvmpipe-7               0.04     0.06
	  2 llvmpipe-8               0.04     0.06
	  2 llvmpipe-9               0.04     0.06
	  6 clang                    0.03     0.04
	  1 lspci                    0.00     0.04
	 88 sh                       0.00     0.00
	 12 gcc                      0.00     0.00
	 11 gsettings                0.00     0.00
	  9 stty                     0.00     0.00
	  8 stat                     0.00     0.00
	  8 systemd-detect-          0.00     0.00
	  6 llvm-link                0.00     0.00
	  5 glxinfo                  0.00     0.00
	  5 phoronix-test-s          0.00     0.00
	  3 gmain                    0.00     0.00
	  3 tensorflow               0.00     0.00
	  2 dconf worker             0.00     0.00
	  2 grep                     0.00     0.00
	  2 lscpu                    0.00     0.00
	  2 setterm                  0.00     0.00
	  2 uname                    0.00     0.00
	  2 which                    0.00     0.00
	  1 cc                       0.00     0.00
	  1 date                     0.00     0.00
	  1 dirname                  0.00     0.00
	  1 dmesg                    0.00     0.00
	  1 dmidecode                0.00     0.00
	  1 ifconfig                 0.00     0.00
	  1 ip                       0.00     0.00
	  1 lsmod                    0.00     0.00
	  1 mktemp                   0.00     0.00
	  1 ps                       0.00     0.00
	  1 readlink                 0.00     0.00
	  1 realpath                 0.00     0.00
	  1 sed                      0.00     0.00
	  1 sort                     0.00     0.00
	  1 systemctl                0.00     0.00
	  1 template.sh              0.00     0.00
	  1 wc                       0.00     0.00
0 processes running
75 maximum processes
The process tree shows the bulk of time spent in a parallel block with many more threads started than cores
      1915428) tensorflow start=291.21 finish=574.01
        1915429) tf_cnn_benchmar start=291.22 finish=573.63
          1915430) python3 start=291.34 finish=573.62
          1915431) python3 start=291.34 finish=573.62
          1915432) python3 start=291.34 finish=573.62
          1915433) python3 start=291.34 finish=573.62
          1915434) python3 start=291.34 finish=573.62
          1915435) python3 start=291.34 finish=573.62
          1915436) python3 start=291.34 finish=573.62
          1915437) python3 start=291.34 finish=573.62
          1915438) python3 start=291.34 finish=573.62
          1915439) python3 start=291.34 finish=573.62
          1915440) python3 start=291.34 finish=573.62
          1915441) python3 start=291.34 finish=573.62
          1915442) python3 start=291.34 finish=573.62
          1915443) python3 start=291.35 finish=573.62
          1915444) python3 start=291.35 finish=573.62
          1915445) python3 start=291.78 finish=573.63
          1915446) python3 start=291.78 finish=573.63
          1915447) python3 start=291.78 finish=573.63
          1915448) python3 start=291.78 finish=573.63
          1915449) python3 start=291.78 finish=573.63
          1915450) python3 start=291.78 finish=573.63
          1915451) python3 start=291.78 finish=573.63
          1915452) python3 start=291.78 finish=573.63
          1915453) python3 start=291.78 finish=573.63
          1915454) python3 start=291.78 finish=573.63
          1915455) python3 start=291.78 finish=573.63
          1915456) python3 start=291.78 finish=573.63
          1915457) python3 start=291.78 finish=573.63
          1915458) python3 start=291.79 finish=573.63
          1915459) python3 start=291.79 finish=573.63
          1915460) tf_cnn_benchmar start=292.10 finish=573.63
          1915461) tf_cnn_benchmar start=292.10 finish=573.63
          1915462) tf_cnn_benchmar start=292.10 finish=573.63
          1915463) tf_cnn_benchmar start=292.10 finish=573.63
          1915464) tf_cnn_benchmar start=292.10 finish=573.63
          1915465) tf_cnn_benchmar start=292.10 finish=573.63
          1915466) tf_cnn_benchmar start=292.10 finish=573.63
          1915467) tf_cnn_benchmar start=292.10 finish=573.63
          1915468) tf_cnn_benchmar start=292.10 finish=573.63
          1915469) tf_cnn_benchmar start=292.10 finish=573.63
          1915470) tf_cnn_benchmar start=292.10 finish=573.63
          1915471) tf_cnn_benchmar start=292.10 finish=573.63
          1915472) tf_cnn_benchmar start=292.10 finish=573.63
          1915473) tf_cnn_benchmar start=292.10 finish=573.63
          1915474) tf_cnn_benchmar start=292.10 finish=573.63
          1915475) tf_cnn_benchmar start=292.10 finish=573.63
          1915476) tf_cnn_benchmar start=292.10 finish=573.63
          1915477) tf_cnn_benchmar start=292.10 finish=573.63
          1915478) tf_cnn_benchmar start=292.10 finish=573.63
          1915479) tf_cnn_benchmar start=292.10 finish=573.63
          1915480) tf_cnn_benchmar start=292.10 finish=573.63
          1915481) tf_cnn_benchmar start=292.11 finish=573.63
          1915482) tf_cnn_benchmar start=292.11 finish=573.63
          1915483) tf_cnn_benchmar start=292.11 finish=573.63
          1915484) tf_cnn_benchmar start=292.11 finish=573.63
          1915485) tf_cnn_benchmar start=292.11 finish=573.63
          1915486) tf_cnn_benchmar start=292.11 finish=573.63
          1915487) tf_cnn_benchmar start=292.11 finish=573.63
          1915488) tf_cnn_benchmar start=292.11 finish=573.63
          1915489) tf_cnn_benchmar start=292.11 finish=573.63
          1915490) tf_cnn_benchmar start=292.11 finish=573.63
          1915491) tf_cnn_benchmar start=292.11 finish=573.63
          1915492) tf_cnn_benchmar start=292.11 finish=573.63
          1915493) tf_cnn_benchmar start=293.26 finish=293.26