
Tensorflow based engine for inference. There are six different models. With exception of one model, we mostly run on all cores.
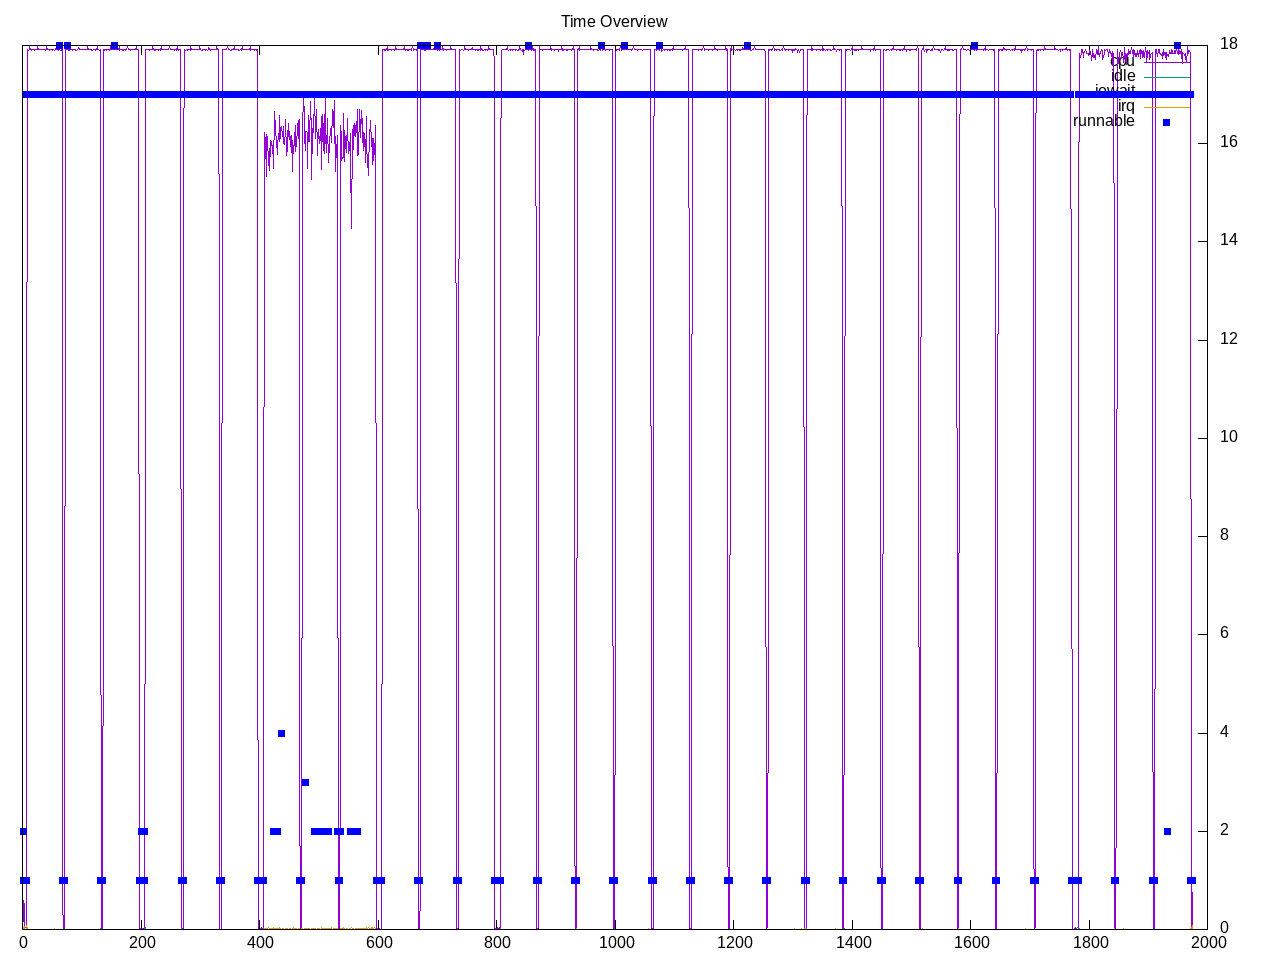
Topdown profile shows most tests are constrained by backend stalls, though to different degrees. Overall frontend stalls are low. This is consistent with tensorflow and ai-benchment, two other workloads using the tensorflow source base.
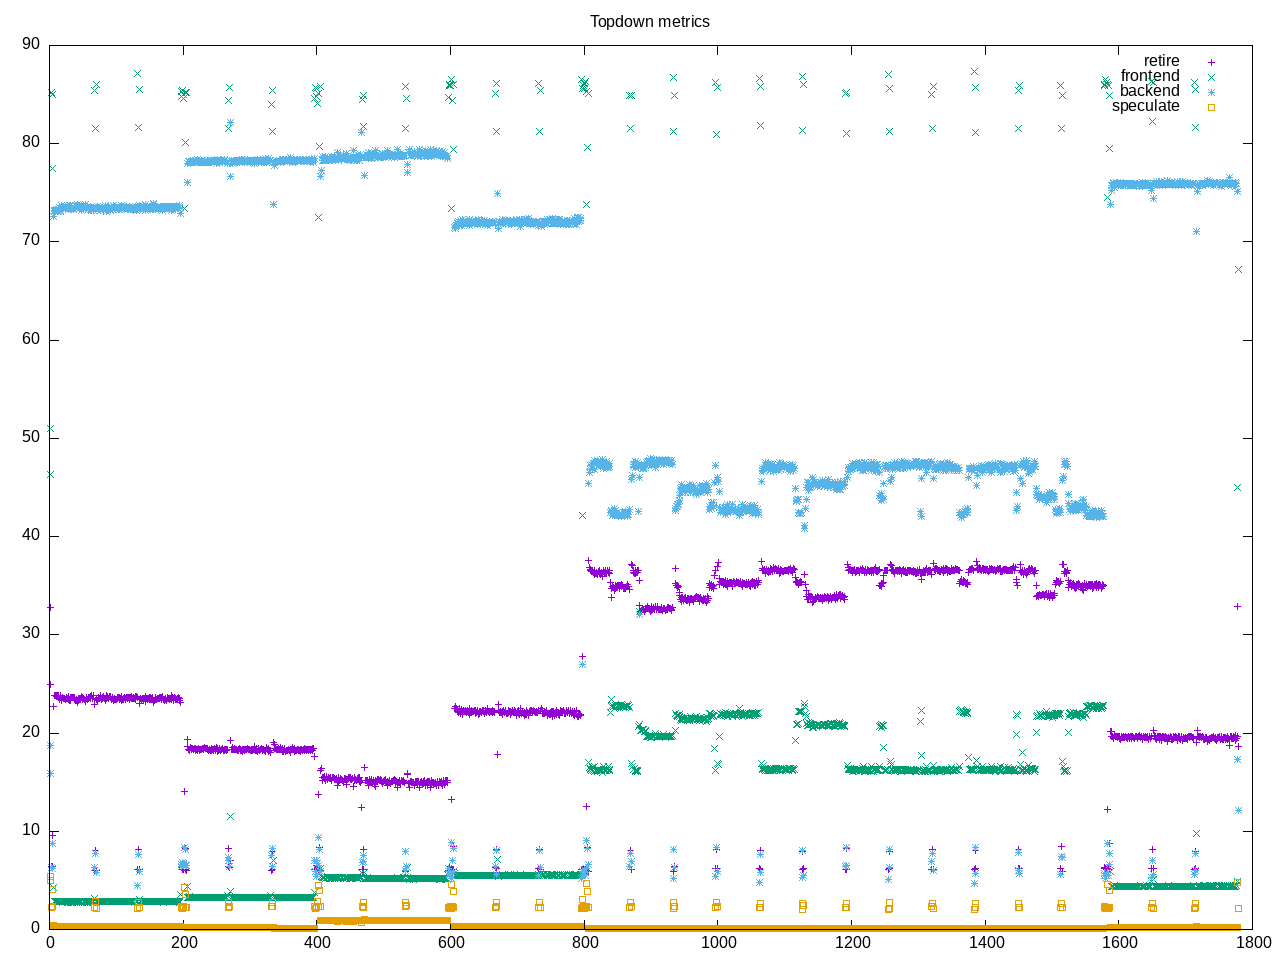
AMD metrics show not much floating point. Backend stalls are more CPU than memory. On-core is most of the 16 cores.
elapsed              1781.202
on_cpu               0.906          # 14.49 / 16 cores
utime                25768.805
stime                46.546
nvcsw                2497631        # 90.04%
nivcsw               276147         # 9.96%
inblock              0              # 0.00/sec
onblock              13600          # 7.64/sec
cpu-clock            25817374390635 # 25817.374 seconds
task-clock           25818707618172 # 25818.708 seconds
page faults          543211         # 21.039/sec
context switches     2782445        # 107.769/sec
cpu migrations       2740           # 0.106/sec
major page faults    402            # 0.016/sec
minor page faults    542809         # 21.024/sec
alignment faults     0              # 0.000/sec
emulation faults     0              # 0.000/sec
branches             8176257999730  # 75.297 branches per 1000 inst
branch misses        18848036907    # 0.23% branch miss
conditional          6168687726909  # 56.809 conditional branches per 1000 inst
indirect             708765353562   # 6.527 indirect branches per 1000 inst
cpu-cycles           66488699011329 # 3.47 GHz
instructions         62700919022287 # 0.94 IPC
slots                132972780453384 #
retiring             20997039894536 # 15.8% (22.3%)
-- ucode             70604174137    #     0.1%
-- fastpath          20926435720399 #    15.7%
frontend             6812430443169  #  5.1% ( 7.2%)
-- latency           4262617441938  #     3.2%
-- bandwidth         2549813001231  #     1.9%
backend              65880605697902 # 49.5% (70.1%) high
-- cpu               43055389397505 #    32.4%
-- memory            22825216300397 #    17.2%
speculation          304512513870   #  0.2% ( 0.3%) low
-- branch mispredict 231994676551   #     0.2%
-- pipeline restart  72517837319    #     0.1%
smt-contention       38978063022358 # 29.3% ( 0.0%)
cpu-cycles           66437980534368 # 3.46 GHz
instructions         62886224269728 # 0.95 IPC
instructions         20963778736844 # 110.104 l2 access per 1000 inst
l2 hit from l1       1484797600488  # 17.09% l2 miss
l2 miss from l1      76449398591    #
l2 hit from l2 pf    505326269978   #
l3 hit from l2 pf    300588021776   #
l3 miss from l2 pf   17475885955    #
instructions         20952703348688 # 88.143 float per 1000 inst
float 512            86             # 0.000 AVX-512 per 1000 inst
float 256            16638293267    # 0.794 AVX-256 per 1000 inst
float 128            1830204124915  # 87.349 AVX-128 per 1000 inst
float MMX            0              # 0.000 MMX per 1000 inst
float scalar         126            # 0.000 scalar per 1000 inst
instructions         2683871        #
opcache              1001419        # 373.125 opcache per 1000 inst
opcache miss         538595         # 53.8% opcache miss rate
l1 dTLB miss         5215           # 1.943 L1 dTLB per 1000 inst
l2 dTLB miss         1072           # 0.399 L2 dTLB per 1000 inst
instructions         2719642        #
icache               1329853        # 488.981 icache per 1000 inst
icache miss          113221         #  8.5% icache miss rate
l1 iTLB miss         13             # 0.005 L1 iTLB per 1000 inst
l2 iTLB miss         0              # 0.000 L2 iTLB per 1000 inst
tlb flush            19             # 0.007 TLB flush per 1000 inst
Intel metrics
elapsed              3505.681
on_cpu               0.900          # 14.41 / 16 cores
utime                50462.029
stime                45.015
nvcsw                3228584        # 86.96%
nivcsw               484151         # 13.04%
inblock              671152         # 191.45/sec
onblock              3288           # 0.94/sec
cpu-clock            50501413499110 # 50501.413 seconds
task-clock           50502962043307 # 50502.962 seconds
page faults          1267501        # 25.098/sec
context switches     3729982        # 73.857/sec
cpu migrations       20244          # 0.401/sec
major page faults    5621           # 0.111/sec
minor page faults    1261880        # 24.986/sec
alignment faults     0              # 0.000/sec
emulation faults     0              # 0.000/sec
branches             7113178270992  # 42.878 branches per 1000 inst
branch misses        33305181988    # 0.47% branch miss
conditional          7113178311760  # 42.878 conditional branches per 1000 inst
indirect             2612548769133  # 15.748 indirect branches per 1000 inst
slots                195950194535378 #
retiring             60251227935729 # 30.7% (30.7%)
-- ucode             2905514460597  #     1.5%
-- fastpath          57345713475132 #    29.3%
frontend             15083119217621 #  7.7% ( 7.7%)
-- latency           11672569239183 #     6.0%
-- bandwidth         3410549978438  #     1.7%
backend              120615883054053 # 61.6% (61.6%)
-- cpu               102213139192031 #    52.2%
-- memory            18402743862022 #     9.4%
speculation          1161461077519  #  0.6% ( 0.6%) low
-- branch mispredict 1029624209035  #     0.5%
-- pipeline restart  131836868484   #     0.1%
smt-contention       0              #  0.0% ( 0.0%)
cpu-cycles           90788972703168 # 2.18 GHz
instructions         100133205361729 # 1.10 IPC
l2 access            2519301193908  # 41.427 l2 access per 1000 inst
l2 miss              695926152907   # 27.62% l2 miss
cpu-cycles           58978337968420 # 21.4% memory latency
load stalls          12514222603573 # 12.5% l1 bound
l1 miss              5158405253880  #  3.4% l2 bound
l2 miss              3175529755484  #  4.3% l3 bound
l3 miss              641250892911   #  1.1% dram bound
store_stalls         100727600884   #  0.2% store bound
Process summary
814 processes
	432 linux_x86-64_be      412501.71   546.44
	 68 clinfo                  17.52     4.67
	 38 vulkaninfo               1.13     1.14
	  6 php                      0.16     0.27
	  4 vulkani:disk$0           0.12     0.12
	  6 glxinfo:gdrv0            0.09     0.04
	  6 glxinfo:gl0              0.09     0.04
	  2 llvmpipe-0               0.06     0.06
	  2 llvmpipe-1               0.06     0.06
	  2 llvmpipe-10              0.06     0.06
	  2 llvmpipe-11              0.06     0.06
	  2 llvmpipe-12              0.06     0.06
	  2 llvmpipe-13              0.06     0.06
	  2 llvmpipe-14              0.06     0.06
	  2 llvmpipe-15              0.06     0.06
	  2 llvmpipe-2               0.06     0.06
	  2 llvmpipe-3               0.06     0.06
	  2 llvmpipe-4               0.06     0.06
	  2 llvmpipe-5               0.06     0.06
	  2 llvmpipe-6               0.06     0.06
	  2 llvmpipe-7               0.06     0.06
	  2 llvmpipe-8               0.06     0.06
	  2 llvmpipe-9               0.06     0.06
	  2 glxinfo                  0.06     0.02
	  2 glxinfo:cs0              0.06     0.02
	  2 glxinfo:disk$0           0.06     0.02
	  2 glxinfo:sh0              0.05     0.02
	  2 glxinfo:shlo0            0.05     0.02
	  6 clang                    0.03     0.09
	  3 rocminfo                 0.03     0.00
	  1 lspci                    0.00     0.02
	  1 ps                       0.00     0.01
	 91 sh                       0.00     0.00
	 27 tensorflow-lite          0.00     0.00
	 12 gcc                      0.00     0.00
	 10 gsettings                0.00     0.00
	  8 stat                     0.00     0.00
	  8 systemd-detect-          0.00     0.00
	  6 llvm-link                0.00     0.00
	  5 phoronix-test-s          0.00     0.00
	  4 gmain                    0.00     0.00
	  2 dconf worker             0.00     0.00
	  2 lscpu                    0.00     0.00
	  2 uname                    0.00     0.00
	  2 which                    0.00     0.00
	  2 xset                     0.00     0.00
	  1 cc                       0.00     0.00
	  1 date                     0.00     0.00
	  1 dirname                  0.00     0.00
	  1 dmesg                    0.00     0.00
	  1 dmidecode                0.00     0.00
	  1 grep                     0.00     0.00
	  1 ifconfig                 0.00     0.00
	  1 ip                       0.00     0.00
	  1 lsmod                    0.00     0.00
	  1 mktemp                   0.00     0.00
	  1 qdbus                    0.00     0.00
	  1 readlink                 0.00     0.00
	  1 realpath                 0.00     0.00
	  1 sed                      0.00     0.00
	  1 sort                     0.00     0.00
	  1 stty                     0.00     0.00
	  1 systemctl                0.00     0.00
	  1 template.sh              0.00     0.00
	  1 wc                       0.00     0.00
	  1 xrandr                   0.00     0.00
0 processes running
47 maximum processes
Core computation blocks start one process on each core
      233538) tensorflow-lite  cpu=13 start=5.82  finish=66.34
        233539) linux_x86-64_be  cpu=0 start=5.82  finish=66.34
          233540) linux_x86-64_be  cpu=11 start=5.83  finish=66.34
          233541) linux_x86-64_be  cpu=4 start=5.83  finish=66.34
          233542) linux_x86-64_be  cpu=6 start=5.83  finish=66.34
          233543) linux_x86-64_be  cpu=2 start=5.83  finish=66.34
          233544) linux_x86-64_be  cpu=1 start=5.83  finish=66.34
          233545) linux_x86-64_be  cpu=5 start=5.83  finish=66.34
          233546) linux_x86-64_be  cpu=7 start=5.83  finish=66.34
          233547) linux_x86-64_be  cpu=8 start=5.83  finish=66.34
          233548) linux_x86-64_be  cpu=14 start=5.83  finish=66.34
          233549) linux_x86-64_be  cpu=10 start=5.83  finish=66.34
          233550) linux_x86-64_be  cpu=3 start=5.83  finish=66.34
          233551) linux_x86-64_be  cpu=12 start=5.83  finish=66.34
          233552) linux_x86-64_be  cpu=9 start=5.83  finish=66.34
          233553) linux_x86-64_be  cpu=13 start=5.83  finish=66.34
          233554) linux_x86-64_be  cpu=15 start=5.83  finish=66.34