
A C++ implementation of OpenAI Whisper model for audio transcription. Three different models are used to transcribe the same audio file. Looks like the workload runs in parallel on half the cores. The AMD processor does over 2.5x faster overall on this workload.
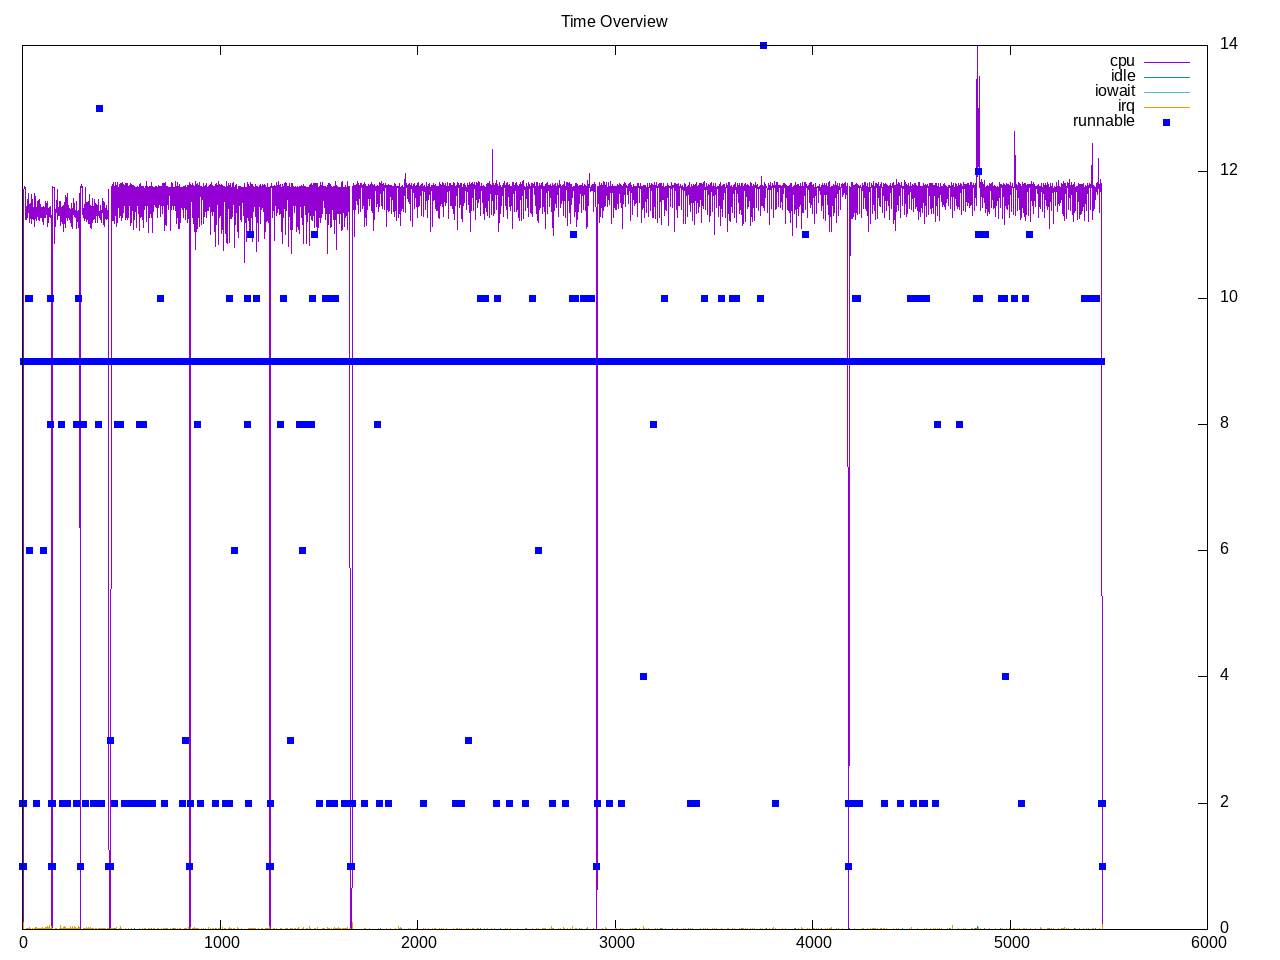
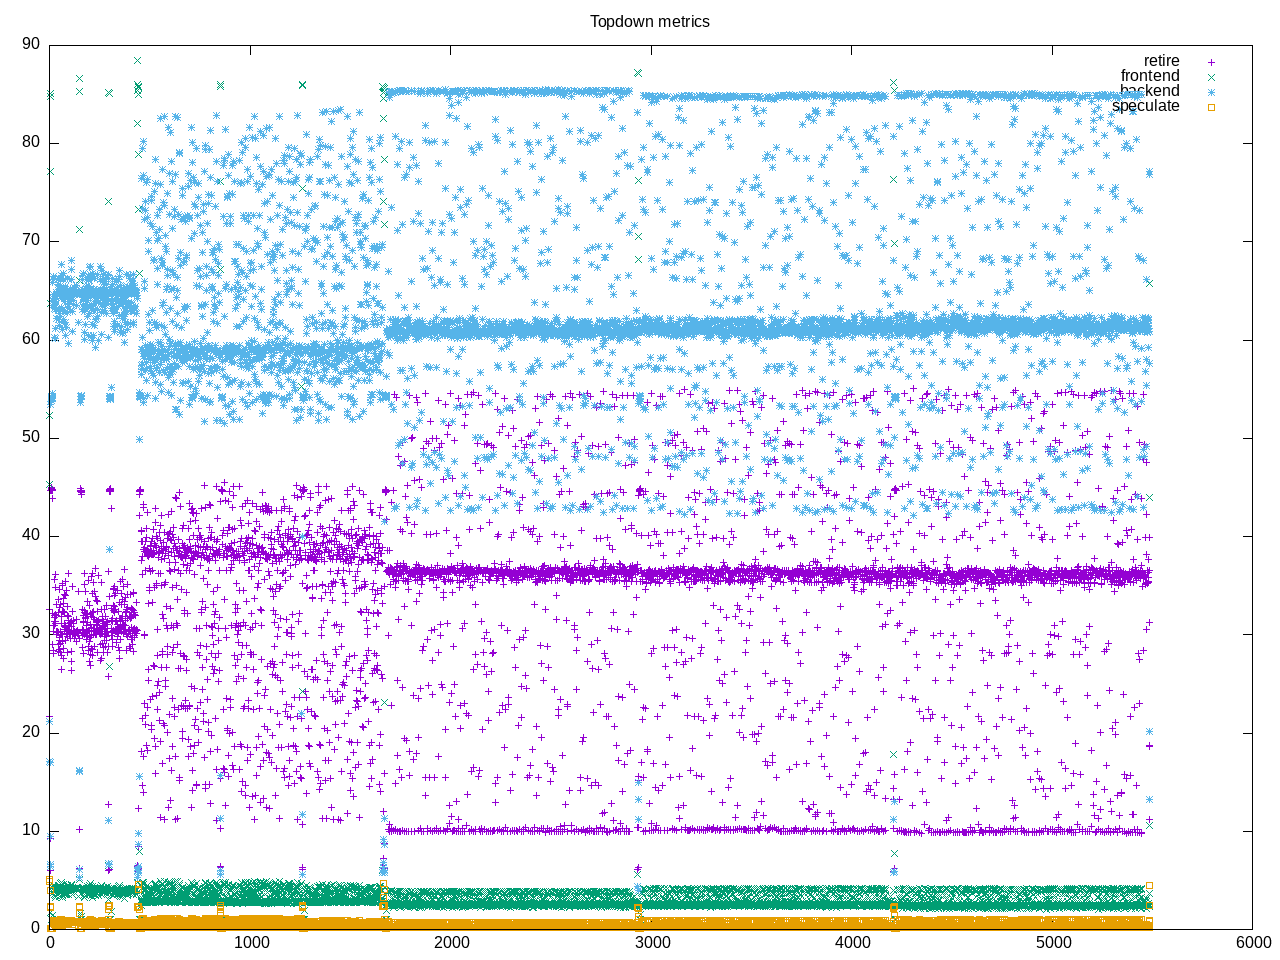
Topdown profile shows it is dominated by backend stalls and that frontend stalls are low. A very similar profile is found with llama.cpp – written by the same author.
AMD profile shows half the cores busy. There is some floating point, though not as much as other fp codes. There are reasonable number of L2 misses.
elapsed              5530.727
on_cpu               0.475          # 7.60 / 16 cores
utime                41948.223
stime                74.837
nvcsw                88182          # 21.69%
nivcsw               318356         # 78.31%
inblock              121448         # 21.96/sec
onblock              39528          # 7.15/sec
cpu-clock            43185206747693 # 43185.207 seconds
task-clock           43185307800638 # 43185.308 seconds
page faults          4596579        # 106.438/sec
context switches     433591         # 10.040/sec
cpu migrations       66000          # 1.528/sec
major page faults    3              # 0.000/sec
minor page faults    4596576        # 106.438/sec
alignment faults     0              # 0.000/sec
emulation faults     0              # 0.000/sec
branches             43085660001008 # 117.442 branches per 1000 inst
branch misses        37668494486    # 0.09% branch miss
conditional          42866388416712 # 116.844 conditional branches per 1000 inst
indirect             45204891247    # 0.123 indirect branches per 1000 inst
cpu-cycles           170523008924934 # 1.93 GHz
instructions         360130923953209 # 2.11 IPC
slots                353078813046786 #
retiring             114261747623360 # 32.4% (32.4%)
-- ucode             687310766168   #     0.2%
-- fastpath          113574436857192 #    32.2%
frontend             10740260701037 #  3.0% ( 3.0%) low
-- latency           5933745440010  #     1.7%
-- bandwidth         4806515261027  #     1.4%
backend              226502059685765 # 64.2% (64.2%)
-- cpu               54930607366266 #    15.6%
-- memory            171571452319499 #    48.6%
speculation          1399502085660  #  0.4% ( 0.4%) low
-- branch mispredict 911735370202   #     0.3%
-- pipeline restart  487766715458   #     0.1%
smt-contention       175114447106   #  0.0% ( 0.0%)
cpu-cycles           170419137834019 # 1.93 GHz
instructions         360038148851712 # 2.11 IPC
instructions         122240539336491 # 78.098 l2 access per 1000 inst
l2 hit from l1       5310074428252  # 39.15% l2 miss
l2 miss from l1      207073886950   #
l2 hit from l2 pf    705880443601   #
l3 hit from l2 pf    3106777843787  #
l3 miss from l2 pf   424027854896   #
instructions         122178608709053 # 66.991 float per 1000 inst
float 512            75             # 0.000 AVX-512 per 1000 inst
float 256            672            # 0.000 AVX-256 per 1000 inst
float 128            8184827126616  # 66.991 AVX-128 per 1000 inst
float MMX            0              # 0.000 MMX per 1000 inst
float scalar         0              # 0.000 scalar per 1000 inst
Intel metrics
elapsed              14368.253
on_cpu               0.730          # 11.68 / 16 cores
utime                167717.180
stime                147.268
nvcsw                97481          # 10.82%
nivcsw               803547         # 89.18%
inblock              6863912        # 477.71/sec
onblock              25736          # 1.79/sec
cpu-clock            169666851070848 # 169666.851 seconds
task-clock           169668782732666 # 169668.783 seconds
page faults          5269925        # 31.060/sec
context switches     970642         # 5.721/sec
cpu migrations       262405         # 1.547/sec
major page faults    33             # 0.000/sec
minor page faults    5269892        # 31.060/sec
alignment faults     0              # 0.000/sec
emulation faults     0              # 0.000/sec
branches             227128281463420 # 208.515 branches per 1000 inst
branch misses        29121652723    # 0.01% branch miss
conditional          227128311572956 # 208.515 conditional branches per 1000 ins
t
indirect             22920041459410 # 21.042 indirect branches per 1000 inst
slots                1150135161525986 #
retiring             651783482407376 # 56.7% (56.7%) high
-- ucode             4936987792977  #     0.4%
-- fastpath          646846494614399 #    56.2%
frontend             16180417417749 #  1.4% ( 1.4%) low
-- latency           8941995996169  #     0.8%
-- bandwidth         7238421421580  #     0.6%
backend              479717990945457 # 41.7% (41.7%)
-- cpu               383188217770082 #    33.3%
-- memory            96529773175375 #     8.4%
speculation          2980965978192  #  0.3% ( 0.3%) low
-- branch mispredict 657433004912   #     0.1%
-- pipeline restart  2323532973280  #     0.2%
smt-contention       0              #  0.0% ( 0.0%)
cpu-cycles           245659047612452 # 1.06 GHz
instructions         1011662256267344 # 4.12 IPC high
l2 access            8328352125465  # 10.041 l2 access per 1000 inst
l2 miss              4426583244304  # 53.15% l2 miss
The process profile includes almost 500,000 processes.
496963 processes
	496713 main                 1507285.76 2012754.91
	 34 clinfo                   9.26     3.99
	 19 vulkaninfo               0.76     0.57
	  2 vulkani:disk$0           0.08     0.06
	  6 clang                    0.05     0.07
	  3 glxinfo:gdrv0            0.05     0.06
	  3 glxinfo:gl0              0.05     0.06
	  1 llvmpipe-0               0.04     0.03
	  1 llvmpipe-1               0.04     0.03
	  1 llvmpipe-10              0.04     0.03
	  1 llvmpipe-11              0.04     0.03
	  1 llvmpipe-12              0.04     0.03
	  1 llvmpipe-13              0.04     0.03
	  1 llvmpipe-14              0.04     0.03
	  1 llvmpipe-15              0.04     0.03
	  1 llvmpipe-2               0.04     0.03
	  1 llvmpipe-3               0.04     0.03
	  1 llvmpipe-4               0.04     0.03
	  1 llvmpipe-5               0.04     0.03
	  1 llvmpipe-6               0.04     0.03
	  1 llvmpipe-7               0.04     0.03
	  1 llvmpipe-8               0.04     0.03
	  1 llvmpipe-9               0.04     0.03
	  1 glxinfo                  0.03     0.02
	  1 glxinfo:cs0              0.03     0.02
	  1 glxinfo:disk$0           0.03     0.02
	  1 glxinfo:sh0              0.03     0.02
	  1 glxinfo:shlo0            0.03     0.02
	  1 ps                       0.00     0.01
	 62 sh                       0.00     0.00
	 13 gcc                      0.00     0.00
	 11 gsettings                0.00     0.00
	  8 systemd-detect-          0.00     0.00
	  7 stat                     0.00     0.00
	  7 whisper-cpp              0.00     0.00
	  6 llvm-link                0.00     0.00
	  4 phoronix-test-s          0.00     0.00
	  3 gmain                    0.00     0.00
	  2 which                    0.00     0.00
	  1 cc                       0.00     0.00
	  1 date                     0.00     0.00
	  1 dconf worker             0.00     0.00
	  1 dirname                  0.00     0.00
	  1 grep                     0.00     0.00
	  1 ifconfig                 0.00     0.00
	  1 ip                       0.00     0.00
	  1 lscpu                    0.00     0.00
	  1 mktemp                   0.00     0.00
	  1 qdbus                    0.00     0.00
	  1 readlink                 0.00     0.00
	  1 realpath                 0.00     0.00
	  1 sed                      0.00     0.00
	  1 sort                     0.00     0.00
	  1 stty                     0.00     0.00
	  1 systemctl                0.00     0.00
	  1 template.sh              0.00     0.00
	  1 wc                       0.00     0.00
	  1 xrandr                   0.00     0.00
	  1 xset                     0.00     0.00
18 processes running
47 maximum processes