
Audio to text translation using the OpenAI Whisper model and Whisper.cpp. Runs mostly on physical cores. There are three workloads: tiny, small and medium.
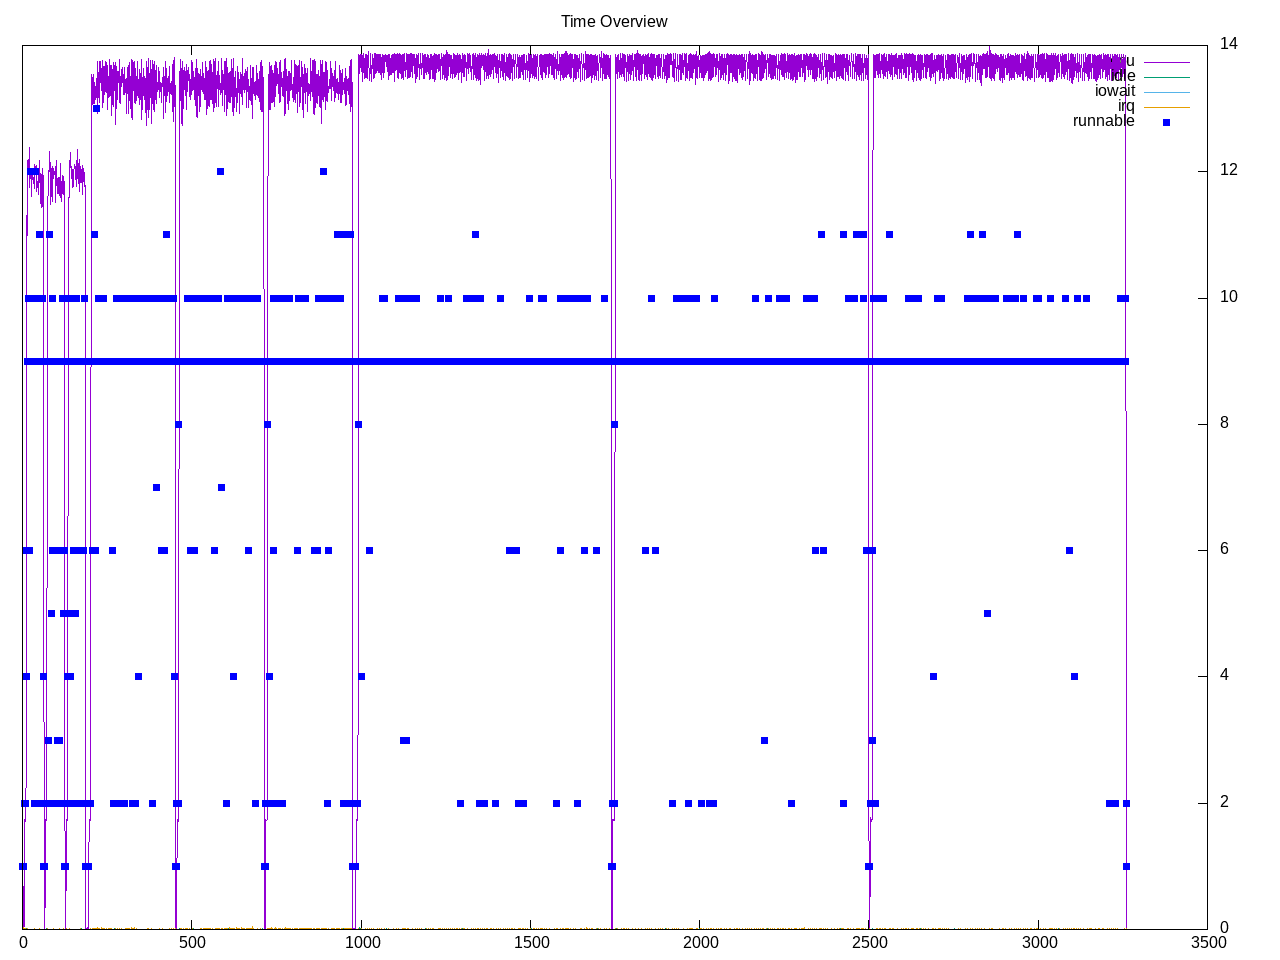
Topdown profile is dominated by backend stalls with not much frontend stalls.

AMD metrics confirm a backend bound application with twice as many memory stalls as CPU stalls. Frontend stalls are also very low.
elapsed              3281.110
on_cpu               0.469          # 7.50 / 16 cores
utime                24529.851
stime                71.720
nvcsw                789353         # 67.13%
nivcsw               386482         # 32.87%
inblock              272            # 0.08/sec
onblock              2000952        # 609.84/sec
cpu-clock            24748102587968 # 24748.103 seconds
task-clock           24748961686997 # 24748.962 seconds
page faults          11397536       # 460.526/sec
context switches     1191423        # 48.140/sec
cpu migrations       32105          # 1.297/sec
major page faults    2              # 0.000/sec
minor page faults    11397534       # 460.526/sec
alignment faults     0              # 0.000/sec
emulation faults     0              # 0.000/sec
branches             4572575710604  # 46.718 branches per 1000 inst
branch misses        14777271136    # 0.32% branch miss
conditional          4115973292256  # 42.053 conditional branches per 1000 inst
indirect             17517967739    # 0.179 indirect branches per 1000 inst
cpu-cycles           102097628650614 # 1.94 GHz
instructions         97507810361983 # 0.96 IPC
slots                205099946303142 #
retiring             37214286254367 # 18.1% (18.2%)
-- ucode             48968915545    #     0.0%
-- fastpath          37165317338822 #    18.1%
frontend             4284690737113  #  2.1% ( 2.1%) low
-- latency           3315556843362  #     1.6%
-- bandwidth         969133893751   #     0.5%
backend              162775146273176 # 79.4% (79.4%) high
-- cpu               47232427007135 #    23.0%
-- memory            115542719266041 #    56.3%
speculation          616667516467   #  0.3% ( 0.3%) low
-- branch mispredict 409532861682   #     0.2%
-- pipeline restart  207134654785   #     0.1%
smt-contention       209032937338   #  0.1% ( 0.0%)
cpu-cycles           101963426481978 # 1.94 GHz
instructions         97517015919776 # 0.96 IPC
instructions         32634325078974 # 131.264 l2 access per 1000 inst
l2 hit from l1       2265760655143  # 24.68% l2 miss
l2 miss from l1      283693287681   #
l2 hit from l2 pf    1244526315275  #
l3 hit from l2 pf    667413553522   #
l3 miss from l2 pf   106025961425   #
instructions         32607938489954 # 134.540 float per 1000 inst
float 512            76             # 0.000 AVX-512 per 1000 inst
float 256            637404         # 0.000 AVX-256 per 1000 inst
float 128            4387069981977  # 134.540 AVX-128 per 1000 inst
float MMX            0              # 0.000 MMX per 1000 inst
float scalar         0              # 0.000 scalar per 1000 inst
instructions         97825072073572 #
opcache              11470979872220 # 117.260 opcache per 1000 inst
opcache miss         293294675378   #  2.6% opcache miss rate
l1 dTLB miss         448855689540   # 4.588 L1 dTLB per 1000 inst
l2 dTLB miss         48011900496    # 0.491 L2 dTLB per 1000 inst
instructions         97843884531235 #
icache               458280019597   # 4.684 icache per 1000 inst
icache miss          76535669308    # 16.7% icache miss rate
l1 iTLB miss         35830986       # 0.000 L1 iTLB per 1000 inst
l2 iTLB miss         0              # 0.000 L2 iTLB per 1000 inst
tlb flush            676808         # 0.000 TLB flush per 1000 inst
Intel metrics show most memory stalls at the L2 level.
elapsed              6401.384
on_cpu               0.241          # 3.85 / 16 cores
utime                24581.149
stime                58.903
nvcsw                554296         # 80.38%
nivcsw               135330         # 19.62%
inblock              1965872        # 307.10/sec
onblock              1992264        # 311.22/sec
cpu-clock            24794386618554 # 24794.387 seconds
task-clock           24795763519490 # 24795.764 seconds
page faults          7532655        # 303.788/sec
context switches     720042         # 29.039/sec
cpu migrations       94201          # 3.799/sec
major page faults    91             # 0.004/sec
minor page faults    7532564        # 303.784/sec
alignment faults     0              # 0.000/sec
emulation faults     0              # 0.000/sec
branches             10341718642383 # 54.805 branches per 1000 inst
branch misses        9565794658     # 0.09% branch miss
conditional          10341734517295 # 54.805 conditional branches per 1000 inst
indirect             156368123592   # 0.829 indirect branches per 1000 inst
slots                532475805237926 #
retiring             251720082877249 # 47.3% (47.3%)
-- ucode             45341165034866 #     8.5%
-- fastpath          206378917842383 #    38.8%
frontend             39863638341533 #  7.5% ( 7.5%)
-- latency           2430803551860  #     0.5%
-- bandwidth         37432834789673 #     7.0%
backend              239695063602645 # 45.0% (45.0%)
-- cpu               184700781665297 #    34.7%
-- memory            54994281937348 #    10.3%
speculation          2347427794172  #  0.4% ( 0.4%) low
-- branch mispredict 826280176476   #     0.2%
-- pipeline restart  1521147617696  #     0.3%
smt-contention       0              #  0.0% ( 0.0%)
cpu-cycles           89422295522279 # 0.87 GHz
instructions         188568355555583 # 2.11 IPC
l2 access            9948057087090  # 53.102 l2 access per 1000 inst
l2 miss              4720943665861  # 47.46% l2 miss
cpu-cycles           88972264948894 # 18.1% memory latency
load stalls          15534009333939 #  0.0% l1 bound
l1 miss              35174852346207 # 24.3% l2 bound
l2 miss              13537304518777 #  5.0% l3 bound
l3 miss              9109399710512  # 10.2% dram bound
store_stalls         533063233128   #  0.6% store bound
Process summary shows almost all time in a .ape-1.10 program with many processes launched
651721 processes
	648384 .ape-1.10            16390354.57 2833993.32
	 36 clinfo                   4.10     2.25
	 38 vulkaninfo               1.33     0.96
	  6 php                      0.15     0.89
	  4 vulkani:disk$0           0.14     0.11
	  2 llvmpipe-0               0.07     0.05
	  2 llvmpipe-1               0.07     0.05
	  2 llvmpipe-10              0.07     0.05
	  2 llvmpipe-11              0.07     0.05
	  2 llvmpipe-12              0.07     0.05
	  2 llvmpipe-13              0.07     0.05
	  2 llvmpipe-14              0.07     0.05
	  2 llvmpipe-15              0.07     0.05
	  2 llvmpipe-2               0.07     0.05
	  2 llvmpipe-3               0.07     0.05
	  2 llvmpipe-4               0.07     0.05
	  2 llvmpipe-5               0.07     0.05
	  2 llvmpipe-6               0.07     0.05
	  2 llvmpipe-7               0.07     0.05
	  2 llvmpipe-8               0.07     0.05
	  2 llvmpipe-9               0.07     0.05
	  6 clang                    0.06     0.06
	  3 rocminfo                 0.03     0.00
	  1 lspci                    0.00     0.02
	  1 ps                       0.00     0.01
	 97 sh                       0.00     0.00
	 12 gcc                      0.00     0.00
	  9 whisperfile              0.00     0.00
	  8 gsettings                0.00     0.00
	  8 stat                     0.00     0.00
	  8 systemd-detect-          0.00     0.00
	  6 llvm-link                0.00     0.00
	  5 glxinfo                  0.00     0.00
	  5 gmain                    0.00     0.00
	  5 phoronix-test-s          0.00     0.00
	  3 dconf worker             0.00     0.00
	  2 dmesg                    0.00     0.00
	  2 grep                     0.00     0.00
	  2 lscpu                    0.00     0.00
	  2 setterm                  0.00     0.00
	  2 uname                    0.00     0.00
	  2 which                    0.00     0.00
	  1 cc                       0.00     0.00
	  1 date                     0.00     0.00
	  1 dirname                  0.00     0.00
	  1 dmidecode                0.00     0.00
	  1 ifconfig                 0.00     0.00
	  1 ip                       0.00     0.00
	  1 lsmod                    0.00     0.00
	  1 mktemp                   0.00     0.00
	  1 qdbus                    0.00     0.00
	  1 readlink                 0.00     0.00
	  1 realpath                 0.00     0.00
	  1 sed                      0.00     0.00
	  1 sort                     0.00     0.00
	  1 stty                     0.00     0.00
	  1 systemctl                0.00     0.00
	  1 template.sh              0.00     0.00
	  1 wc                       0.00     0.00
3015 processes running
3062 maximum processes