
Google library for high efficiency floating-point neural network inference operators. Used by other frameworks. There is a sequence of nine operations. These run on all cores.
Topdown profile shows mostly backend bound but a mix among the operations.
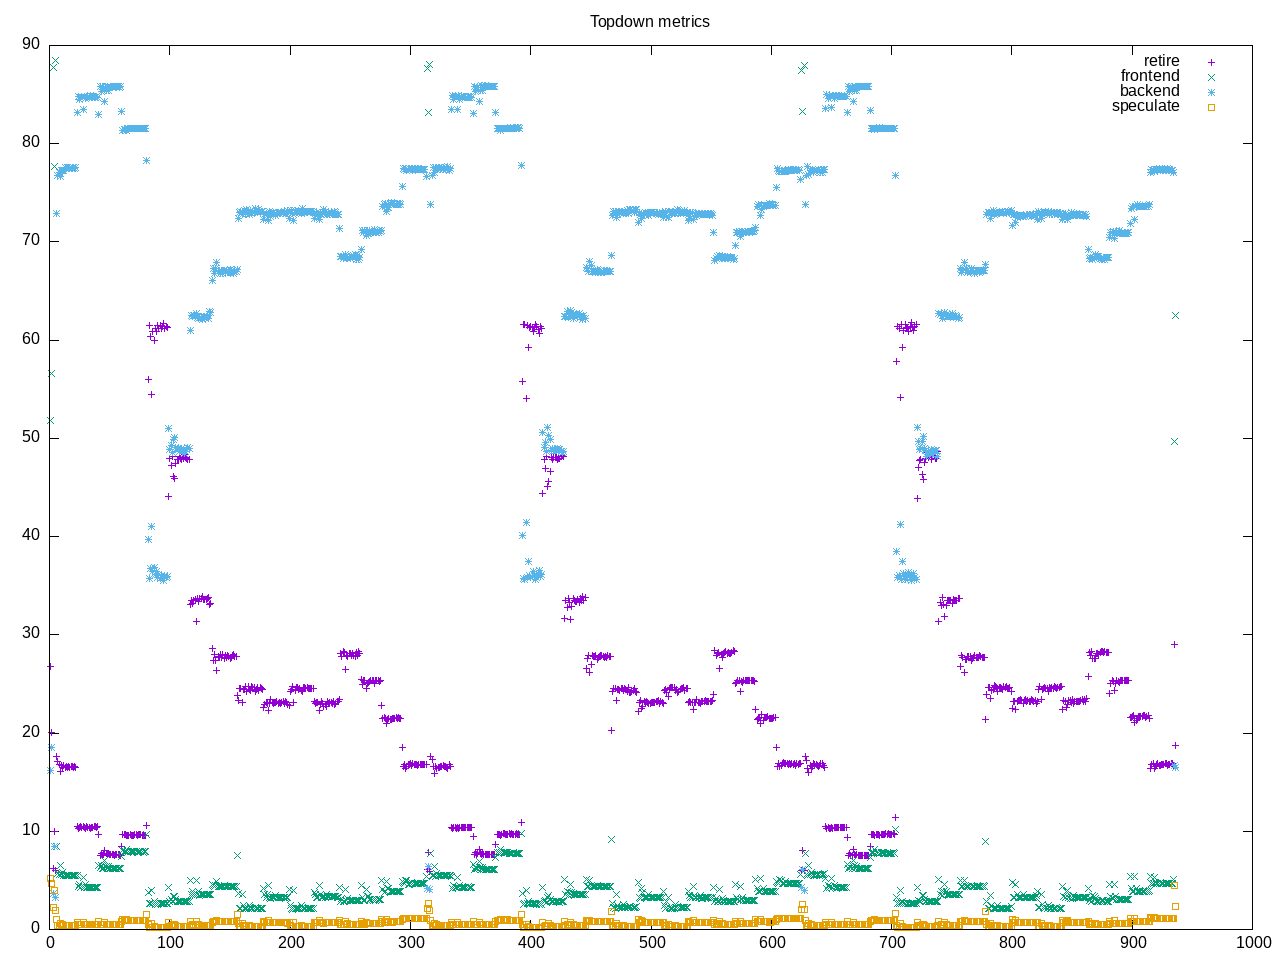
AMD metrics show backend stalls averaging 71% and split between memory and core. The frontend and speculation stalls are small. There is a moderate amount of floating point.
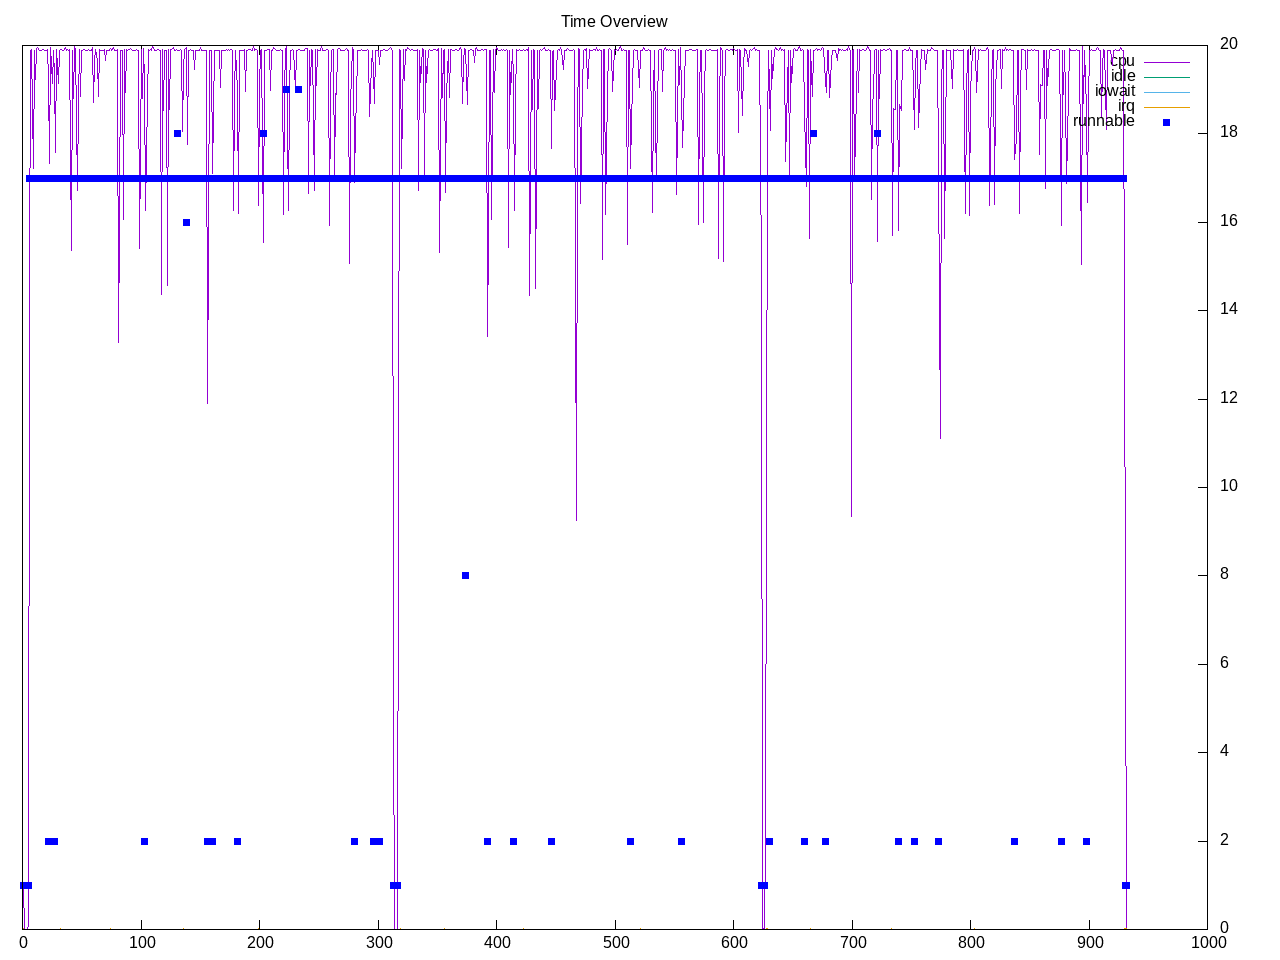
elapsed              931.826
on_cpu               0.959          # 15.34 / 16 cores
utime                14257.581
stime                33.219
nvcsw                10099          # 9.45%
nivcsw               96767          # 90.55%
inblock              8              # 0.01/sec
onblock              17472          # 18.75/sec
cpu-clock            14294818899155 # 14294.819 seconds
task-clock           14294890468287 # 14294.890 seconds
page faults          944654         # 66.083/sec
context switches     111341         # 7.789/sec
cpu migrations       285            # 0.020/sec
major page faults    2              # 0.000/sec
minor page faults    944652         # 66.083/sec
alignment faults     0              # 0.000/sec
emulation faults     0              # 0.000/sec
branches             2082975726202  # 39.545 branches per 1000 inst
branch misses        15827594675    # 0.76% branch miss
conditional          1918405492130  # 36.420 conditional branches per 1000 inst
indirect             38210190153    # 0.725 indirect branches per 1000 inst
cpu-cycles           56773076641271 # 3.81 GHz
instructions         52309348452668 # 0.92 IPC
slots                113599063615566 #
retiring             19097588418675 # 16.8% (23.5%)
-- ucode             66616981438    #     0.1%
-- fastpath          19030971437237 #    16.8%
frontend             3440658672312  #  3.0% ( 4.2%) low
-- latency           1913602394898  #     1.7%
-- bandwidth         1527056277414  #     1.3%
backend              58361692315514 # 51.4% (71.7%) high
-- cpu               28346810089652 #    25.0%
-- memory            30014882225862 #    26.4%
speculation          497091553516   #  0.4% ( 0.6%) low
-- branch mispredict 310968324668   #     0.3%
-- pipeline restart  186123228848   #     0.2%
smt-contention       32201569235059 # 28.3% ( 0.0%)
cpu-cycles           57035182888061 # 3.81 GHz
instructions         52381979244633 # 0.92 IPC
instructions         17467779825069 # 61.298 l2 access per 1000 inst
l2 hit from l1       659001928214   # 26.58% l2 miss
l2 miss from l1      71983136525    #
l2 hit from l2 pf    199094421089   #
l3 hit from l2 pf    195194100072   #
l3 miss from l2 pf   17449215935    #
instructions         17446199487461 # 72.488 float per 1000 inst
float 512            62             # 0.000 AVX-512 per 1000 inst
float 256            10591429521    # 0.607 AVX-256 per 1000 inst
float 128            1254051102509  # 71.881 AVX-128 per 1000 inst
float MMX            0              # 0.000 MMX per 1000 inst
float scalar         112            # 0.000 scalar per 1000 inst
instructions         52817290218833 #
opcache              5292338275116  # 100.201 opcache per 1000 inst
opcache miss         117763496128   #  2.2% opcache miss rate
l1 dTLB miss         23326497562    # 0.442 L1 dTLB per 1000 inst
l2 dTLB miss         4634341166     # 0.088 L2 dTLB per 1000 inst
instructions         52695988373276 #
icache               164780128406   # 3.127 icache per 1000 inst
icache miss          20642440619    # 12.5% icache miss rate
l1 iTLB miss         7388292        # 0.000 L1 iTLB per 1000 inst
l2 iTLB miss         0              # 0.000 L2 iTLB per 1000 inst
tlb flush            70176          # 0.000 TLB flush per 1000 inst
Intel metrics show largest percentage of memory stalls are L1 and then L3.
elapsed              970.960
on_cpu               0.954          # 15.26 / 16 cores
utime                14796.665
stime                16.394
nvcsw                8948           # 1.51%
nivcsw               582911         # 98.49%
inblock              392            # 0.40/sec
onblock              5968           # 6.15/sec
cpu-clock            14816772460134 # 14816.772 seconds
task-clock           14816918352865 # 14816.918 seconds
page faults          792902         # 53.513/sec
context switches     596500         # 40.258/sec
cpu migrations       5685           # 0.384/sec
major page faults    0              # 0.000/sec
minor page faults    792902         # 53.513/sec
alignment faults     0              # 0.000/sec
emulation faults     0              # 0.000/sec
branches             1460766975019  # 36.514 branches per 1000 inst
branch misses        9973175448     # 0.68% branch miss
conditional          1460767229579  # 36.514 conditional branches per 1000 inst
indirect             486302274617   # 12.156 indirect branches per 1000 inst
slots                70348736732066 #
retiring             26079489676296 # 37.1% (37.1%)
-- ucode             3101142779251  #     4.4%
-- fastpath          22978346897045 #    32.7%
frontend             8773456230690  # 12.5% (12.5%)
-- latency           7397857194056  #    10.5%
-- bandwidth         1375599036634  #     2.0%
backend              34824709912208 # 49.5% (49.5%)
-- cpu               19735277735638 #    28.1%
-- memory            15089432176570 #    21.4%
speculation          696075894965   #  1.0% ( 1.0%) low
-- branch mispredict 600904200955   #     0.9%
-- pipeline restart  95171694010    #     0.1%
smt-contention       0              #  0.0% ( 0.0%)
cpu-cycles           70960300997299 # 1.54 GHz
instructions         71462354213740 # 1.01 IPC
l2 access            1915667603277  # 27.541 l2 access per 1000 inst
l2 miss              749955564088   # 39.15% l2 miss
cpu-cycles           23457104488956 # 31.0% memory latency
load stalls          7146853814664  # 16.1% l1 bound
l1 miss              3377786328787  #  2.6% l2 bound
l2 miss              2773148184220  #  9.9% l3 bound
l3 miss              451171967163   #  1.9% dram bound
store_stalls         125913079992   #  0.5% store bound
Process profile shows most time spent in an end2end-bench driver with ~8000 invocations
8439 processes
	8133 end2end-bench        18530586.84 38821.55
	 36 clinfo                   4.11     2.24
	 38 vulkaninfo               1.32     1.14
	  4 vulkani:disk$0           0.14     0.12
	  6 php                      0.09     0.12
	  2 llvmpipe-0               0.07     0.06
	  2 llvmpipe-1               0.07     0.06
	  2 llvmpipe-10              0.07     0.06
	  2 llvmpipe-11              0.07     0.06
	  2 llvmpipe-12              0.07     0.06
	  2 llvmpipe-13              0.07     0.06
	  2 llvmpipe-14              0.07     0.06
	  2 llvmpipe-15              0.07     0.06
	  2 llvmpipe-2               0.07     0.06
	  2 llvmpipe-3               0.07     0.06
	  2 llvmpipe-4               0.07     0.06
	  2 llvmpipe-5               0.07     0.06
	  2 llvmpipe-6               0.07     0.06
	  2 llvmpipe-7               0.07     0.06
	  2 llvmpipe-8               0.07     0.06
	  2 llvmpipe-9               0.07     0.06
	  6 clang                    0.06     0.06
	  3 rocminfo                 0.03     0.00
	  1 lspci                    0.00     0.02
	 85 sh                       0.00     0.00
	 13 gcc                      0.00     0.00
	  8 gsettings                0.00     0.00
	  8 stat                     0.00     0.00
	  8 systemd-detect-          0.00     0.00
	  6 llvm-link                0.00     0.00
	  5 glxinfo                  0.00     0.00
	  5 gmain                    0.00     0.00
	  5 phoronix-test-s          0.00     0.00
	  3 dconf worker             0.00     0.00
	  3 xnnpack                  0.00     0.00
	  2 cc                       0.00     0.00
	  2 dmesg                    0.00     0.00
	  2 grep                     0.00     0.00
	  2 lscpu                    0.00     0.00
	  2 setterm                  0.00     0.00
	  2 uname                    0.00     0.00
	  2 which                    0.00     0.00
	  1 date                     0.00     0.00
	  1 dirname                  0.00     0.00
	  1 dmidecode                0.00     0.00
	  1 ifconfig                 0.00     0.00
	  1 ip                       0.00     0.00
	  1 lsmod                    0.00     0.00
	  1 mktemp                   0.00     0.00
	  1 ps                       0.00     0.00
	  1 qdbus                    0.00     0.00
	  1 readlink                 0.00     0.00
	  1 realpath                 0.00     0.00
	  1 sed                      0.00     0.00
	  1 sort                     0.00     0.00
	  1 stty                     0.00     0.00
	  1 systemctl                0.00     0.00
	  1 template.sh              0.00     0.00
Process profile shows a lot of short driver calls
      1133056) xnnpack          cpu=4 start=5.23  finish=312.52
        1133057) end2end-bench    cpu=0 start=5.24  finish=312.48
          1133058) end2end-bench    cpu=10 start=5.24  finish=5.33
          1133059) end2end-bench    cpu=5 start=5.24  finish=5.33
          1133060) end2end-bench    cpu=6 start=5.24  finish=5.33
          1133061) end2end-bench    cpu=15 start=5.24  finish=5.33
          1133062) end2end-bench    cpu=0 start=5.24  finish=5.33
          1133063) end2end-bench    cpu=11 start=5.24  finish=5.33
          1133064) end2end-bench    cpu=4 start=5.24  finish=5.33
          1133065) end2end-bench    cpu=13 start=5.24  finish=5.33
          1133066) end2end-bench    cpu=1 start=5.24  finish=5.33
          1133067) end2end-bench    cpu=2 start=5.24  finish=5.33
          1133068) end2end-bench    cpu=14 start=5.24  finish=5.33
          1133069) end2end-bench    cpu=7 start=5.24  finish=5.33
          1133070) end2end-bench    cpu=8 start=5.24  finish=5.33
          1133071) end2end-bench    cpu=3 start=5.24  finish=5.33
          1133072) end2end-bench    cpu=12 start=5.24  finish=5.33
          1133073) end2end-bench    cpu=0 start=5.34  finish=5.44
          1133074) end2end-bench    cpu=6 start=5.34  finish=5.44
          1133075) end2end-bench    cpu=15 start=5.34  finish=5.44
          1133076) end2end-bench    cpu=9 start=5.34  finish=5.44
          1133077) end2end-bench    cpu=12 start=5.34  finish=5.44
          1133078) end2end-bench    cpu=13 start=5.34  finish=5.44
          1133079) end2end-bench    cpu=2 start=5.34  finish=5.43
          1133080) end2end-bench    cpu=3 start=5.34  finish=5.43
          1133081) end2end-bench    cpu=14 start=5.34  finish=5.43
          1133082) end2end-bench    cpu=7 start=5.34  finish=5.43
          1133083) end2end-bench    cpu=8 start=5.34  finish=5.43
          1133084) end2end-bench    cpu=5 start=5.34  finish=5.43
          1133085) end2end-bench    cpu=1 start=5.34  finish=5.43
          1133086) end2end-bench    cpu=10 start=5.34  finish=5.43
          1133087) end2end-bench    cpu=4 start=5.34  finish=5.43
          1133088) end2end-bench    cpu=4 start=5.44  finish=5.73
          1133089) end2end-bench    cpu=6 start=5.44  finish=5.73
          1133090) end2end-bench    cpu=9 start=5.44  finish=5.73
          1133091) end2end-bench    cpu=2 start=5.44  finish=5.73
          1133092) end2end-bench    cpu=0 start=5.44  finish=5.73
          1133093) end2end-bench    cpu=15 start=5.44  finish=5.73
          1133094) end2end-bench    cpu=13 start=5.44  finish=5.73
          1133095) end2end-bench    cpu=3 start=5.44  finish=5.73
          1133096) end2end-bench    cpu=5 start=5.44  finish=5.73
          1133097) end2end-bench    cpu=14 start=5.44  finish=5.73
          1133098) end2end-bench    cpu=1 start=5.44  finish=5.73
          1133099) end2end-bench    cpu=10 start=5.44  finish=5.73
          1133100) end2end-bench    cpu=8 start=5.44  finish=5.73
          1133101) end2end-bench    cpu=7 start=5.44  finish=5.73
          1133102) end2end-bench    cpu=12 start=5.44  finish=5.73
          1133103) end2end-bench    cpu=6 start=5.73  finish=8.37
          1133104) end2end-bench    cpu=0 start=5.73  finish=8.37
          1133105) end2end-bench    cpu=9 start=5.73  finish=8.37
          1133106) end2end-bench    cpu=13 start=5.73  finish=8.37
...