↓
 

Performance analysis, tools and experiments

An eclectic collection

  • Overview
  • Blog
  • Workloads
    • cpu2017
      • 500.perlbench_r
      • 502.gcc_r
      • 503.bwaves_r
      • 505.mcf_r
      • 507.cactuBSSN_r
      • 508.namd_r
      • 510.parest_r
      • 511.povray_r
      • 519.lbm_r
      • 520.omnetpp_r
      • 521.wrf_r
      • 523.xalancbmk_r
      • 525.x264_r
      • 526.blender_r
      • 527.cam4_r
      • 531.deepsjeng_r
      • 538.imagick_r
      • 541.leela_r
      • 544.nab_r
      • 548.exchange2_r
      • 549.fotonik3d_r
      • 554.roms_r
      • 557.xz_r
    • geekbench
    • lmbench
    • passmark
    • pbbs
    • phoronix
      • ai-benchmark
      • aircrack-ng
      • amg
      • aobench
      • aom-av1
      • apache
      • apache-iotdb
      • appleseed
      • arrayfire
      • askap
      • asmfish
      • astcenc
      • avifenc
      • basis
      • blake2
      • blogbench
      • blender
      • blosc
      • bork
      • botan
      • brl-cad
      • build-apache
      • build-clash
      • build-eigen
      • build-erlang
      • build-ffmpeg
      • build-gcc
      • build-gdb
      • build-gem5
      • build-godot
      • build-imagemagick
      • build-linux-kernel
      • build-llvm
      • build-mesa
      • build-mplayer
      • build-nodejs
      • build-php
      • build-python
      • build-wasmer
      • build2
      • bullet
      • byte
      • cachebench
      • cassandra
      • clickhouse
      • clomp
      • cloverleaf
      • cockroach
      • compilebench
      • compress-7zip
      • compress-gzip
      • compress-lz4
      • compress-pbzip2
      • compress-rar
      • compress-xz
      • compress-zstd
      • core-latency
      • coremark
      • cp2k
      • cpp-perf-bench
      • cpuminer-opt
      • crafty
      • c-ray
      • cryptopp
      • cryptsetup
      • ctx-clock
      • cython-bench
      • dacapobench
      • daphne
      • darktable
      • dav1d
      • dbench
      • deepsparse
      • deepspeech
      • dolfyn
      • draco
      • dragonflydb
      • duckdb
      • easywave
      • ebizzy
      • embree
      • encode-flac
      • encode-mp3
      • encode-opus
      • encode-wavpack
      • espeak
      • etcpak
      • faiss
      • fast-cli
      • ffmpeg
      • ffte
      • fftw
      • fhourstones
      • financebench
      • furmark
      • gcrypt
      • gegl
      • gimp
      • git
      • glibc-bench
      • gmpbench
      • gnupg
      • gnuradio
      • go-benchmark
      • gpaw
      • graph500
      • graphics-magick
      • gromacs
      • hackbench
      • hadoop
      • heffte
      • helsing
      • himeno
      • hmmer
      • hpcg
      • incompact3d
      • indigobench
      • inkscape
      • ipc-benchmark
      • java-jmh
      • java-scimark2
      • john-the-ripper
      • jpegxl
      • jpegxl-decode
      • kvazaar
      • kripke
      • lammps
      • lczero
      • libraw
      • libreoffice
      • libxsmm
      • liquid-dsp
      • llama.cpp
      • llamafile
      • lulesh
      • lzbench
      • mbw
      • memcached
      • minibude
      • minife
      • mnn
      • mpcbench
      • m-queens
      • mrbayes
      • mutex
      • namd
      • mt-dgemm
      • ncnn
      • neat
      • nettle
      • nginx
      • ngspice
      • node-octane
      • node-web-tooling
      • npb
      • n-queens
      • numpy
      • nwchem
      • oidn
      • onednn
      • octave-benchmark
      • onnx
      • opencv
      • openfoam
      • openjpeg
      • openssl
      • openradioss
      • openscad
      • openvino
      • openvkl
      • ospray
      • ospray-studio
      • palabos
      • parboil
      • pennant
      • perl-benchmark
      • pgbench
      • phpbench
      • pjsip
      • polybench-c
      • polyhedron
      • povray
      • primesieve
      • pybench
      • pyhpc
      • pyperformance
      • pytorch
      • quadray
      • qe
      • qmcpack
      • quantlib
      • quicksilver
      • ramspeed
      • rav1e
      • rawtherapee
      • rbenchmark
      • redis
      • renaissance
      • rnnoise
      • rocksdb
      • rodinia
      • rsvg
      • schbench
      • scikit-learn
      • scimark2
      • scylladb
      • securemark
      • selenium
      • simdjson
      • smallpt
      • smhasher
      • spark
      • spark-tpcds
      • speedb
      • specfem3d
      • sqlite
      • srsran
      • stargate
      • stockfish
      • stream
      • stress-ng
      • svt-av1
      • svt-hevc
      • svt-vp9
      • sudokut
      • synthmark
      • sysbench
      • tensorflow
      • tensorflow-lite
      • tesseract
      • tjbench
      • tnn
      • toybrot
      • tscp
      • ttsiod-renderer
      • tungsten
      • uvg266
      • vkpeak
      • vpxenc
      • v-ray
      • vvenc
      • webp
      • webp2
      • whisper.cpp
      • whisperfile
      • wireguard
      • x264
      • x265
      • xmrig
      • xnnpack
      • y-cruncher
      • z3
    • stream
  • Tools
    • Compilers
    • likwid
    • perf
    • trace-cmd and kernelshark
    • wspy
  • Experiments
    • Histograms
    • clustering
    • Adding summary statistics for all benchmarks
  • Home
  • Blog
  • Workloads
    • cpu2017
      • 500.perlbench_r
      • 502.gcc_r
      • 503.bwaves_r
      • 505.mcf_r
      • 507.cactuBSSN_r
      • 508.namd_r
      • 510.parest_r
      • 511.povray_r
      • 519.lbm_r
      • 520.omnetpp_r
      • 521.wrf_r
      • 523.xalancbmk_r
      • 525.x264_r
      • 526.blender_r
      • 527.cam4_r
      • 531.deepsjeng_r
      • 538.imagick_r
      • 541.leela_r
      • 544.nab_r
      • 548.exchange2_r
      • 549.fotonik3d_r
      • 554.roms_r
      • 557.xz_r
    • geekbench
    • lmbench
    • passmark
    • pbbs
    • phoronix
      • ai-benchmark
      • aircrack-ng
      • amg
      • aobench
      • aom-av1
      • apache
      • apache-iotdb
      • appleseed
      • arrayfire
      • askap
      • asmfish
      • astcenc
      • avifenc
      • b
      • basis
      • blake2
      • blender
      • blogbench
      • blosc
      • bork
      • botan
      • brl-cad
      • build-apache
      • build-clash
      • build-eigen
      • build-erlang
      • build-ffmpeg
      • build-gcc
      • build-gdb
      • build-gem5
      • build-godot
      • build-imagemagick
      • build-linux-kernel
      • build-llvm
      • build-mesa
      • build-mplayer
      • build-nodejs
      • build-php
      • build-python
      • build-wasmer
      • build2
      • bullet
      • byte
      • c-ray
      • cachebench
      • cassandra
      • clickhouse
      • clomp
      • cloverleaf
      • cockroach
      • compilebench
      • compress-7zip
      • compress-gzip
      • compress-lz4
      • compress-pbzip2
      • compress-rar
      • compress-xz
      • compress-zstd
      • core-latency
      • coremark
      • cp2k
      • cpp-perf-bench
      • cpuminer-opt
      • crafty
      • cryptopp
      • cryptsetup
      • ctx-clock
      • cython-bench
      • dacapobench
      • daphne
      • darktable
      • dav1d
      • dbench
      • deepsparse
      • deepspeech
      • dolfyn
      • draco
      • dragonflydb
      • duckdb
      • easywave
      • ebizzy
      • embree
      • encode-flac
      • encode-mp3
      • encode-opus
      • encode-wavpack
      • espeak
      • etcpak
      • faiss
      • fast-cli
      • ffmpeg
      • ffte
      • fftw
      • fhourstones
      • financebench
      • furmark
      • gcrypt
      • gegl
      • gimp
      • git
      • glibc-bench
      • gmpbench
      • gnupg
      • gnuradio
      • go-benchmark
      • gpaw
      • graph500
      • graphics-magick
      • gromacs
      • hackbench
      • hadoop
      • heffte
      • helsing
      • himeno
      • hmmer
      • hpcg
      • incompact3d
      • indigobench
      • inkscape
      • ipc-benchmark
      • java-jmh
      • java-scimark2
      • john-the-ripper
      • jpegxl
      • jpegxl-decode
      • kripke
      • kvazaar
      • lammps
      • lczero
      • libraw
      • libreoffice
      • libxsmm
      • liquid-dsp
      • llama.cpp
      • llamafile
      • lulesh
      • lzbench
      • m-queens
      • mbw
      • memcached
      • minibude
      • minife
      • mnn
      • mpcbench
      • mrbayes
      • mt-dgemm
      • mutex
      • n-queens
      • namd
      • ncnn
      • neat
      • nettle
      • nginx
      • ngspice
      • node-octane
      • node-web-tooling
      • npb
      • numpy
      • nwchem
      • octave-benchmark
      • oidn
      • onednn
      • onnx
      • opencv
      • openfoam
      • openjpeg
      • openradioss
      • openscad
      • openssl
      • openvino
      • openvkl
      • ospray
      • ospray-studio
      • palabos
      • parboil
      • pennant
      • perl-benchmark
      • pgbench
      • phpbench
      • pjsip
      • polybench-c
      • polyhedron
      • povray
      • primesieve
      • pybench
      • pyhpc
      • pyperformance
      • pytorch
      • qe
      • qmcpack
      • quadray
      • quantlib
      • quicksilver
      • ramspeed
      • rav1e
      • rawtherapee
      • rays1bench
      • rbenchmark
      • redis
      • renaissance
      • rnnoise
      • rocksdb
      • rodinia
      • rsvg
      • schbench
      • scikit-learn
      • scimark2
      • scylladb
      • securemark
      • selenium
      • simdjson
      • smallpt
      • smhasher
      • spark
      • spark-tpcds
      • specfem3d
      • speedb
      • sqlite
      • srsran
      • stargate
      • stockfish
      • stream
      • stress-ng
      • sudokut
      • svt-av1
      • svt-hevc
      • svt-vp9
      • synthmark
      • sysbench
      • tensorflow
      • tensorflow-lite
      • tesseract
      • tjbench
      • tnn
      • toybrot
      • tscp
      • ttsiod-renderer
      • tungsten
      • uvg266
      • v-ray
      • vkpeak
      • vpxenc
      • vvenc
      • webp
      • webp2
      • whisper.cpp
      • whisperfile
      • wireguard
      • x264
      • x265
      • xmrig
      • xnnpack
      • y-cruncher
      • z3
    • stream
  • Tools
    • Compilers
    • likwid
    • perf
    • trace-cmd and kernelshark
    • wspy
  • Experiments
Home→Published 2024 → March

Monthly Archives: March 2024

graphics-magick sharpen, compiler improvements

Performance analysis, tools and experiments Posted on March 19, 2024 by mevMarch 19, 2024

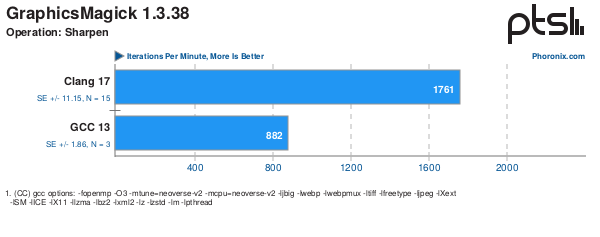
The following Phoronix Article – https://www.phoronix.com/review/nvidia-gh200-compilers compares GCC 13.2 with Clang 17.0.2 on an ARM platform. On the discussions attached the improvement for graphics-magick sharpen benchmark particularly stand out. So I thought I would see if I could see a similar improvement and using performance tools could spot likely areas contributing to the difference.

My system has Ubuntu 22.04 system compiler or gcc 11.4 and also aocc 4.1 based on clang 16.0.3 so not exactly the same but close enough. I forced a rebuild by reinstalling the test and setting environment variables, e.g.

export CC=/opt/AMD/aocc-compiler-4.1.0/bin/clang
export CXX=/opt/AMD/aocc-compiler-4.1.0/bin/clang++
export CFLAGS="-O3 -march=native"
export CXXFLAGS="-O3 -march=native"

With these differences, I see the following with gcc 11.4

    Operation: Sharpen:
        107
        108
        108

    Average: 108 Iterations Per Minute
    Deviation: 0.54%

and the following differences with clang 16.0

    Operation: Sharpen:
        177
        178
        178

    Average: 178 Iterations Per Minute
    Deviation: 0.32%

So overall a 1.65x speedup. Noy quite the 2x speedup seen on the AArch64 system but close enough given different compilers.

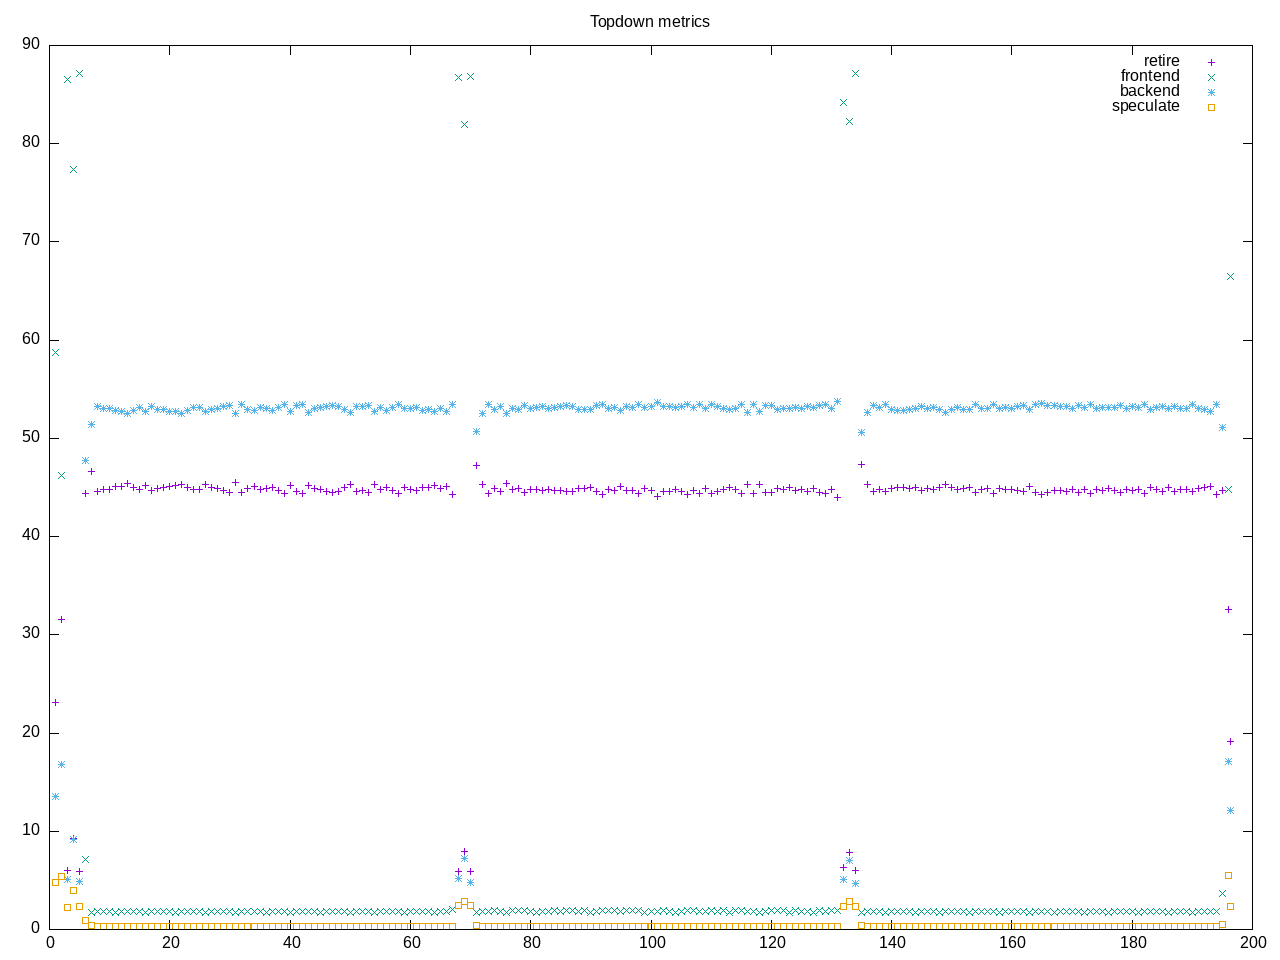
Here is what my topdown profile shows for gcc

Here is the comparison point with clang

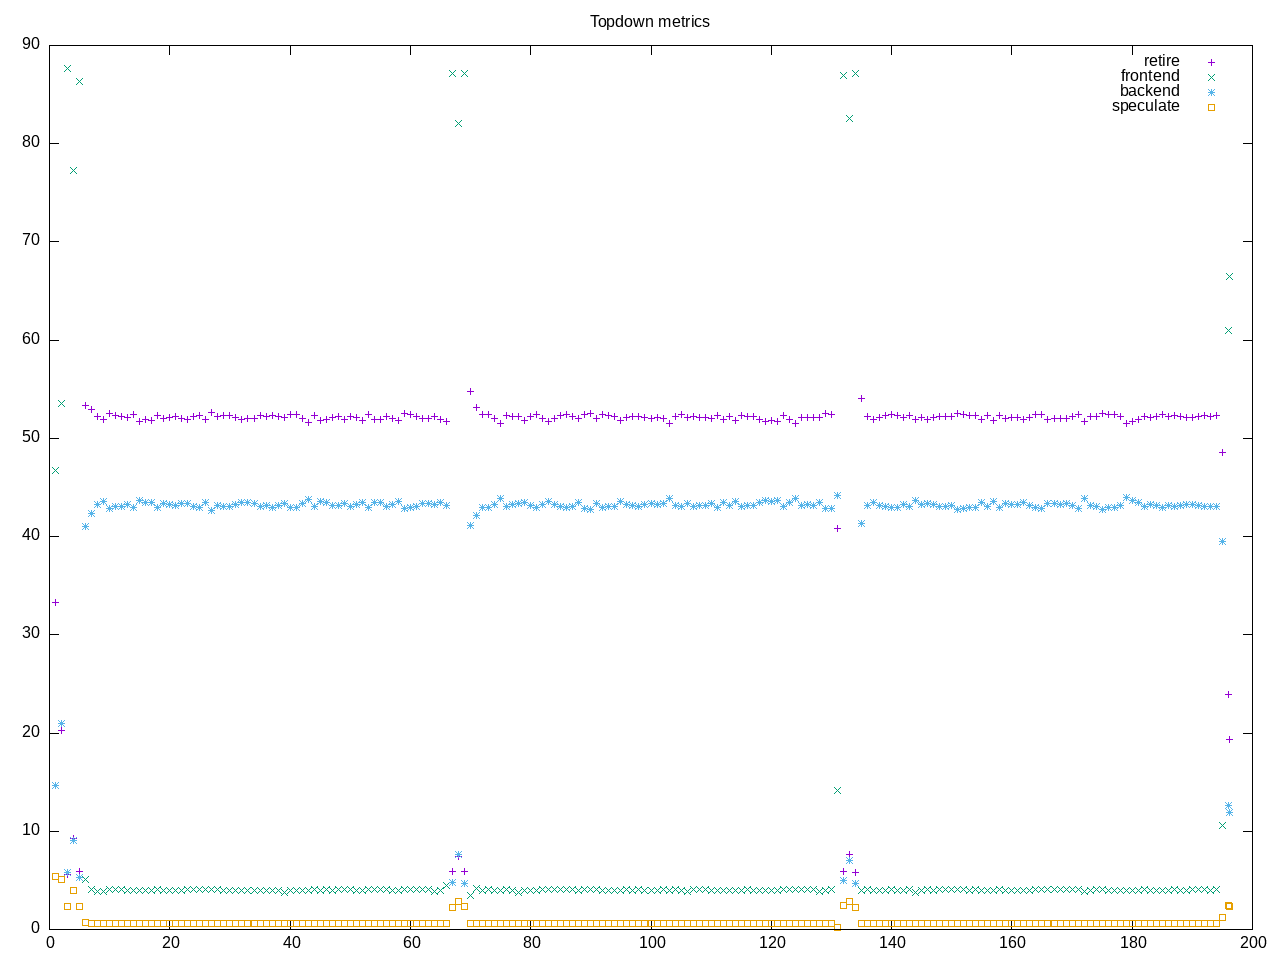
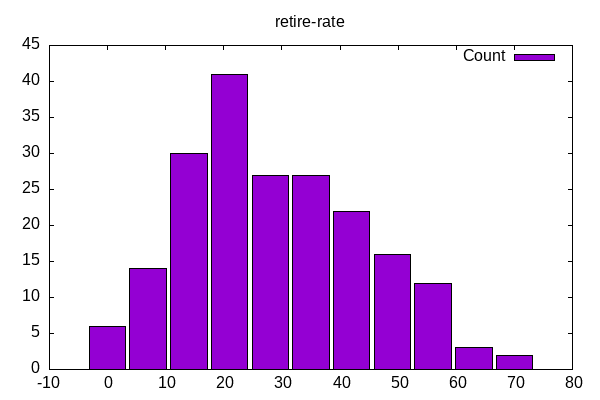
Interestingly the total runtime is close to the same (time-bound test?) but we definitely have dropped backend stalls in favor of retiring a higher percentage of instructions.

Here is what the metrics show for gcc

elapsed              196.669
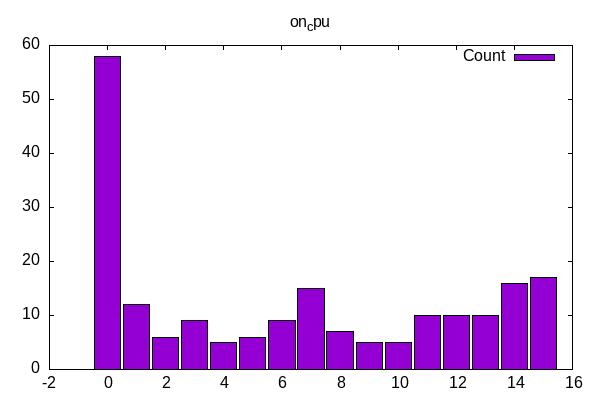
on_cpu               0.912          # 14.59 / 16 cores
utime                2847.753
stime                22.595
nvcsw                7799           # 21.59%
nivcsw               28324          # 78.41%
inblock              72             # 0.37/sec
onblock              12832          # 65.25/sec
cpu-clock            2870386800612  # 2870.387 seconds
task-clock           2870418438024  # 2870.418 seconds
page faults          8219671        # 2863.579/sec
context switches     36937          # 12.868/sec
cpu migrations       252            # 0.088/sec
major page faults    3              # 0.001/sec
minor page faults    8219668        # 2863.578/sec
alignment faults     0              # 0.000/sec
emulation faults     0              # 0.000/sec
branches             1140203600927  # 59.971 branches per 1000 inst
branch misses        9706629710     # 0.85% branch miss
conditional          1123801038031  # 59.108 conditional branches per 1000 inst
indirect             79758239       # 0.004 indirect branches per 1000 inst
cpu-cycles           12006859596451 # 3.83 GHz
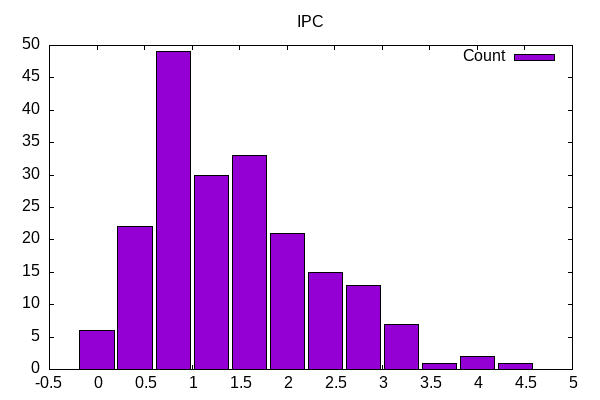
instructions         18841741204039 # 1.57 IPC
slots                24015874376394 #
retiring             6873291214752  # 28.6% (44.9%)
-- ucode             776914684      #     0.0%
-- fastpath          6872514300068  #    28.6%
frontend             280560426894   #  1.2% ( 1.8%) low
-- latency           204333739230   #     0.9%
-- bandwidth         76226687664    #     0.3%
backend              8106573021445  # 33.8% (52.9%)
-- cpu               7904629941195  #    32.9%
-- memory            201943080250   #     0.8%
speculation          52507444606    #  0.2% ( 0.3%) low
-- branch mispredict 52421287288    #     0.2%
-- pipeline restart  86157318       #     0.0%
smt-contention       8702915928072  # 36.2% ( 0.0%)
cpu-cycles           12008757786517 # 3.84 GHz
instructions         18832540244485 # 1.57 IPC
instructions         6279648919771  # 2.124 l2 access per 1000 inst
l2 hit from l1       7173349879     # 20.29% l2 miss
l2 miss from l1      704685663      #
l2 hit from l2 pf    4162164156     #
l3 hit from l2 pf    1757001598     #
l3 miss from l2 pf   244954442      #
instructions         6277843164084  # 351.548 float per 1000 inst
float 512            57             # 0.000 AVX-512 per 1000 inst
float 256            584            # 0.000 AVX-256 per 1000 inst
float 128            2206965520855  # 351.548 AVX-128 per 1000 inst
float MMX            0              # 0.000 MMX per 1000 inst
float scalar         0              # 0.000 scalar per 1000 inst
instructions         18950819136221 #
opcache              2107351794817  # 111.201 opcache per 1000 inst
opcache miss         9523189344     #  0.5% opcache miss rate
l1 dTLB miss         902958198      # 0.048 L1 dTLB per 1000 inst
l2 dTLB miss         68055690       # 0.004 L2 dTLB per 1000 inst
instructions         18892305597227 #
icache               18578037535    # 0.983 icache per 1000 inst
icache miss          1477678165     #  8.0% icache miss rate
l1 iTLB miss         8626682        # 0.000 L1 iTLB per 1000 inst
l2 iTLB miss         0              # 0.000 L2 iTLB per 1000 inst
tlb flush            34816          # 0.000 TLB flush per 1000 inst

Here is what they show for clang

elapsed              198.605
on_cpu               0.910          # 14.55 / 16 cores
utime                2846.489
stime                43.933
nvcsw                10817          # 26.18%
nivcsw               30507          # 73.82%
inblock              8              # 0.04/sec
onblock              12904          # 64.97/sec
cpu-clock            2890592540363  # 2890.593 seconds
task-clock           2890613273288  # 2890.613 seconds
page faults          13446401       # 4651.747/sec
context switches     42134          # 14.576/sec
cpu migrations       320            # 0.111/sec
major page faults    51             # 0.018/sec
minor page faults    13446350       # 4651.729/sec
alignment faults     0              # 0.000/sec
emulation faults     0              # 0.000/sec
branches             1895985554702  # 85.338 branches per 1000 inst
branch misses        16208435546    # 0.85% branch miss
conditional          1856679790302  # 83.569 conditional branches per 1000 inst
indirect             162624101      # 0.007 indirect branches per 1000 inst
cpu-cycles           11802414391046 # 3.76 GHz
instructions         22167963494891 # 1.88 IPC
slots                23606223963606 #
retiring             7476214292393  # 31.7% (52.1%)
-- ucode             3459130581     #     0.0%
-- fastpath          7472755161812  #    31.7%
frontend             577593637926   #  2.4% ( 4.0%) low
-- latency           362394713874   #     1.5%
-- bandwidth         215198924052   #     0.9%
backend              6205319253065  # 26.3% (43.3%)
-- cpu               5685432163067  #    24.1%
-- memory            519887089998   #     2.2%
speculation          83292194787    #  0.4% ( 0.6%) low
-- branch mispredict 83160520795    #     0.4%
-- pipeline restart  131673992      #     0.0%
smt-contention       9263789209330  # 39.2% ( 0.0%)
cpu-cycles           11818914678350 # 3.74 GHz
instructions         22211450935976 # 1.88 IPC
instructions         7404943446705  # 2.939 l2 access per 1000 inst
l2 hit from l1       11586386135    # 19.79% l2 miss
l2 miss from l1      1111590991     #
l2 hit from l2 pf    6979543347     #
l3 hit from l2 pf    2793906722     #
l3 miss from l2 pf   399941912      #
instructions         7400104673984  # 491.708 float per 1000 inst
float 512            72             # 0.000 AVX-512 per 1000 inst
float 256            668            # 0.000 AVX-256 per 1000 inst
float 128            3638689694804  # 491.708 AVX-128 per 1000 inst
float MMX            0              # 0.000 MMX per 1000 inst
float scalar         0              # 0.000 scalar per 1000 inst
instructions         22251978896991 #
opcache              3428837218389  # 154.091 opcache per 1000 inst
opcache miss         16257852042    #  0.5% opcache miss rate
l1 dTLB miss         1527716103     # 0.069 L1 dTLB per 1000 inst
l2 dTLB miss         108536720      # 0.005 L2 dTLB per 1000 inst
instructions         22248633347533 #
icache               35471913129    # 1.594 icache per 1000 inst
icache miss          1971706421     #  5.6% icache miss rate
l1 iTLB miss         9490954        # 0.000 L1 iTLB per 1000 inst
l2 iTLB miss         0              # 0.000 L2 iTLB per 1000 inst
tlb flush            71325          # 0.000 TLB flush per 1000 inst

Looking with a rough comparison I notice:

  • User time is almost identical so likely some time-bounded loop
  • There are more instructions overall, and particularly AVX-128 has gone from 351 per thousand to 491 per thousand. The number of branches has also gone up
  • IPC has gone from 1.57 to 1.88.

Based on this my likely guess is some greater vectorization to tighten the core loop. This indirectly results in more branches (smaller loop). CPU stalls still contribute most to backend stalls but have gone down while number of vector instructions have gone up.

There may be other more direct ways to compare compiler options and results, but this is at least an indirect way to view the effects looking at the overall performance characterization.

Posted in experiment | Tagged benchmarks, compiler, phoronix | Leave a reply

200 phoronix tests

Performance analysis, tools and experiments Posted on March 4, 2024 by mevMarch 4, 2024

I passed over 200 Phoronix tests added. There were a little over 10 benchmark articles in February. I seem to have most all the benchmarks when an article comes out and only needed to add one or two for some of them. So I think I am coming closer to saturating the number of (non-graphics) test cases. There are still some looking at the list of available tests and so I have been gradually adding a few stragglers but expect it to top out around 250 applications.

One thing that is nice about this population is that it lets me look at some aggregate statistics about the types of tests, e.g. below is an IPC profile followed by a retirement rate example.

Here is a profile about the amount of “on_core” for these compared to the 16-cores available. This shows an interesting distribution with the largest number of single-threaded applications and then a small number running on all cores.

Unlike a test set like SPEC CPU specifically designed to run mostly all the time on the CPU, this is a broader set of applications with different blocking issues including not necessarily being on the CPU. A tradeoff the other direction is that it isn’t as easy to see the effects of compilers and optimizations for these tests.

As I get closer to an asymptotic limit of ~250 there can also now be other directions. Perhaps diving deeper into the CPU type metrics, or perhaps going deeper on a CPU-specific benchmark with different options?

Posted in experiment | Tagged benchmarks, phoronix | Leave a reply

cachyos and namd

Performance analysis, tools and experiments Posted on March 2, 2024 by mevMarch 2, 2024

cachyos.org is a Arch distribution designed to be quick. Several techniques are used including having packages compiled for the ISA rather than a generic. A the following Phoronix article shows the v3 (modern ISA) packages generally win and the v4 (AVX-512) packages are slightly better but also have regressions.

So I installed cachyos on a 7940HS AMD system and compared it against Ubuntu 22.04 on a similar system. The overall numbers are 6.5% better on the first workload and 5.8% better on the second workload.

Following is for cachyos

NAMD 3.0b6:
    pts/namd-1.3.1 [Input: ATPase with 327,506 Atoms]
    Test 1 of 2
    Estimated Trial Run Count:    3                     
    Estimated Test Run-Time:      3 Minutes             
    Estimated Time To Completion: 9 Minutes [13:33 UTC] 
        Started Run 1 @ 13:24:53
        Started Run 2 @ 13:25:35
        Started Run 3 @ 13:26:16

    Input: ATPase with 327,506 Atoms:
        1.3094369813811
        1.3209132265683
        1.3370467578622

    Average: 1.32247 ns/day
    Deviation: 1.05%

NAMD 3.0b6:
    pts/namd-1.3.1 [Input: STMV with 1,066,628 Atoms]
    Test 2 of 2
    Estimated Trial Run Count:    3                     
    Estimated Time To Completion: 7 Minutes [13:33 UTC] 
        Started Run 1 @ 13:27:02
        Started Run 2 @ 13:29:06
        Started Run 3 @ 13:31:09

    Input: STMV with 1,066,628 Atoms:
        0.38845511401158
        0.3892307632426
        0.39149056116257

    Average: 0.38973 ns/day
    Deviation: 0.40%

and the following for Ubuntu

NAMD 3.0b6:
    pts/namd-1.3.1 [Input: ATPase with 327,506 Atoms]
    Test 1 of 2
    Estimated Trial Run Count:    3                     
    Estimated Test Run-Time:      3 Minutes             
    Estimated Time To Completion: 9 Minutes [09:21 CST] 
        Started Run 1 @ 09:12:59
        Started Run 2 @ 09:13:42
        Started Run 3 @ 09:14:25

    Input: ATPase with 327,506 Atoms:
        1.2429462798618
        1.2405624213794
        1.2391773349509

    Average: 1.24090 ns/day
    Deviation: 0.15%

NAMD 3.0b6:
    pts/namd-1.3.1 [Input: STMV with 1,066,628 Atoms]
    Test 2 of 2
    Estimated Trial Run Count:    3                     
    Estimated Time To Completion: 7 Minutes [09:21 CST] 
        Started Run 1 @ 09:15:14
        Started Run 2 @ 09:17:24
        Started Run 3 @ 09:19:36

    Input: STMV with 1,066,628 Atoms:
        0.37073149030352
        0.36840554081933
        0.36519408239509

    Average: 0.36811 ns/day
    Deviation: 0.76%

Comparing my performance metrics shows

  • 1/3 reduction in system time
  • 3.8 GHz instead of 3.6 GHz

Most of the workload metrics including floating point are very similar.

Following is are the overall metrics for cachyos

elapsed              495.359
on_cpu               0.919          # 14.71 / 16 cores
utime                7264.584
stime                20.290
nvcsw                174165         # 71.79%
nivcsw               68431          # 28.21%
inblock              0              # 0.00/sec
onblock              3848           # 7.77/sec
cpu-clock            7359760148766  # 7359.760 seconds
task-clock           7359865910736  # 7359.866 seconds
page faults          3872735        # 526.196/sec
context switches     244414         # 33.209/sec
cpu migrations       503            # 0.068/sec
major page faults    0              # 0.000/sec
minor page faults    3872735        # 526.196/sec
alignment faults     0              # 0.000/sec
emulation faults     0              # 0.000/sec
branches             1897775256392  # 76.988 branches per 1000 inst
branch misses        39722841032    # 2.09% branch miss
conditional          1509458303101  # 61.235 conditional branches per 1000 inst
indirect             49014559620    # 1.988 indirect branches per 1000 inst
cpu-cycles           30431898149240 # 3.80 GHz
instructions         24655998647905 # 0.81 IPC
slots                60848642266458 #
retiring             10719221264151 # 17.6% (22.1%)
-- ucode             56759595164    #     0.1%
-- fastpath          10662461668987 #    17.5%
frontend             10432837231580 # 17.1% (21.6%)
-- latency           8735537140284  #    14.4%
-- bandwidth         1697300091296  #     2.8%
backend              26123312845140 # 42.9% (54.0%)
-- cpu               15479675594829 #    25.4%
-- memory            10643637250311 #    17.5%
speculation          1125198830253  #  1.8% ( 2.3%)
-- branch mispredict 945591758746   #     1.6%
-- pipeline restart  179607071507   #     0.3%
smt-contention       12447893595568 # 20.5% ( 0.0%)
cpu-cycles           30432992029522 # 3.81 GHz
instructions         24655633594125 # 0.81 IPC
instructions         8213813061144  # 24.296 l2 access per 1000 inst
l2 hit from l1       139816264099   # 18.94% l2 miss
l2 miss from l1      14272375641    #
l2 hit from l2 pf    36215623282    #
l3 hit from l2 pf    2654557357     #
l3 miss from l2 pf   20872911653    #
instructions         8211249455440  # 182.438 float per 1000 inst
float 512            53             # 0.000 AVX-512 per 1000 inst
float 256            39471842819    # 4.807 AVX-256 per 1000 inst
float 128            1458574293164  # 177.631 AVX-128 per 1000 inst
float MMX            0              # 0.000 MMX per 1000 inst
float scalar         3837           # 0.000 scalar per 1000 inst
instructions         24639840844799 #
opcache              4278105143452  # 173.626 opcache per 1000 inst
opcache miss         66805357105    #  1.6% opcache miss rate
l1 dTLB miss         28144769542    # 1.142 L1 dTLB per 1000 inst
l2 dTLB miss         2914548040     # 0.118 L2 dTLB per 1000 inst
instructions         24757437810677 #
icache               95378615773    # 3.853 icache per 1000 inst
icache miss          20027564740    # 21.0% icache miss rate
l1 iTLB miss         353644845      # 0.014 L1 iTLB per 1000 inst
l2 iTLB miss         0              # 0.000 L2 iTLB per 1000 inst
tlb flush            53161          # 0.000 TLB flush per 1000 inst

Following are the metrics for ubuntu

elapsed              534.402
on_cpu               0.933          # 14.93 / 16 cores
utime                7946.582
stime                31.785
nvcsw                159398         # 68.33%
nivcsw               73870          # 31.67%
inblock              0              # 0.00/sec
onblock              107872         # 201.86/sec
cpu-clock            7979741490188  # 7979.741 seconds
task-clock           7979891388497  # 7979.891 seconds
page faults          4288047        # 537.357/sec
context switches     235752         # 29.543/sec
cpu migrations       555            # 0.070/sec
major page faults    391            # 0.049/sec
minor page faults    4287656        # 537.308/sec
alignment faults     0              # 0.000/sec
emulation faults     0              # 0.000/sec
branches             1925290347271  # 77.458 branches per 1000 inst
branch misses        38840160112    # 2.02% branch miss
conditional          1517305547805  # 61.044 conditional branches per 1000 inst
indirect             50858503572    # 2.046 indirect branches per 1000 inst
cpu-cycles           31169386494557 # 3.61 GHz
instructions         24971268101144 # 0.80 IPC
slots                62339872752540 #
retiring             10839188885703 # 17.4% (21.8%)
-- ucode             54615869178    #     0.1%
-- fastpath          10784573016525 #    17.3%
frontend             10368247652561 # 16.6% (20.8%)
-- latency           8672309211630  #    13.9%
-- bandwidth         1695938440931  #     2.7%
backend              27434861319569 # 44.0% (55.1%)
-- cpu               16334908995677 #    26.2%
-- memory            11099952323892 #    17.8%
speculation          1114337539722  #  1.8% ( 2.2%)
-- branch mispredict 932720011460   #     1.5%
-- pipeline restart  181617528262   #     0.3%
smt-contention       12583164650371 # 20.2% ( 0.0%)
cpu-cycles           31195692318508 # 3.61 GHz
instructions         24862284718475 # 0.80 IPC
instructions         8286838897986  # 23.231 l2 access per 1000 inst
l2 hit from l1       135748832053   # 19.01% l2 miss
l2 miss from l1      13484958347    #
l2 hit from l2 pf    33649472706    #
l3 hit from l2 pf    2330209780     #
l3 miss from l2 pf   20785824419    #
instructions         8288576901008  # 183.896 float per 1000 inst
float 512            68             # 0.000 AVX-512 per 1000 inst
float 256            39465430187    # 4.761 AVX-256 per 1000 inst
float 128            1484772747474  # 179.135 AVX-128 per 1000 inst
float MMX            0              # 0.000 MMX per 1000 inst
float scalar         754            # 0.000 scalar per 1000 inst
instructions         24970173846783 #
opcache              4332161426447  # 173.493 opcache per 1000 inst
opcache miss         63720650094    #  1.5% opcache miss rate
l1 dTLB miss         29343624637    # 1.175 L1 dTLB per 1000 inst
l2 dTLB miss         3279370921     # 0.131 L2 dTLB per 1000 inst
instructions         24960638488597 #
icache               88015691133    # 3.526 icache per 1000 inst
icache miss          17928613619    # 20.4% icache miss rate
l1 iTLB miss         2049956023     # 0.082 L1 iTLB per 1000 inst
l2 iTLB miss         0              # 0.000 L2 iTLB per 1000 inst
tlb flush            48995          # 0.000 TLB flush per 1000 inst

Looking a little deeper, it looks like the namd package comes with pre-compiled binaries, so what I am comparing is more other parts of the system than my own compilations…For example a reduction of system time for the namd executable from 460.5 seconds to 285 seconds.

That makes it useful to remember that compilation might occur for the benchmark, but it can also happen earlier such as at installation or using pre-compiled binaries. Based on this, I need to find tests that actually compile rather than just run compiled binaries. A quick check using a grep of the process tree suggests a few possibilities including polyhedron and openfoam.

For example gfortran includes the following compilations

gfortran -ffast-math -funroll-loops -O3 ac.f90 -o ac

However, that seems to be built into the script and other than gfortran picking up things from the environment might not change. So it probably comes down to building with different options.

A further check of cachyos trying to install lczero results in build errors. So my general conclusion is that Ubuntu seems to make the most sense as a general build/benchmark platform but cachyos can be useful for trying specific OS package related changes. To check the effects of particular ISAs I might either need to find specific benchmarks e.g. polyhedron or SPEC and recompile them to compare results.

Posted in experiment | Tagged cachyos, namd | Leave a reply

Meta

  • Log in
  • Entries feed
  • Comments feed
  • WordPress.org

Archives

  • November 2024
  • October 2024
  • September 2024
  • July 2024
  • June 2024
  • March 2024
  • February 2024
  • January 2024
  • December 2023
  • February 2023

Tags

7840HS bad data benchmarks cachyos cluster compiler coremark cpu2017 data fabric getrusage gnuplot i5-13500H icache ipc kernel l3 metrics namd opcache perf performance counters perf_event_open phoronix Ryzen AI 9 HX 370 Ryzen AI 365 scaling stream threshold topdown tree virtualization website wsl Zen5

Recent Posts

  • Virtualization comparisons
  • Updating to a new kernel and graphics driver
  • SPEC CPU2017 Ryzen AI HX 370 vs. Ryzen 7840 HS
  • phoronix – Ryzen AI HX 370 vs Ryzen 7840 HS
  • New Ryzen AI 9 HX 370 machine
©2026 - Performance analysis, tools and experiments - Weaver Xtreme Theme
↑